$ETHUSD Bullpost - Another indicator points to $6.05kHey folks!
Adding to the bullish case for ETHUSD, we have spotted a clear Inverse Head and Shoulders (IHS) pattern on the weekly timeframe—a classic reversal signal with strong upside potential.
1MO Macro TA:
Key Levels to Watch:
Neckline Break: Price has already tested and is flirting with breakout confirmation.
Targets: If this plays out, the measured move aligns with the 6.4k–8k target zone highlighted previously.
Momentum is building across multiple timeframes. The long-term bullish structures (Cup & Handle, Bull Pennant) remain intact, and this new IHS setup strengthens the conviction for a breakout into price discovery.
2WK ETHBTC:
Stay sharp, watch volume, and manage risk. NFA DYOR.
VAMOS
Credit to @sumairk for initially bringing this to my attention.
Pennant

Cup and Handle 600% upside potential.There is what looks like to me to be a Cup and Handle on DTST with massive upside potential if it plays out.
Price target for measured move about $32, short term target $6.

AI16Z Price Rockets 30% As Crypto Whales Invest $4 MillionThe cryptocurrency market has witnessed yet another explosive movement, this time from AI16Z, a groundbreaking AI-driven project. With a 30% price surge in the last 24 hours, AI16Z has set the stage for potential long-term bullish momentum.
Crypto Whale Activity Sparks Confidence
The recent surge in AI16Z’s price can be attributed to significant whale activity. Notable transactions include:
- Two whale wallets, “6ZFcxR…JkZV” and “HRQXKj…bVFr,” purchased 2.62 million tokens worth $4.34 million.
- Wallet “FU9b2c…fHyc” acquired 1.19 million tokens for $1.65 million.
- Wallet “B6FsUN…XzDV” purchased 869K tokens for $1.09 million.
- Wallet “AVLKwK…x1Mv” bought 998K tokens for $1.22 million.
These high-profile purchases reflect growing confidence in AI16Z’s potential, with whales positioning themselves for future gains as the project garners attention within the crypto and AI sectors.
Technical Analysis
AI16Z’s price action reveals a bullish flag pattern that triggered the recent 30% surge. However, this rally has faced short-term resistance, with the price currently up 0.26% and trading at $1.71. Here’s what the charts suggest:
- Support Levels:
- Immediate support at $1.33, aligning with the 61.8% Fibonacci retracement level.
- A potential dip to this level (an 18% correction) could create a buy opportunity for traders.
- Resistance Levels:
- Current resistance at $1.77, the recent high.
- A breakout above this level could push the price towards new highs, potentially targeting $2.00.
AI16Z’s Vision and Innovation
AI16Z is more than just a token; it represents a paradigm shift in AI-driven ventures. Here’s what sets it apart:
- AI Leadership: The project is led by AI agents, a pioneering move in the venture capital space.
- Ecosystem Development: AI16Z aims to connect AI entrepreneurs, investors, and experts, fostering innovation in a rapidly evolving sector.
- Future Plans: The introduction of a launchpad for AI-driven projects using the Eliza framework promises sustained value accrual. AI16Z is also poised to become the primary currency for agent-to-agent transactions, incentivizing developers and enhancing ecosystem utility.
Market Context and Performance
AI16Z’s current market dynamics highlight its growing prominence:
- Market Cap: $1.8 billion, ranking #201 on CoinMarketCap.
- Trading Volume: $256 million in the last 24 hours, signaling strong market activity.
- All-Time High: $1.771, achieved recently.
- All-Time Low: $0.002979, recorded two months ago, marking a 2,791.76% increase since then.
The broader crypto market’s focus on AI-related projects has bolstered AI16Z’s appeal, with analysts attributing its rally to advancements in AI technology and strategic whale accumulation.
Conclusion: What’s Next for AI16Z?
AI16Z’s recent surge underscores its potential as a leader in decentralized AI innovation. While a short-term correction to $1.33 could be on the horizon, the project’s robust fundamentals and whale-backed confidence suggest sustained upward momentum in the long run.
As AI technology continues to reshape industries, AI16Z is well-positioned to capitalize on this trend, making it a token to watch in 2024 and beyond. Traders and investors should keep an eye on key support and resistance levels, as well as upcoming developments in the project’s ecosystem.

EURUSDSave the idea! big pennant and small pennant plus 5 drive also confirm. hold sell from here in my opinion

LMWR/USD | Stock Quote | Chart & Forecast SummaryKey Indicators On Trade Set Up In General
1. Push Set Up
2. Range Set up
3. Break & Retest Set Up
Notes On Session
# LMWR/USD | Stock Quote
- Double Formation
* 012345 | Completed Survey | Subdivision 1
* (Neckline) | Configuration At 0.20700 USD
- Triple Formation
* ((Pennant Structure)) | Uptrend Bias | Subdivision 2
* Retracement Numbered | Share Out Condition | Subdivision 3
* Daily Time Frame | Trend Settings Perspective
Active Sessions On Relevant Range & Elemented Probabilities;
European Session(Upwards) - US-Session(Downwards) - Asian Session(Ranging)
Conclusion | Trade Plan Execution & Risk Management On Demand;
Overall Consensus | Buy

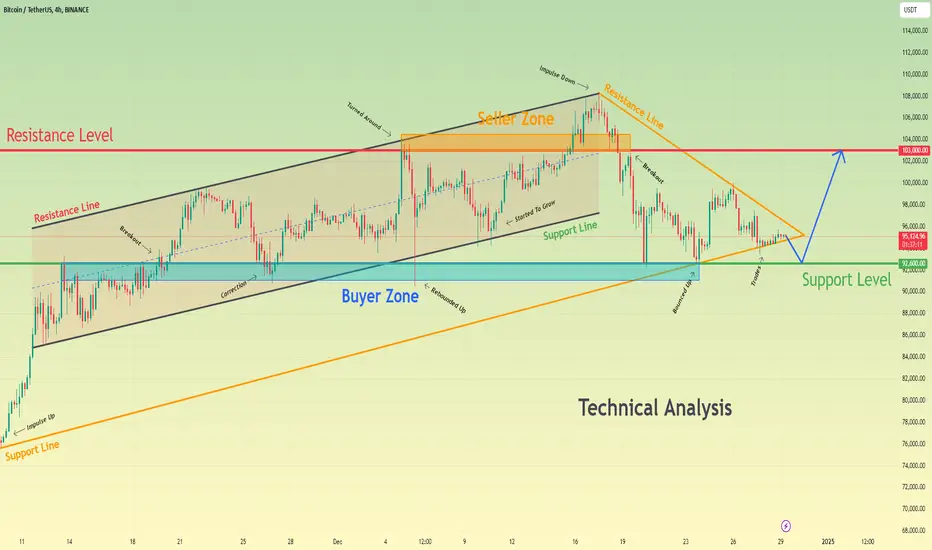
Bitcoin can exit from pennant and then start to grow to 103KHello traders, I want share with you my opinion about Bitcoin. Looking at the chart, we can see how the price started to trades inside the pennant, where it rebounded from the support line and rose almost to the support level, which coincided with the buyer zone. In the pennant pattern, BTC started to grow inside the upward channel, where it broke the 92600 level and then rose to the channel's resistance line, after which made a correction. Next, the price continued to grow and later rose to the resistance level, which coincided with the seller zone and then made a correction movement to the buyer zone. After this, the price continued to move up inside the channel, where it soon reached the 103000 resistance level and broke it. Next, BTC reached the channel's resistance line, which coincided with the resistance line of the pennant, and made a strong impulse down to the support line of the pennant, exiting from the channel and breaking the resistance level. After this movement, the price turned around and started to grow near the support line of the pennant and now I think that BTC can exit from the pennant and fall to the support level. Then it will turn around and start to grow to a 103000 resistance level, which is my TP. Please share this idea with your friends and click Boost 🚀
GOLD - Price can correct to support line and then bounce upHi guys, this is my overview for XAUUSD, feel free to check it and write your feedback in comments👊
A few days ago price entered to triangle, where it at once broke $2700 level and then fell to support line of this pattern.
Also, Gold broke $2595 level, but some time later it turned around from support line and soon broke $2595 level again.
Later Gold rose to resistance zone, after which made correction and then reached support line of triangle.
Then price made upward impulse, thereby exiting from triangle and breaking $2700 level, and started to trades in pennant.
In this pattern, price broke $2700 level one more time and declined to support level, after which rose to resistance line.
In my mind, Gold can fall to support line and then bounce up to $2660, exiting from pennant.
If this post is useful to you, you can support me with like/boost and advice in comments❤️

Ethereum Bullish Penant Reforming... Price Target 10-18kMacro log perspective on ETHUSD shows a massive bull pennant forming since April 20, 2017
Pole height: ~$400
Breakout around ~$350 (conservative)
Price target: $750
Major support: $300
Data From ptk921
Real Height: $1400
History is repating itself
Macro log perspective on ETHUSD shows a massive bull pennant forming since November 30, 2021
Pole height: ~$4800
Breakout around ~$3750 (conservative)
Price target: $10-18k
Major support: $3000
Realistic Height: $14000
The Fib Retracement Illustrates this perfectly.
Solid R:R Here

MV/USD | Stock Quote | Chart & Forecast SummaryKey Indicators On Trade Set Up In General
1. Push Set Up
2. Range Set up
3. Break & Retest Set Up
Notes On Session
# MV/USD | Stock Quote
- Double Formation
* 0.00950 USD | Completed Survey & Entry Settings
* Pennant Structure | 012345 & Wave Count | Subdivision 1
- Triple Formation
* Numbered Retracement | Uptrend Bias | Subdivision 2
* 012345 | Wave Entry | 0.01800 USD | Subdivision 3
* Daily Time Frame | Trend Settings Condition
Active Sessions On Relevant Range & Elemented Probabilities;
European Session(Upwards) - US-Session(Downwards) - Asian Session(Ranging)
Conclusion | Trade Plan Execution & Risk Management On Demand;
Overall Consensus | Buy

30minutes | Bitcoin | Analysis | 25/12/2024Asalam.o.alaikum (Hi) Community,
Merry Chirstmas to you!
Hope you are fine and doing all of your great, so about yesterday analysis, we have seen exactly formations of IFC's and fulfilling all the demand that was conflicted in previous days. So for today we can see the recovery of unconditional bull move as following:
Bullish
Yesterday, we measured the very fast bull move, it seems like bull wants to gain the profit as soon as possible (quickly). But remember bull move speed is not fast as we are seeing, bull speed always remains slow as compared to bearish one. So, If market breaks the Volume Charging Triangle upside without any retest, the formation of huge IFC's will continues happening and we can see the rejection/reversal upon the mentioned upside area.
Bearish
If talk about the confirmation, we have many evidence for bearish move. Like in Weekly time frame there is proper sell indication as bull investor interest lies upon maximum bottom price area. Similarly, in Daily timeframe market is facing the supply, as well as in 30mins. But remember we are at the central area of the market so it's quite unfair area for the entry.
So we have these key levels. Let measure the upcoming move.
Cheers,
Thanks!
Intikhab Gillani MOCHH
Analyst (Ultra Securities & Hedge Funds PvT Limited Pakistan)
25/12/2024

GOLD - Price can correct to support line and then bounce upHi guys, this is my overview for XAUUSD, feel free to check it and write your feedback in comments👊
Some time ago price made upward impulse and reached $2670 resistance level, which coincided with resistance zone.
Next, price broke this level, and entered to triangle, where it declined to $2605 support level, breaking $2670 level.
In triangle, price trades tried to back up, but failed and fell below support line, exiting from triangle pattern.
Then Gold in a short time rose to $2726 points, breaking resistance level, after which started to decline inside pennant.
Inside this pattern, price declined to $2583 points, breaking $2670 and $2605 levels, but recently broke $2605 level again.
I think that Gold can decline to support line and then bounce up to $2660, leaving pennant pattern.
If this post is useful to you, you can support me with like/boost and advice in comments❤️

TPLP Buy Trade PlanTPLP is trading in a bullish penant and has taken support on key fib levels. TPs are 15.45 and below 17

BTC USD bullish pennant inside a rising broadening wedgeBullish pennant forming for continuation inside a big rising broadening wedge
If successful this pennant could take bitcoin to 102k as first stop before a second consolidation.
Right now trading the pennant, not the broadening pattern, which is still forming but could reach a target around 111k

Bitcoin can leave pennant and then rise to resistance levelHello traders, I want share with you my opinion about Bitcoin. Looking at the chart, we can see how the price entered to upward channel, where it soon reached the 94500 support level and then broke it. Next, the price made a retest and then tried to grow more, but later turned around and made a correction below a support level, after which in a short time, it backed up. Then BTC some time traded near the support level and later rose to the seller zone, where it at once turned around and rebounded down until to 90500 points. But soon, BTC backed up to the channel and then started to grow to a 103000 resistance level. When it reached this level, the price broke it and soon reached the resistance line of the channel, then it exited and rose to 108300 points, after which turned around and made a downward impulse inside the downward pennant. In this pattern, the price broke 103000 with 94500 levels and reached the support line of the pennant, which is located inside the buyer zone. Then price bounced up from this area and a not long time ago fell back and then rose to the resistance line of the pennant. Now, the price continues to trades near this line and I expect that the price can little decline below the resistance line. Then it started to grow to 103000 resistance level, thereby exiting from the pennant. For this case, I set my TP at this level. Please share this idea with your friends and click Boost 🚀

$ETH to $6.45k USD - 2024's Crescendo CRYPTOCAP:ETH is showing strong signs of an impending breakout to the $6.4k–$8k range, backed by two key technical indicators:
Cup & Handle Formation: ETH has recently broken out of a textbook cup and handle pattern, confirming the breakout with a solid retest over this past week of VOL. This is a classic bullish signal pointing to higher targets.
Bull Pennant: Since the 2021 rally, ETH has been consolidating within a massive bull pennant. This long-term structure suggests Ethereum is coiled and ready for a significant move upward.
1.618 Fib: Also layering in a Fibonacci retrace, if ETH is indeed heading for ATHs and price discovery, the 1.618 FIB is a common level that traders are very familiar with. It just so happens to be right in the middle of our target box at ~$7k!
Momentum is building— we will need to keep an eye on volume and follow-through for confirmation.
To boot, bearish sentiment for ETH is near all time highs. I think it might be time for a most-hated rally. I have a short term allocation in AMEX:ETHT to ride this momentum, NFA DYOR

FlAGMCX fut made flag n pole pattern on daily/charts with negative OI suggesting short covering.
Risk:Reward = 1:2.5
Could b bought with mentioned stoploss & target.

$NATH to Play with Macro Tops & Bottoms, Falling to $70 by AprilNASDAQ:NATH
Nathan's Famous has completed an Elliott Wave Motive Phase, and now enters the Corrective Phase. With the stock having no existing stiff resistance level at ~91.25, the stock is going to return to it's comfort zone in the $70's.

1820 CE about to blastSunpharma 1820 CE is breaking out of falling wedge wih decent OI.
Risk:Reward = 1:3
Could b bought above 20 with mentioned stoploss & target.

NASDAQ - Trading Complex Pullbacks & Pennant PatternsThis video will teach you how to trade complex pullbacks.
Concepts include: how to properly read a trend, breakout patterns, structure recognition & different entry techniques.
From the fundamental side, we also examine how recent economic events, such as the FOMC Interest Rate decision, US government shutdown threats, and the Santa Clause Rally, have affected the markets.
I wish you all a safe & happy holiday season!
Akil

The last bullish chance of XRP in Mid term!The price has formed a bullish flag on the 4-H time frame, and if it breaks out, it can drive the price up to around $2.9 . This is expected to happen in the new year. I don't know why this coin reminds me of BNB!!!
Give me some energy !!
✨We spend hours finding potential opportunities and writing useful ideas, we would be happy if you support us.
Best regards CobraVanguard.💚
_ _ _ _ __ _ _ _ _ _ _ _ _ _ _ _ _ _ _ _ _ _ _ _ _ _ _ _ _ _ _ _
✅Thank you, and for more ideas, hit ❤️Like❤️ and 🌟Follow🌟!
⚠️Things can change...
The markets are always changing and even with all these signals, the market changes tend to be strong and fast!!

Inverse H&S still in Play with previous Similarities showing. GM & Afternoon Everyone! XRP 1h has been bouncing between the 2.17 & 2.19 supports. We may see XRP visit 2.59 then get rejected and find support around 2.47. Inverse H&S also still in play. We also are showing similarities between Nov 22 - 24 on the chart. I share what I see. Not financial advice. I do not have a crystal ball. Cheers & have a wonderful day!
Thanks,
-Higher_State

Inverse H&S still in Play with previous Similarities showing. GM & Good Afternoon Everyone! XRP 1h has been bouncing between the 2.17 & 2.19 supports. We may see XRP visit 2.59 then get rejected and find support around 2.47. Inverse H&S also still in play. We also are showing similarities between Nov 22 - 24 on the chart. I share what I see. Not financial advice. I do not have a crystal ball. Cheers & have a wonderful day!
Thanks,
-Higher_State

HelenP. I Gold can rise a little and then drop to $2590Hi folks today I'm prepared for you Gold analytics. Some days ago price made a gap and then reached the support level, which coincided with the support zone. Then XAU broke this level and continued to move up to the resistance level, which coincided with the resistance zone and soon broke it too. Next, the price rose to 2720 points and then made an impulse down, breaking the resistance level, after which tried to back up, but failed and some time traded below the 2665 level. Some time later, Gold reached the resistance level again and finally broke it one more time, after which rose to the trend line. Then the price turned around and started to decline inside a downward pennant, where it soon dropped to the resistance level and broke it again. Then Gold fell to the support zone, after which turned around and tried to grow but failed and dropped back to the support zone. Recently price finally started to grow and reached an even trend line, which continues to trades close. For this case, I expect that XAUUSD will make a small move up, higher than the trend line, and then start to decline. For this reason, I set my goal at a 2590 support level. If you like my analytics you may support me with your like/comment ❤️
