#XAGUSD(SILVER):Is Bull Run Over? Major Correction On the Way? Dear Traders,
Silver has experienced a significant decline since the DXY began to recover. The price is likely to continue falling and we believe this may be the commencement of a major decline. We anticipate a smooth drop based on previous price reactions.
**Potential Entry Zone:**
- Enter when the price reaches the FVG area marked with a white box. The initial take profit can be set at $45 and the swing trade at $40.
**Support:**
- We would appreciate your support by liking and commenting on our ideas which will encourage us to post more in the future.
Team Setupsfx
Pivot Points

#XAUUSD: +6000 Pips Swing Move In Making, Patience Pays!
Gold prices have fallen sharply as the DXY has regained strength. Following the recent significant sell-off, we can anticipate the potential direction of the price. Three key targets can be considered if the price moves in our favour. The first is a nearby target at $4000 which would represent a gain of 1100 pips. Subsequent targets should be determined according to your trading plan.
There are two potential entry points; if the first is invalidated the second should be considered.
We wish you the best of luck and trade safely.
Team Setupsfx 🚀❤️

EURUSD: Updated Support & Resistance Analysis 🇪🇺🇺🇸
Here is my latest structure analysis for EURUSD.
Resistance 1: 1.173 - 1.178 area
Resistance 2: 1.181 - 1.182 area
Resistance 3: 1.187 - 1.192 area
Support 1: 1.153 - 1.156 area
Support 2: 1.145 - 1.146 area
Support 3: 1.135 - 1.141 area
Consider these structures for pullback/breakout trading.
❤️Please, support my work with like, thank you!❤️
I am part of Trade Nation's Influencer program and receive a monthly fee for using their TradingView charts in my analysis.

ETH Analysis (4H)After the heavy dump on altcoins, the market is still quite volatile. However, after several days and weeks of ranging, it’s gradually returning to normal and becoming more predictable for analysis.
Ethereum has formed a reversal pattern at the bottom and has made three higher lows. It’s expected to move toward the red zone while holding the green area, and then get rejected toward lower levels.
The best area for a long buy is the green box, and the best area for a short sell is the red box.
Let’s wait and see what happens next.
For risk management, please don't forget stop loss and capital management
When we reach the first target, save some profit and then change the stop to entry
Comment if you have any questions
Thank You

ETHUSDTBINANCE:ETHUSDT have a amazing trend because this is second the best crypto an head of all project so is in watchlist of best traders.
Support for buy: 3750$
Resistance for targets: 4045 - 4200 - 4435 - 4755
Please your risk management.

The Downward Storyline , Monitoring ETH/USD Bias : 🔻 Bearish
Entry : $3,924 – $3,947 (Supply Zone)
Objective : $3,436 (Discount / Demand Zone)
R:R: ≈ 1:16 💰
Reasoning :
Price is reacting from a premium Supply Zone below Equilibrium, showing clear ChoCH + BOS confirmations. Expecting continuation toward the Weak Low / Discount zone as liquidity beneath the range is targeted.
Quote :
My aura attracts precision — I don’t chase trades, I align with momentum.

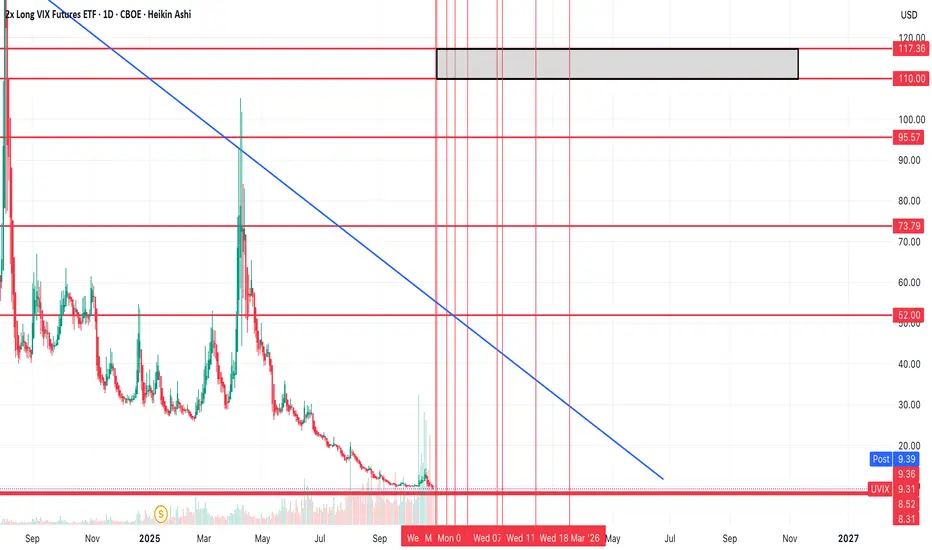
Almost time to bid for volatility? $UVIX over $100?I think we're getting really close to a large spike in volatility.
I think it's likely that vol will continue to fall into next week (and potentially a big longer into November), and if we can get down to the $8-$8.50 region, that there's strong support there and that could trigger a reversal.
SPY is almost to my upper levels of $709-716, and if we can see a push up there and a drop down to the support levels in UVIX that should trigger a reversal on both charts.
I do think the spike in volatility will be strong.
The most probable levels on the chart for a spike to find resistance in is $110-117, which would be a spike of 1100%-1200% or so if you were to catch the move entirely, and of course if the idea plays out.
I've also marked other resistance levels, should we get a smaller spike.
Could be the best trade of the year if it comes to fruition. Going to be watching the chart over the next week or so and will likely bid those levels with some calls for a trade.
Momentum Cooling Off, Eyes on $3,700 Support ZoneETHUSD – Daily Chart | Momentum Cooling, Consolidation at Key Support
Market Context:
Ethereum’s daily chart continues to show a controlled consolidation after the strong rally earlier this quarter.
Price action remains confined between the $3,700–$3,850 support zone and $4,350–$4,450 resistance.
While sentiment across crypto remains moderately positive, short-term indicators suggest fading momentum and compression rather than a confirmed breakout.
________________________________________
Trend Structure:
The broader trend remains constructive, but recent daily candles have formed lower highs — suggesting a mild corrective bias.
As long as ETH holds above $3,700, the long-term structure stays intact; a break below would open the door for a deeper pullback toward $3,400–$3,600.
A decisive close above $4,450 would confirm renewed momentum and likely invite trend-following participation.
________________________________________
Moving Averages:
The 20-day EMA is flattening and currently near price — acting as short-term resistance.
The 50-day EMA sits slightly above, showing the market is still in a pause within its bullish structure.
The 100- and 200-day EMAs remain well below current levels, confirming the long-term trend remains intact.
________________________________________
Momentum Indicators:
RSI (14): hovering around 45–48, reflecting neutral-to-slightly-bearish momentum. A reclaim above 55 would indicate buyers returning.
MACD: histogram narrowing, signal lines converging — momentum cooling but not yet reversing.
Stochastic RSI: mid-range, curling upward — early sign of potential energy buildup.
ADX (14): around 20–25, suggesting weak trend strength; look for ADX rising above 25 for confirmation of direction.
ATR: contracting steadily — volatility compression often precedes expansion.
________________________________________
Key Levels:
Resistance: 4,350–4,450 — multi-touch supply zone.
Next Resistance: 4,600–5,000 — major breakout region if momentum builds.
Support: 3,700–3,850 — critical daily support, repeatedly defended.
Secondary Support: 3,400–3,600 — previous accumulation area.
________________________________________
Indicator Summary:
RSI & Stoch RSI → Neutral; momentum reset after an overbought phase.
MACD → Flattening; no strong divergence, just cooling momentum.
ADX → Low; confirming a sideways, non-trending environment.
EMAs → Flat; short-term equilibrium within a long-term bullish trend.
Volume → Gradually declining on dips, suggesting no panic selling.
________________________________________
Outlook:
Ethereum’s daily chart reflects a classic consolidation within an ongoing uptrend.
Until price closes firmly beyond either $4,450 or $3,700, traders should expect range-bound action and momentum-reset conditions.
The next significant move is likely to align with an RSI breakout above 55 , MACD expansion , and a rising ADX above 25 — all signaling renewed directional strength.
________________________________________
Summary:
ETH remains structurally bullish on higher timeframes, but short-term momentum has cooled.
Volatility compression, neutral oscillators, and flattening EMAs define a market gathering energy for its next impulsive phase.
As long as $3,700 holds, the broader outlook stays constructive — this is the “calm before expansion”.

GOLD on the RISE!XAUUSD moved as we analyzed. Now waiting for BreakOut from RESISTANCE to see if it will retesting and continue flying UP todsy or when markets reopen next week.

DXYDaily structure pointing to an easing of price action in the near term. 5 bar fractals providing the extremes of the range. The bullish Cypher is obviously incomplete and a guess. But the bottom of the range and the shift in sentiment needs to be revisited before any upside. The Cypher would give us the wyckoff spring and upside taking out highs on the way to 💯.

EUR/USD Hints At Swing LowA small doji formed on Wednesday, snapping a three-day losing streak for EUR/USD. The session low respected the 100-day EMA as support, while the brief dip below the monthly S1 pivot proved to be a false break.
The bias remains bullish while prices hold above the 1.1544 swing low. Bulls could look to buy dips towards the monthly S1 pivot in anticipation of a move up towards the 1.17 handle and monthly pivot point (1.1754).
Matt Simpson, Market Analyst at City Index and Forex.com

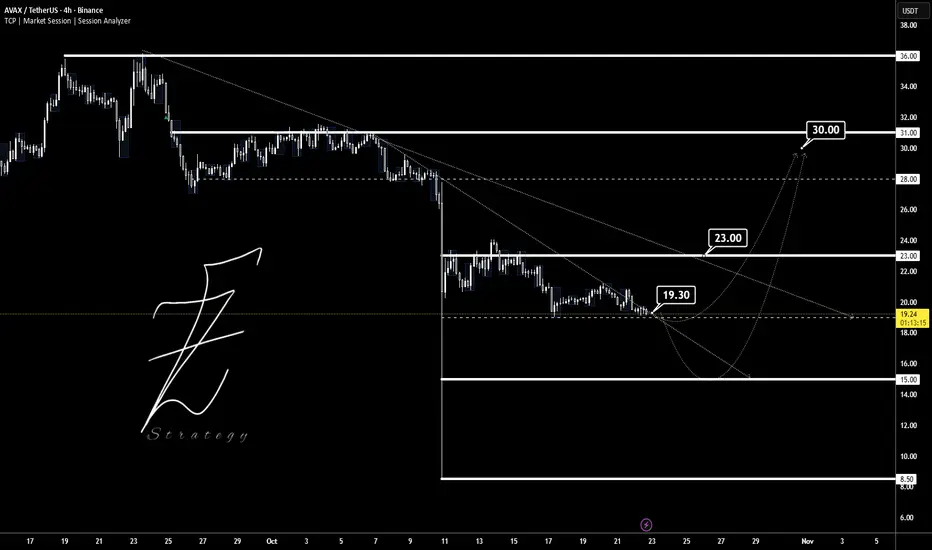
AVAXUSDTThis chart is The try that breakout trendline to way in 30$ target.
Supports: 19 - 15 -8.5
Resistance: 23 - 30 - 36
⚠️ Please control money management.
BINANCE:AVAXUSDT
Oklo slides to the downside - Watch for the next levels In this video I cover the next important levels for Oklo during what I perseve as being the start
of a correction after pushing up some 900% over the past 5 months .
Tools used Fibs, Pivots, TPO chart and Volume Profile

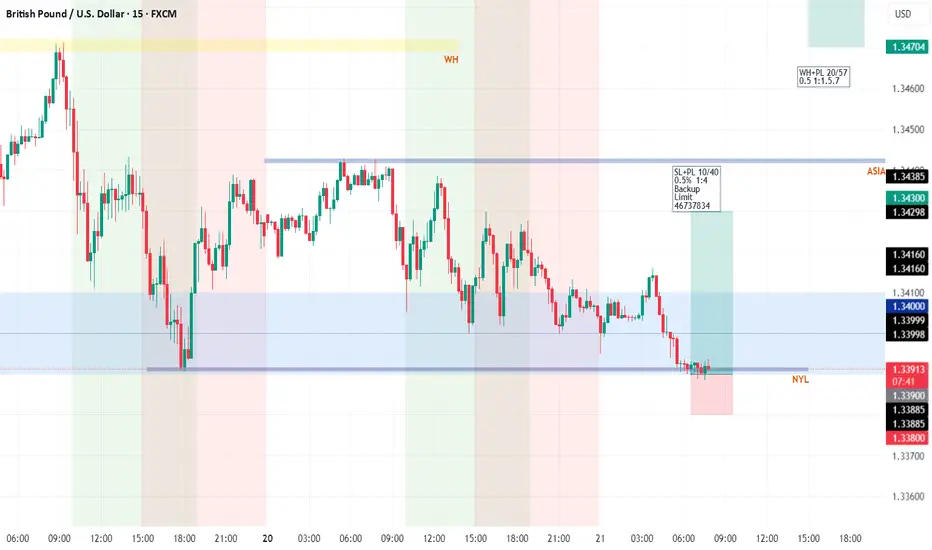
$btc long setup 15MIN London session swept the Asia low — classic liquidity grab before reversing.
That’s your manipulation candle — a clear sign institutions are hunting stops below key Asian levels.
📉 Market Structure & Alligator Signal
Alligator lines are beginning to curl up — jaws, teeth, and lips are turning.
Price is currently forming support above the Alligator, signaling a possible awakening after consolidation.
We’re trading above the Alligator — that’s your cue for potential long momentum.
🎯 Entry Setup – Long Scenario
Entry Zone: Around 108,000 – 107,950 (just above Alligator & recent support)
Stop Loss: Below today’s low / Alligator lips — roughly 107,750-107,800
Take Profit 1: 108,500 (liquidity above London high)
Take Profit 2: 108,800–109,000 (previous resistance & HTF level)
✅ Confirmation Needed:
Wait for a bullish candle close above Alligator with volume.
No new low below 107,785 — that’s your invalidation.
Final Thought:
London took the Asia low — now we ride the reversal if support holds. Alligator turning = trend awakening. Don’t chase — wait for the pullback into support.
Let’s see if the bulls wake up 🚀
— original_capital33 | TradingView
👉 Like & Follow if this adds value. Not financial advice.

Gold Volatility Surges Above $4000Gold's selloff on Tuesday was its fifth most bearish day's trade since 1970 - according to spot prices from LSEG. Clearly this is a significant event, especially when we consider it occurred at its record high. Let's take a closer look at technical levels.
Matt Simpson, Market Analyst at City Index and Forex.com.

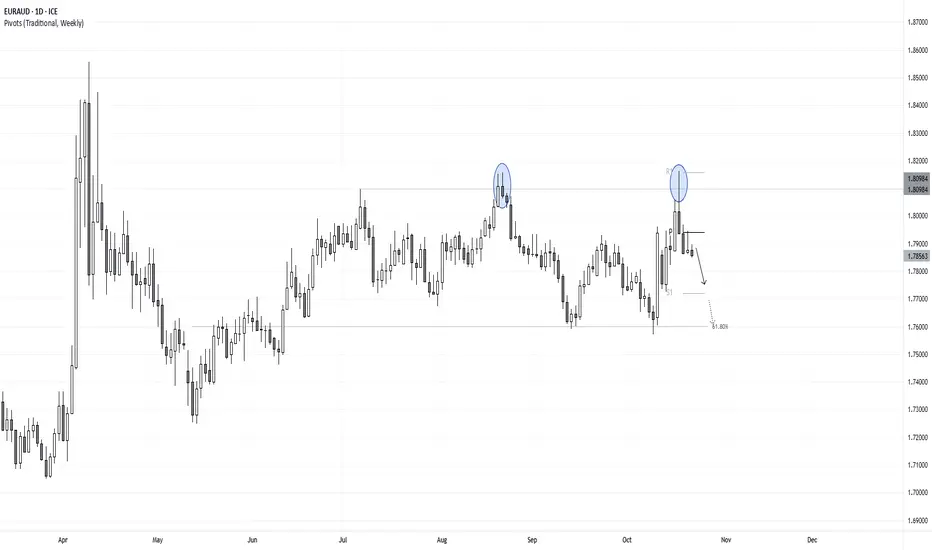
EUR/AUD Bears Regain Control After False BreakFriday’s bearish hammer marked the second failed attempt for EUR/AUD to break out of its 550-pip range. Momentum has since turned lower, with prices continuing to respect the weekly pivot point as resistance.
Notably, the previous failed breakout also led to a move back toward the lower end of the range, suggesting a similar pattern could unfold.
For now, bears may target the weekly S1 pivot near the 1.77 handle, with a break below it bringing the range lows into focus.
Matt Simpson, Market Analyst at City Index and Forex.com
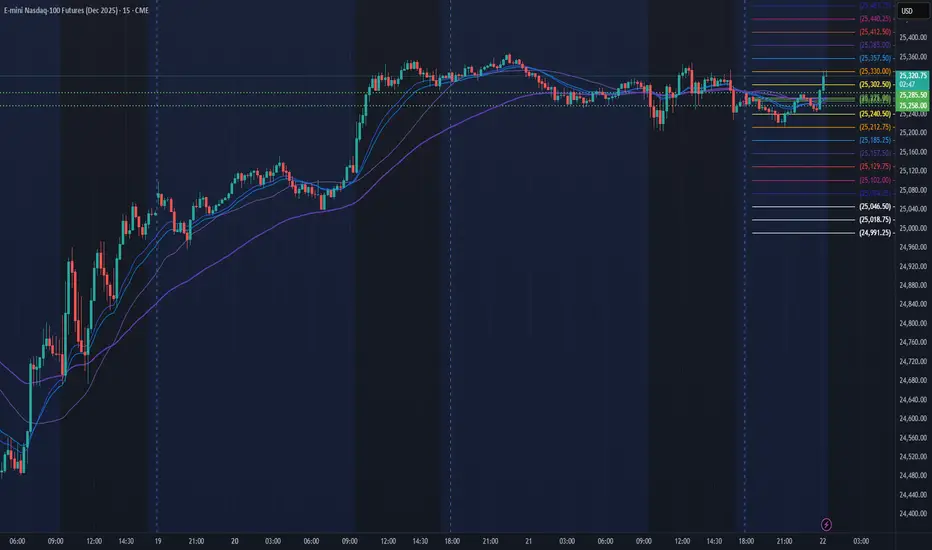
NQ Power Range Report with FIB Ext - 10/22/2025 SessionCME_MINI:NQZ2025
- PR High: 25285.50
- PR Low: 25257.75
- NZ Spread: 62.25
No key scheduled economic events
Quick dip and rotation back towards ATH
Session Open Stats (As of 12:15 AM)
- Session Open ATR: 385.15
- Volume: 24K
- Open Int: 290K
- Trend Grade: Long
- From BA ATH: -0.2% (Rounded)
Key Levels (Rounded - Think of these as ranges)
- Long: 26020
- Mid: 23571
- Short: 21939
Keep in mind this is not speculation or a prediction. Only a report of the Power Range with Fib extensions for target hunting. Do your DD! You determine your risk tolerance. You are fully capable of making your own decisions.
BA: Back Adjusted
BuZ/BeZ: Bull Zone / Bear Zone
NZ: Neutral Zone
US100 (NDQ): Trend in daily time frameThe color levels are very accurate levels of support and resistance in different time frames, and we have to wait for their reaction in these areas.
So, Please pay special attention to the very accurate trends, colored levels,
and you must know that SETUP is very sensitive.
Be careful
BEST
MT

AVNTUSDT: trend in 30-Min time frames(((((((((This coin is very risky but investing in the specified area is good))))))
The color levels are very accurate levels of support and resistance in different time frames, and we have to wait for their reaction in these areas.
So, Please pay special attention to the very accurate trend, colored levels, and you must know that SETUP is very sensitive.
Be careful
BEST
MT

Has Life Sprung Back in ALTS?Quick ETH Trade Update — Market Showing Signs Of Life
Just a short update for everyone who’s been following my ETH long position — I’m still in, and we’re finally seeing some movement! There’s been a bit of news that brought life back into the market, especially across altcoins, and I wanted to share my quick thoughts on what this means.
I’ll also cover what I’m watching next, my invalidation levels, and what would make me either hold or scale out of the trade.
Stay patient, stay focused — the move could just be starting.
#Ethereum #ETH #Altcoins #CryptoMarket #CryptoTrading #Bitcoin #ICTStrategy

Buy DAX 4H on tradeback in bull movementBuying with the trend below previous low of close. Fundameltally Buying bull move on retracement with Risk Reward 1:4.
will move stop to break even if 100 pts of profit is reached.

Gold Bearish Bias for the Day📅 Tuesday, Oct 21, 2025
🕓 4H Timeframe
1️⃣ Market Context
After a strong impulsive bullish run, GOLD is currently consolidating near a heavy supply zone ($4340–$4370).
Price has failed to make a new higher high and is now showing early signs of exhaustion — potential short-term distribution in progress.
2️⃣ Bias: Bearish (Intraday/Short-Term)
Expecting a retracement or corrective leg back into the previous demand zone ($4200–$4230).
This could form a clean short-term sell opportunity before the next major bullish continuation resumes.
3️⃣ Trade Plan
Entry Zone: 4340–4360 (Short/Sell entries from premium supply zone)
Stop Loss: Above 4375 (above previous swing high / invalidation)
Targets:
TP1 → 4290
TP2 → 4250
TP3 → 4205 (final demand zone retest)
RRR: 1:3+ potential depending on entry precision
4️⃣ Confirmation Triggers
✅ Bearish engulfing or rejection wick from supply zone
✅ BOS (Break of short-term structure) on lower TF (1H/15M)
✅ Volume drop on retest = ideal entry signal
5️⃣ Intraday Summary
If GOLD holds below 4360 — bias stays bearish.
Only a clean 4H close above 4375 will flip structure bullish again.
Until then, focus on shorting premium areas toward discount levels below $4250.
💬 Conclusion:
"Sell the premium, buy the discount" — today GOLD looks ripe for a controlled bearish correction before the next leg up. Stay patient, wait for confirmation, and don’t chase longs inside supply.
