XAUUSD in new rangeAs i thought yesterday it would break the hourly top, but the current downtrend is taking too long for a retest, unless its a retest of some higher timeframe like daily or weekly which i do not know.
So i m waiting for clear signs of reversal in M15/30 to pick up at the pink zone. If reversal is at a higher price, but you see clear pattern and higher high higher low, take the entry at the last lower high of the downtrending momentum from before.
Be careful around 2.30 USD News. Gmt+2
Range

HelenP. I Gold can rebound down from top part of range to $2330Hi folks today I'm prepared for you Gold analytics. Some days ago price started to decline from the trend line and in a short time declined to the resistance level, after which broke this level and continued to fall. Later, Gold fell to the support level, which coincided with the support zone, and started to trades inside consolidation, where it at once started to grow. But soon, the price turned around and made a correction movement to the support zone, after which tried to grow but failed and fell back. Then XAUUSD repeated this movement and later rebounded up from the support zone to the trend line inside consolidation, and soon broke the trend line as well. After this movement, the price reached the top part of the range and started to decline, therefore I expect that GOLD will reach the trend line, then rebound up to the top part of the consolidation, after which starts to decline to the support level, breaking the trend line. That's why my goal is a 2330 support level. If you like my analytics you may support me with your like/comment ❤️

MATIC - Clean and Clear ❗️Hello TradingView Family / Fellow Traders,
On Weekly: Left Chart
MATIC has been hovering within a big range in the shape of a flat rising channel marked in blue.
Currently, MATIC is approaching the lower bound of the range, so we will be looking for buy setups on lower timeframes.
On Daily: Right Chart
📈 For the bulls to take over, we need a momentum candle close below above the last major high highlighted in gray.
📉 Meanwhile, MATIC would be bearish short-term and can still trade lower inside the weekly support.
📚 Always follow your trading plan regarding entry, risk management, and trade management.
Good luck!
All Strategies Are Good; If Managed Properly!
~Richard Nasr

The level defense patternI use the concept of a level being defended by either a buyer or a seller to find potential buying or selling opportunities. This is a specific pattern that can be identified on a chart. Let's consider one variant of this pattern. In this variant, the defense of a level by a buyer looks as follows: a buyer's candle closes above the level. Then, a seller's candle or candles interact with the level, followed by the appearance of a buyer's candle, which needs to be evaluated. If it meets the criteria, entry points can be identified.
Let's look at a concrete example. The pattern developed over 10 hours.
On the chart, blue-shaded areas represent 2-hour buyer's candles, and red-shaded areas represent 2-hour seller's candles. After the buyer pushed the price back above the 6.733 level, they attempted to resume from the 6.7571 level, the volume of the buyer's candle (632K) was less than that of the seller's candle (1.274M).
Then, the seller attacked the 6.733 level with increased volume (709K) but could not push the price below this level. Note where POC of the volume profile for the 2-hour seller's attack candle is: below 6.7571. The high of the attack candle is at 6.8166.
The next buyer's candle had increased volume (792K). Notice where the buyer's movement started in this candle: from the POC of the volume profile of the seller's attack candle.
Now entry points can be identified. In this example, the entry points are visible on the 1-minute time frame. The chart shows two entry points. Note how volumes are distributed at these points and the resulting buyer's zones (blue rectangles on the chart).
The first entry point is the defense of the breakout from the range by the buyer, which was formed in the previous 2-hour candle (RPL on the chart, 6.7784).
The second entry point is the defense of the high of the attacking 2-hour seller's candle by the buyer (6.8166 level).

Gold can rebound down from resistance line to 2280 support levelHello traders, I want share with you my opinion about Gold. Looking at the chart, we can see how the price reached the resistance line and then made an upward impulse to the 2280 support level, which coincided with the support area and soon broke this level as well. Then price made a retest and started to trades inside the range, where firstly it rose to the resistance level, which coincided with the seller zone, but at once turned around and fell to the support level. After this, Gold rebounded from the support level, which coincided with the resistance line and bottom part of the range and started to grow. In a short time, the price reached the 2410 level, breaking it, thereby exiting from the range also and even rose higher than the seller zone, but soon turned around and fell to the resistance line, making a fake breakout of the 2410 level. Soon, Gold broke the resistance line and at the moment continues to trades near this line. So, I think that XAU can rise to the resistance line and then rebound down to the support level, therefore I set my target at the 2280 level. Please share this idea with your friends and click Boost 🚀

Trading opportunity. What to buy?In the crypto market, the largest assets are currently experiencing similar situations.
On the charts, we can see that six assets have formed sideways trends. Prices for all six assets are currently at the bottom of these sideways trends. For four assets, the price temporarily dropped below the lower boundary of the sideways trend, where liquidity from sellers was collected, but then returned to the sideways trend. The prices of five assets, excluding BNB, are in zones where it makes sense to consider buying. The most interesting potential is with DOGE and AVAX.
One possible strategy to consider is buying four assets that you like the most.

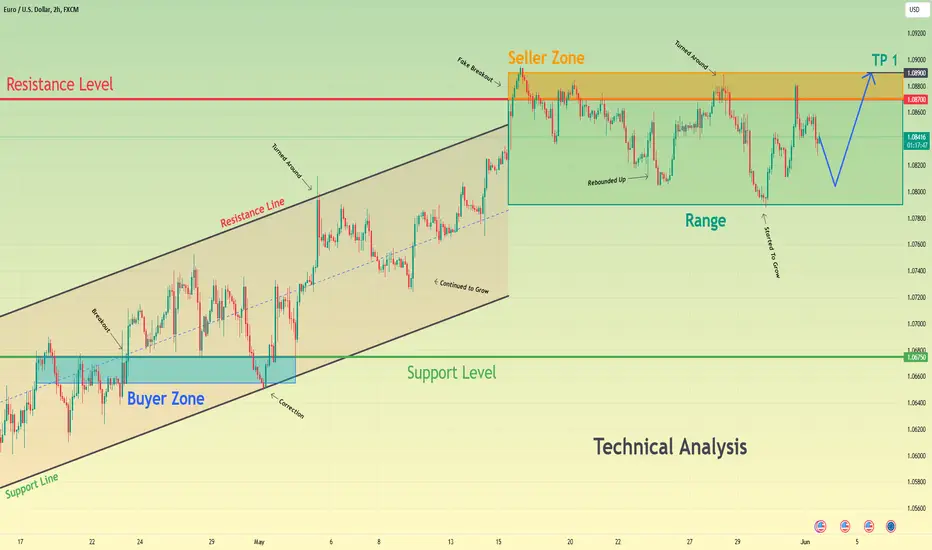
Euro can fall to bottom part of range and then bounce upHello traders, I want share with you my opinion about Euro. By observing the chart, we can see that the price entered an upward channel, where it soon reached the support level, which coincided with the buyer zone and broke it. After this, EUR a little rose, after which made a correction movement to the support line of the channel and then in a short time rose to the resistance line of the channel. Then the price turned around, a little declined, after which continued to move up inside an upward channel. Later price exited from this channel, and even entered to seller zone, but soon turned around and started to trades in the range, making a fake breakout of 1.0870 resistance level. Inside the range, the price fell almost to the bottom part, after which rose back to the seller zone, but at once turned around and fell again. After which, EUR started to grow and in a short time rose to a resistance level and a not long time ago turned around and started to decline. Now I think the price can decline to almost the bottom part of the range and then rebound up to the seller zone. For this reason, I set my target at 1.0890 points, which is located in the seller zone. Please share this idea with your friends and click Boost 🚀
BNBUSDT. Trading opportunityOn the daily timeframe, the price has formed a sideways movement and reached the mandatory target of the seller's vector 7-8. The next relevant buyer's vector 8-9 has a potential target of $634. The price is currently in the middle of the sideways range on the daily timeframe.
On the hourly timeframe, the price has also formed a sideways movement. The short seller's vector 11-12 broke below the lower boundary of the sideways range at $574 and collected sellers' liquidity. Pay attention to the key volume of the last vector 11-12: the candle with the highest volume in the vector is at the bottom (marked as 'KC' on the chart). Then the buyer absorbed this volume and returned the price to the sideways range, forming a new buyer zone at the boundary of the sideways range (the blue rectangle on the chart, upper boundary at $575.5). The key volume (largest) in the emerging buyer's vector is also at the bottom (the candle on the chart is marked as 'tKC'). This setup increases the probability of realizing the buyer's vector 12-13 with a potential target on the hourly timeframe of $600.
Idea: Look for purchases as the realization of the buyer's vector 12-13 on the hourly timeframe and the buyer's vector 8-9 on the daily timeframe. The target on the hourly timeframe is $600.
The preferred option is to look for purchases from the defense by the buyer of the buyer zone at the lower boundary of the sideways range.

TONUSDT. Trading opportunityOn the daily timeframe, the price formed a sideways movement and hit the mandatory target of the buyer's vector 4-5 (7.2755 was reached). Currently, the price is in a seller's context. The next relevant seller's vector 5-6 has a potential target of 5.18. Yesterday, the seller showed a weak reaction on the daily timeframe (spread, volume, and the tail of the bearish candle), and the tail of this candle tested the volume key candle (on the "rKC" chart) of the buyer's vector 4-5, from which a strong buyer reaction started on the hourly timeframe: 3 buyer candles with good spread from the level of 6.5615.
On the hourly timeframe, the price also formed a sideways movement. The bearish seller's vector 9-10 reached the mandatory target. The next relevant buyer's vector 10-11 has a potential target of 7.2232. A liquidity pool of sellers formed below points 4 and 10 of the sideways movement, at 6.5615.
A weak seller on the daily timeframe may overcome a strong buyer on the hourly timeframe. Sales may be considered:
Option 1: Implementation idea of the seller's vector 5-6 on the daily timeframe: if the price breaks the lower boundary of the sideways movement on the hourly timeframe (6.5615) and defends this breakout. An ambitious potential target is 5.18.
Option 2: Implementation idea of the seller's vector 11-12 on the hourly timeframe. After the implementation of the buyer's vector 10-11 and the defense by the seller of the level 7.2232. The potential target is the opposite boundary of the sideways movement.
Buy entries can also be sought from the implementation idea of the buyer's vector 10-11 on the hourly timeframe.
Option 1: The most interesting option. If the buyer gathers liquidity from the seller below 6.5615, returns the price to the sideways movement on the hourly timeframe, and defends the level 6.5615. Possible targets are 7.2232, 7.45, and 7.675.
Option 2: Upon the defense by the buyer of the level 6.8125, a buying opportunity can be sought. Possible targets are 7.2232, 7.45, and 7.675.

Gold & ETH - Who Follows Whom?Hello TradingView Family / Fellow Traders. This is Richard, also known as theSignalyst.
I always keep an eye on Gold to gauge the overall market sentiment.
📚 I found the latest correlation between Gold and ETH interesting !
You know what? I will keep this post short, as the picture is self-explanatory !
The question is... Who follows whom?
📚 Always follow your trading plan regarding entry, risk management, and trade management.
Good luck!
All Strategies Are Good; If Managed Properly!
~Rich

1000SATS1000SATS is trading in range bound with 25% range.
some time ranges are the best things to play just buy the support and sell the resistance.
as this one is 25% range which can deliver fine risk to reward.
currently the price is at resistance level and being rejected due to selling pressure.
will the pair head back to support area ?
what you guys think of this idea ?

AUDUSD. Medium-term and short-term forecastHello traders and investors!
I'll share the forecast I made in mid-March.
On the weekly chart, there's a sideways movement, with a bullish vector 5-6 targeting 0.69205.
On the daily chart, we also see a sideways movement, with a bullish vector 7-8 targeting 0.66345, 0.66676.
I'm awaiting price interaction with the daily targets to update the forecast.
For a more detailed explanation of how to read charts and consider different timeframes when looking for trades, you can refer to the article

📉Think Outside the Box BTC!📈BINANCE:BTCUSDT
COINBASE:BTCUSD
Hello Dear Traders.
🔴The market has reached the end of its suffering range and our team's holiday break is nearing its end.
⚡️ In this post I will track the BTCUSDT movements as long as it stays inside the Box.
🔴The past few weeks, the pressure of market volatility was very high and we needed a break.
We will review the market again from today.
Please share the analysis posts to support and give us energy.

ETHUSDT. Trading opportunityOn the daily timeframe, the price has been in a range since February 24. The buyer's vector 8-9 reached its obligatory target. The price is now in the seller's contextual zone. On May 23, the seller attempted to start their vector 9-10 with a potential target of 3301, but the buyer absorbed this attempt. The buyer's candle on May 23 has the highest volume in the entire vector 8-9, but the result is only in the wick. The price was unable to close the day above the previous wicks.
Purchases can be sought based on the idea of reaching 4093. Sales can be considered based on the idea of the buyer's weakness (May 23 candle).
Let's examine the lower timeframes to understand where purchases or sales can be found. The situation is clearly visible on the 2-hour timeframe. The price is in a range. The seller's vector 5-6 reached its obligatory target and the buyer's vector 6-7 started to develop with a potential target of 3901. The last two seller candles in vector 5-6 have increasing volume, while the two buyer candles in the beginning vector 6-7 have decreasing volume, suggesting that the buyer is not present yet and someone might be buying from the 50% tail of the candle using the IST (Smart Money) concept.
For purchases, it would be beneficial if the seller on outstanding volume pushed the price below 3626, and the buyer absorbed this attempt and brought the price back above 3626. Of course, this might not happen, and the price could reach 3901.
Sales can be sought from the seller's defense of 3901 or 3949. Below 3498 (the lower boundary of the range), sales can also be considered, but it is important to remember that 3301 may halt the seller, as this is where the buyer's zone on the daily timeframe begins (blue rectangle on the chart).

Euro can rebound up to 1.0900 points, exiting from pennantHello traders, I want share with you my opinion about Euro. By observing the chart, we can see that some time ago price rebounded from the support level, which coincided with the buyer zone and declined to 1.0650 points. After this, the EUR turned around and started to trades inside an upward pennant, where it in a short time rebounded from the support line and rose to the 1.0725 level. Soon, the price broke this level and started to trades inside the range, where it at some time rose to the top part of the consolidation, but soon turned around and declined to support line of pennant. After this movement, the EUR made an impulse up to the current support level, which coincided with the support area, thereby exiting from the range. Also soon, the price broke this level and later reached the resistance line of the pennant, after which turned around and started to decline near this line to 1.0835 level. Now, it continues to trade near this level, so, in my opinion, the Euro can little decline and then rebound up, exiting from the pennant pattern. For this reason, I set my target at 1.0900 points. Please share this idea with your friends and click Boost 🚀

Bitcoin, after strong impulse up, can make correction to 67500Hello traders, I want share with you my opinion about Bitcoin. Looking at the chart, we can see how the price some time ago tried to rise, but failed and started to decline inside the downward channel, where it at once rebounded from the resistance line and fell to the 61100 support level, which coincided with the buyer zone. After this, the price made a fake breakout of this level and then tried to grow, but failed and declined to the buyer zone, where it some time traded. After this, the price broke the 61100 level again and in a short time rose to the resistance line of the downward channel. Soon, BTC broke this line, exiting from the channel, and later started trades inside the range, where it soon rose to the current support level, which coincided with the support zone. Bitcoin some time traded near this level, which also coincided with the top part of the range, and soon broke the 67500 level, exiting from the range and continuing to move up. But a not long time ago, the price turned around and started to fall. So, I think that Bitcoin can continue to decline to the support level, for this case, I set my target at this 67500 level. Please share this idea with your friends and click Boost 🚀

HelenP. I Bitcoin will correct to trend line and then rebound upHi folks today I'm prepared for you Bitcoin analytics. Some time ago, the price entered to consolidation, where it at once rebounded from support 2, which coincided with the support zone and rose to the top part of the range, but then BTC made a correction movement. After this, the price fell to the support zone, where it reached the trend line and started to move up between this line and soon broke support 2 again. In a short time later BTC exited from consolidation and continued to grow a higher trend line to the next support level, coinciding with one more support zone. When the price reached this level, for some time traded near, and later made a little correction movement, thereby breaking the trend line, but soon BTC turned around and made a strong impulse up. Price broke the trend line with support 1 too and then rose to 72000 points, but a not long time ago BTC turned around and started to fall. For this case, I expect that BTC will decline to the trend line and then turn around and start to grow again. That's why I set my goal at 72500 points. If you like my analytics you may support me with your like/comment ❤️

20/05/24 Weekly outlookLast weeks high: $67701.33
Last weeks low: $64227.62
Midpoint: $60753.92
We have lift off... maybe? Bitcoin has spent the last 2 months chopping between the low $70K's and high $50K's after a strong rally. However, it looks like strength has returned at least for now in BTC after the CPI print of Wednesday last week. This volatility influx moved BTC back above the 4H 200EMA which has been the all important level in determining the Mid - Low time frame trend. Now that price is back above I think the general sentiment would be to be more risk on, especially in terms of leverage than we've seen in the last few weeks. Not necessarily saying this is an ideal entry, just I think more confidence is returning to Bitcoin.
The altcoin market on the other hand with exception to a few top performers is lagging behind BTC, and that can be seen by the Bitcoin dominance at 56% currently and targeting local highs. For altcoins to begin reclaiming some of their loses we'd need BTC to get back above the '21 high of $69K.
Also, we have the ETH ETF approval deadline for VanEck and ArkInvest/ 21Shares on the 23rd &24th May respectively. Coinbase believes the odds of approval are closer to 30-40% so it would be a shock if these ETF's were approved by the SEC, however, if they were to be approved this could help kickstart the altcoin market again.
For this week it's about seeing if BTC can capitalise on last weeks progress and target the '21 ATH. The purple trendline needs to be respected on the way up otherwise I think we'll retest the MIDPOINT or even the 0.25 area.

ESM2024 gravitating towards ATH!Look at that beautiful 1/3 ADR at ATH + Previous Week High that is good confluence for us going higher! Also Range +4 STDV there this looks very solid to me! Range deviations + Average Range Levels = 🔥

New ATH after Range Shakeout ???Bitcoin (BTC) is exhibiting a bullish pattern that suggests a potential breakout to new all-time highs (ATH). The formation of a horizontal accumulation range and a recent bullish engulfing pattern indicate a strong possibility for significant upward price movement.
Horizontal Accumulation Range:
BTC has been trading within a defined horizontal range on the daily chart for an extended period. This consolidation phase suggests that supply and demand have reached an equilibrium, creating a potential launchpad for a breakout.
Bullish Engulfing Pattern:
Recently, BTC formed a bullish engulfing pattern, where a bullish candlestick completely engulfs the preceding bearish candlestick. This pattern is a strong reversal signal, indicating a potential shift in momentum to the upside.
Anticipated Breakout and ATH Target:
Based on the horizontal accumulation range and the bullish engulfing pattern, I anticipate a breakout from the range and a surge towards new ATHs. The initial target for the breakout is the previous ATH of around $73,000, with the potential to extend further towards $80,000 or even higher.
Potential Retest and Support:
While a bullish breakout seems imminent, a potential retest to the 62,000 support level could occur before the continuation of the uptrend. This retest, if it happens, would provide an opportunity for new buyers to enter the market and reinforce the bullish momentum.
Overall Bullish Outlook:
The combination of the horizontal accumulation range, the bullish engulfing pattern, and the overall market sentiment suggests a strong bullish outlook for BTC. While there may be short-term pullbacks, the longer-term trend appears to be favoring the bulls.

✅GBP_AUD WILL KEEP FALLING|SHORT🔥
✅GBP_AUD is trading in
A downtrend and the pair
Has formed a range pattern
So IF we see a bearish breakout
Then we will be expecting
A further move down
SHORT🔥
✅Like and subscribe to never miss a new idea!✅

HelenP. I Swiss Franc will rebound from trend line to $0.9150Hi folks today I'm prepared for you Swiss Franc analytics. A few days ago price made a correction movement, after which turned around and made an impulse up to the support level, which coincided with the support zone and soon broke this level. After this, CHF made a retest and started to trades inside consolidation, where it some time traded near the 0.9000 level and later rebounded up to the resistance level, which coincided with the top part of the range with the resistance zone. Then price some time traded near this level and later broke it, exiting from consolidation also, after which made a retest and even then continued to grow to the trend line. But when the price reached this line it in a short time declined to the support level, breaking the 0.9150 resistance level one more time. The Swiss Franc some time traded near this level and then rebounded up to the trend line and even broke it. Just now price trades near this line and I expect that the Swiss Franc will make retest, after the breakout, and then continue to grow to 0.9150 resistance level, therefore I set my goal at this level. If you like my analytics you may support me with your like/comment ❤️

A great opportunity on Livepeer (LPT)?Livepeer BINANCE:LPTUSDT seems to be giving us a great opportunity by retesting the top of its previous accumulation range. The Perfect Cloud (BPC) remains green, indicating that the uptrend is intact for the time being.
This retracement back to this very strong structural level is further reinforced by the Vegas Daily (blue cloud) of the Trend Identifier (BTI) !

Bitcoin can correct to mirror line and then rebound upHello traders, I want share with you my opinion about Bitcoin. Observing the chart, we can see that the price a not long time ago rebounded from the mirror line and made a strong upward impulse to the current support level, which coincided with the support level, thereby breaking the 60300 support level also. After this, the price started to trades inside the range, where it at once made a correction movement from the 65100 level to the mirror line, after which bounced up. But soon BTC fell to the 60300 level, breaking this line, and some time traded near the support level, after which rose back to the mirror line and broke it again. Then the price declined again, after which made a strong upward impulse, breaking the mirror line and 65100 support level, thereby exiting from the range as well. After this movement, BTC made a correction to the mirror line and then rebounded back and now it continues to grow. So, in my opinion, Bitcoin can repeat the correction move to the mirror line, and then continue to move up. For this case, I set my target at 68500 points. Please share this idea with your friends and click Boost 🚀
