RIVN is showing a pullback for a long entryRIVN on the 2H chart rose 67% to begin July as part of the larger EV sector rally
which included several other tickers including those from UK and China. It has
pulled back significantly since completing a double top on July 13th. Price is
now hovering over and supported by the mean VWAP line anchored to July 1st.
The two time frame RSI indicator shows both lower (blue line) ane higher time
frame ( black line) RSIs at 50 or higher with the blue line closer to that transition
zone. The zero-lag MACD shows the subtle cross under the histogram which
has changed from negative to positive. Overall, although the best entry is at
$20 from a very deep pullback, I believe that RIVN is now setup for a long trade
following a continuation or even a call option contracts trade. I will take a
position in call options at this time.
RIVN

Rivian 'Dead Cat Bounce' Over?I have been getting a lot of questions from followers about NASDAQ:RIVN in recent weeks. One of the favorites of the 2021 EV stock craze the share price has done not performed well since the IPO. This recent very bullish move has gotten a lot of attention but I think it has come to an end.
Price Action
Like most of my setups I am looking at RIVN hitting a major 50% Retracement this one being from the downtrend starting in September 2022 through April 2023. That Resistance at 26.71 was hit yesterday and today's price action shows reluctance to test and break it. I have been looking for a pullback to this bull trend to its own 50% Retracement at around ~20 and it may be upon us.
The Trade
Earnings are coming up on August 8th. That sets up a nice window for monthly options of the August 18th expiration. Since 20 is the approximate pullback level it also makes for a proper strike. That means Aug23 20 Puts will be the choice to express the trade. If price breaks the recent high I may look to cut them as they should maintain their premium with earnings getting closer. I also do not typically hold through earnings but rather try to close the day before to avoid the 50/50 probability of the binary event.
The Narrative
I still see the occasional Rivian on the road but as of late I have become a Tesla Maxi. Tesla had record production and delivery for Q2 2023 but every other EV manufacturer is struggling according to recent reports. The market as a whole has enjoyed an optimistic bull run since March and is due for a pullback.

PSNY a niche EV manufacturer penny stock LONGPSNY has seen a price rise of 30 % in the past month. This specialty EV manufacturer
does not compete with TSLA but only perhaps ARVL also based in the UK.
The 2H chart is quite healthy. Price broke out above the mean VWAP anchored to the beginning
of the year on July 3rd and is now approaching one standard deviation above that. The MTF
RSI shows both the one hour and daily RSIs crossed over 50 the same day. On the MACD
indicator the K and D lines crossed confluent with the horizontal zero line. Signs of bullish
momentum found, I will take a long trade targeting 25% of upside at $6.00 which is the double
top on January 31/ Feb 1 as well as three standard deviations above the mean aVWAP.

MULN trading the volatility LongOn the 30 minute chart, MULN has pulled back from a brief uptrend. I see things suitable for
an entry. I have added to the chart, the anchored VWAP lines serving as dynamic support and
resistance. The mean VWAP will be my designated stop loss while lines one and two
standard deviations above that are the first and second targets.
Overall, the long trade is projecting a ROI of 27% compared with the stop loss
of 11%. This trade could play out in only one day given MULN's volatility. The zero-lag
MACD shows a line cross impending and confluent with the zero horizontal line. The
relative volatility oscillator shows the magnitude of the shifts in that regard. From my
perspective, no matter the fundamentals of the financial health of MULN, the volatility
of the price action and technicals can be played long with high potential profit.

Long RIVNHonestly i think they are ugly but have seen 5 Rivns in my area the last few months. Pretty epic IHS pattern forming.... Been DCAing last 3 months...Adding here.

RIVIAN: Buy the next pull backRivian Automotive is on the 0.5 Fibonacci level, approaching the top of the 2 month Channel Up with the 1D technicals on solid bullish levels (RSI = 61.905, MACD = 0.260, ADX = 28.294). We will short on the first red 1D candle and target the 1D MA50, where we will open a buy again. The target will be R1 (TP = 17.75). The long term trend on RIVN remains bearish though, we want to see a steady close above the 1D MA200 to buy this for the long term. Noticeably the RSI has been on a Bullish Divergence since the start of the year.
## If you like our free content follow our profile to get more daily ideas. ##
## Comments and likes are greatly appreciated. ##

Battle of the New EV NASDAQ ComponentsLucid and Rivian, both new components of the NASDAQ:NDX , have been showing up on the High-Volume Institutional Activity recently.
NASDAQ:LCID has the beginnings of a bottom attempt developing with a Dark Pool buy zone emerging, but it's been slow-going for this EV company. Professional short-term trading is evident in the current run up, as it is in other EV companies this week, spurred by the bankruptcy of Lordstown Motors, many would say.
NASDAQ:RIVN has a clearer Dark Pool buy zone developing at this bottoming level with the same Pro Trader footprint in the current run up. This type of bottom formation provides a sturdier support level--evidence of more conviction from the institutions?
Both stocks have a lot of work to do to complete their bottoms for more than short-term trading at this time. Resistance AND competition are heavy ahead, as it's still early days in the race to dominance in EV Auto Manufacturing.

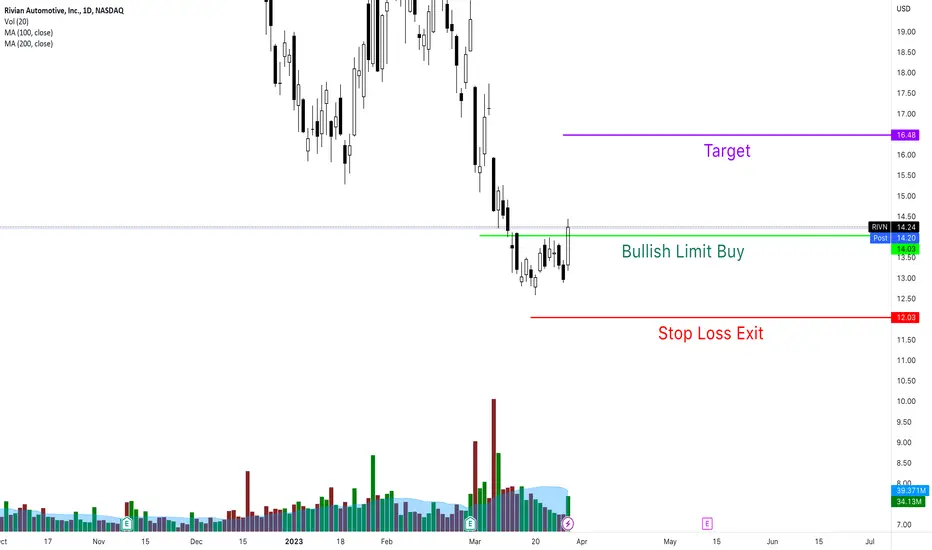
RIVN - Rising Trend Channel🔹Broken through the floor of a rising trend channel in the short term.
🔹inverse head and shoulders formation.
🔹POSITIVE signal with 15.02 resistance breakout, NEGATIVE with opposite formation reject.
🔹Between support 14 and resistance 15.6.
🔹Volume correlate with price up and down.
🔹Technically POSITIVE for the short term.
Chart Pattern;
🔹DT - Double Top | BEARISH | 🔴
🔹DB - Double Bottom | BULLISH | 🟢
🔹HNS - Head & Shoulder | BEARISH | 🔴
🔹REC - Rectangle | 🔵
🔹iHNS - inverse head & Shoulder | BULLISH | 🟢
Verify it first and believe later.
WavePoint ❤️

RIVN - Bullish PitchforkThis is what I am seeing on RIVN, looks very bullish. this pull back was a buying opportunity imho.


RIVN - Building nice multiple bottoms pattern
Test of 200 DMA seems to be in progress. What happens tomorrow could be vital.
If it can break above 16, can squeeze right up to 22 first and then 26.
Failure here again would send this to new low.
Alternate scenario is it keeps building inside the 200 and 60 DMA.
I took a start position today at 15. Will add or trim as PA reveals the trend.

RIVNHere's one worth watching, broken short term trend, bullish engulfing candle on twice relative volume. Needs a daily close and retest of 15.70 area for confirmation PT 1= $21. stock is relatively inexpensive. The way I'd play this is buy shares and sell weekly covered calls against it to protect downside, that way you capitalize no matter what direction it goes in.

TSLA tyring to get to blue skyTSLA on the daily chart descended from a triple top Summer '22 into a downturn which
reversed after earnings in late January. Since then with the usual waves of up action and
retracement it has risen into its current range also going through a cup and handle pattern
from early April into late May. On the chart with the volume profile and anchored VWAP
overlaid, price is at the confluence of the POC line and the mean anchored VWAP - over the
past year the highest volume of trading was at about $185. RSLA is now above that
bullish momentum. TSLA short-selling bears are getting destroyed right now. Their buying to sell
is the genesis of a potential short squeeze. The latest trend started after an announcement of
partnership with Ford regarding charging stations. I have drawn onto the chart what I see
as horizontal resistance lines for targets in a trade. Aslo on the chart is a set of zero-lag EMAs
to provide further context. I will take a trade of four additional call options with a strike of
$185- I will close one for each horizontal target reached. I will run the last contract on a
trailing stop loss of 20% while expecting an overall conservative realized take profit of over
300%. The stabilization of macroeconomic headwinds in both the US, Europe and China
will allow significant tailwind to push TSLA higher. One of those tailwinds could be the
imperative that a rising price places on short sellers including a vast array of put options.

$LCID - Bulls driving EVs now?LCID looks heavily oversold and the options open interest delta is saying so too. I live in a big city and for the past weeks have been seeing their vehicles around. I remember in may 2022 I started seeing RIVN trucks around and the stock had a small push from $19 - $40. Think a bull can actually drive?

Pursuit of the the next Tesla..!Most people invest their money in these 3 companies, NIO, LUCID, Rivian, or all of them because they had missed the opportunity to participate in the inflationary phase of the Tesla Bubble..!
Unfortunately, now the deflationary phase of the bubble overlap, and they are coming down on the latitude mode..!
People who invested in these stocks have lost more than 2/3 of their money and it will not be back soon..!
Why?
Because these companies do not generate meaningful revenue to become interesting for big players..!
I forecast single-digit price tags for all of them in 2022, NIO could go down to 5 or below..!
Best,
Dr . Moshkelgosha M.D
DISCLAIMER
I’m not a certified financial planner/advisor, a certified financial analyst, an economist, a CPA, an accountant, or a lawyer. I’m not a finance professional through formal education. The contents on this site are for informational purposes only and do not constitute financial, accounting, or legal advice. I can’t promise that the information shared on my posts is appropriate for you or anyone else. By using this site, you agree to hold me harmless from any ramifications, financial or otherwise, that occur to you as a result of acting on information found on this site.

Tesla - $250 Is Coming... Don't Lose Your Legs In the Bear Trap As I said in my previous call on Tesla, which was rather successful, I'm not a big fan of Elon Musk.
Tesla TSLA - The Bottom Is In, But It's Still Bearish
Especially as the post-Twitter acquisition has unfolded, I feel Musk rode the wave he could to do his "Twitter Files" thing and clawback some rightists/Conservatives that were alienated under the former Mastodon socialist leadership.
But the Twitter Files weren't really news to anyone who actually has been following COVID lockdown narrative or January 6 Capitol Riot censorship. And now Twitter is kind of the same as it's always been, but more shadowbanny, and will increasingly become more and more central to the coming globalist Central Bank Digital Currency/social credit system.
Musk, a transhumanist, has alluded to transforming Twitter into an "everything app" himself, all while lauding the communist regime in China's WeChat as if it were some kind of good thing.
CBDCs and social credit are, ultimately, the world outside of the Chinese Communist Party attempting to emulate and import the CCP's operational methodology and ways. This is a disaster for mankind, and should be opposed and challenged by everyone who wants a future.
A Warning on Red China
As always, my usual warning, especially for a company like Tesla that has a Gigafactory in Shanghai: you have to be very careful in bullish market conditions with the pandemic situation in China. Western media simply isn't reporting anything and the CCP keeps a very strict censorship regimen with a high degree of secrecy, so you'll be in the dark until it's too late to cry about your gap losses.
Xi Jinping and his Chinese Communist Party claims to have only suffered ~85,000 deaths since Wuhan Pneumonia began. That's 59 deaths per million people, and is literally a laughable claim that the epicenter of the pandemic and the world's (formerly) most populous country has suffered a factor of 10 or 60 times less magnitude of fatalities than the west that the regime exported the disease to.
In reality, this is obviously impossible. Moreover, the CCP covered up the 2003 SARS pandemic. A lot, a lot of people died during that pandemic, but the regime just told the world that everything was great.
Only a total fool believes anything that the CCP says.
The problem for a company like Tesla is a huge sum of both its supply and demand is tightly wed to China, and a pandemic situation that Xi can't keep under control and a weak Communist Party means the risk of black swan events hitting in the middle of the night when the US markets are closed is _extremely_ significant.
The Call
Now for price action, markets, especially NASDAQ and tech, all mooned in the wake and run up to FOMC. But this also came in the first two days of February, and we have a Jerome Powell speech on Feb. 7 and jobless claims on the 9th.
It's reasonable (and important) to anticipate that the low set at 10:30 AM on Feb.1 @ $169.95 is not going to be the low of the month.
It's also important to notice that the mania candle swept out the December high by 8 cents and was followed by a ~4% retrace, significant because it set up a double top pattern on the daily candles.
In my opinion, there's a very high chance that Tesla will dump rather aggressively to liquidate leveraged longs, raid long stops, and make weekly call options expire worthless, a move that will simultaneously serve as a bear trap.
$162 to $133 is a rather wide range, but it represents a combination of a weekly price displacement and a microgap. In combination with range equilibrium being $150, and $150 being a psychological operation number, a sweep all the way down to $145~ is something I anticipate.
Now, all that being said, what I would like to say is that Tesla has been so crazily bullish (almost doubling in under 30 trading sessions; this was still a $300 billion market cap company!), that range equilibrium may not be touched, and those gaps underneath it may be breakaway gaps.
So that being said, you have a hard choice if you want to go long on a dump. Because if you see $160, you really might not get better than $160 and Tesla doesn't like to stay low for long if it's going up. But if you buy $160 it can drop another 10 or maybe 15 percent, which means your calls turn (or expire if you're degen weekly) worthless.
This is a real game theory problem as the MMs, who know the schedule, use time as their greatest weapon. So perhaps a reasonable strategy is to go for the TSLL leveraged long ETF at $160 and just baghold/add if it drops more.
Bears talking about the gaps at $85 and lower, it's not that they're wrong... It's that Tesla already fell from $330~ to $100 in the course of a few months, and this was one of the world's largest companies by market cap. You really cannot afford to be so greedy to bottom short and bottom short and bottom short. You were already so lucky that you could bottom short and not get your head split for so long.
It's really very rare in equities to be able to do that.
The bounce has been so extreme that the market makers have thus made it clear that both two digit Tesla is not coming right now, and also that when you do see two digit Tesla, you can't buy it.
TL;DR, Tesla $250 is the next stop. If you get so lucky as to buy $150, I think that's pretty good, and you should even hold a portion of your position through $250.

RIVN, 10d+/-40.25%falling cycle -40.25% more than 10 days.
==================================================================================================================================================================
This data is analyzed by robots. Analyze historical trends based on The Adam Theory of Markets (20 moving averages/60 moving averages/120 moving averages/240 moving averages) and estimate the trend in the next 10 days. The white line is the robot's expected price, and the upper and lower horizontal line stop loss and stop profit prices have no financial basis. The results are for reference only.

RIVN - A competitor for Tesla?Rivian Automotive (RIVN) stock has recently hit a new 52-week low due to various factors, making it a highly volatile investment. The company's lower-than-expected production output in 2023, cash burn rate, and intensifying EV truck market competition have contributed to this decline. RIVN's Q1'23 deliveries beat estimates, but its 9.39K quarterly production remains unimpressive compared to the 50K annual guidance for FY2023. Furthermore, the company's cash burn rate is unsustainable, with a reliance on debt and capital raises until it achieves positive cash flow.
Increased competition in the EV truck market is also a concern, with Ford and General Motors reporting success in their respective segments. Rivian's R1T has garnered positive reviews, but its price is significantly higher than competitors' base models. The stock remains suitable for investors with higher risk tolerances and a long-term investing trajectory. Despite recent recovery, RIVN's uncertain outlook combined with the macroeconomic environment makes the stock very unattractive.
From a technical perspective, we may see a move to the upside that reaches the pink area marked on the chart between $17 and $18 but the higher probability move is a continuation to the downside, either from here or from the target area.
We will keep you updated on any changes we see on the chart. In the meantime, please trade with care and stay safe!

RIVN swingtrade?Double bottom possibility.
I HAVE seen more and more of their trucks. And I won't lie = they are nice. Better than TSLA's...... ;) ;) ;). #rightnow... ?
RIVN RIPJust look at it. the stock is shit. This is a break and retest of support though back to the downside, seeing a lot of exhaustion here.

RIVN HAS NO IDEA...after the recent trendline break, I believe we could see this stock pushing further down into new territory. looking for a retest before entering a short position.

Watchlist 2023-01-30 #BIDU #JD #RIVN #LCIDSPY gapping below PD open, putting any Friday longs underwater. I think it tests the convergence of the balance are top and the descending trendline around 400 - 401.50. From there, look to see if pops are sold are if they hold, that will tell if we had enough fuel to continue higher or if we need a larger flush out before approaching the 410 area.
BIDU - launching an AI-power chatbot in March. Not only is this the hot topic right now like crypto in 2021, but BIDU is also gapping over a balance area with a prior day bullish hammer. A+ setup if we can hold over 139. No real resistance until 150, and with a 5.0 ATR range is possible this could go that far today if SPY heats up. However, no bias until price actions confirms thesis as other ADRs are gapping down today.
JD - panning to exit sales in exit Thailand and Indonesia market. Sitting on key support at 61. If this can't hold, 58.30 at the 200MA is the next target. To Improve risk reward, better to sell pops in this IMO as long as they fade after and don’t hold.
Watching other ADRs if weakness from PM continues: BEKE, BABA, PPD
RIVN - keeping this on watch over the high volume node at 20.30. Also, past the April 25 2022 key pivot resistance at 19.30. If LCID buyout bullishness continues, RIVN could have a support rally.

TSLA - Triple Bottom then Flat Top TriangleTSLA has had a long down trend from macro factors including China , a recession as well as a unique
situation tying it to Twitter and Musk liquidating large blocks of stock.
From the technical side of things a recent triple bottom has evolved to a flat top triangle pattern.
Both of these are bullish suggesting a reversal is real. The setup is for a breakout above
the flat top ( black line drawn on the chart) I will add TSLA back to the waitlist and watch
it also with a small position in leverged TSLL. Once it is above the breakout level of 124.75
call options with 2 weeks expiration strike of 130 will be entertained.
