Pollback for Continue bull-trend❤️❤️Thanks for boosting 🚀 and supporting us!
📈break resistance and start bull-trend by big candle.
📊 (Buy) : 2.886$
🔴 Stop Loss : 2.717$
🎯 Take Profit : 3.199 -3.434$
🔗 For more communication with us, send a message in TradingView.
RNDRUSD

Rising from the bottom section above 2.566Hello traders!
If you "Follow" us, you can always get new information quickly.
Please also click “Boost”.
Have a good day.
-------------------------------------
(RNDRUSDT chart)
The key is whether it can receive support and rise in the 2.566-3.058 range.
(1D chart)
The key is whether it can rise above 2.987-3.415 based on the 2.773 point, or whether it can fall to the 2.209-2.566 range and receive support.
--------------------------------------------------
- The big picture
The full-fledged upward trend is expected to begin when the price rises above 29K.
This is the section expected to be touched in the next bull market, 81K-95K.
-------------------------------------------------- -------------------------------------------
** All explanations are for reference only and do not guarantee profit or loss in investment.
** Trading volume is displayed as a candle body based on 10EMA.
How to display (in order from darkest to darkest)
More than 3 times the trading volume of 10EMA > 2.5 times > 2.0 times > 1.25 times > Trading volume below 10EMA
** Even if you know other people’s know-how, it takes a considerable amount of time to make it your own.
** This chart was created using my know-how.
---------------------------------

Trade signal | Render Token (RNDR) setting up for upto 27% pumpHi dear friends, hope you are well and welcome to the new trade setup of Render Token (RNDR) with Bitcoin pair.
Previously we caught almost 13% pump of RNDR as below:
Now on 2-hr time frame, SANTOS is completing the final leg of a bullish AB=CD move for the next price reversal.
Note: Above idea is for educational purpose only. It is advised to diversify and strictly follow the stop loss, and don't get stuck with trade.

RNDR target 5.512h time frame
-
RNDR is creating a bottom structure under 3, and there is a first pumping wave started from 0.4 to 2.99 which verify the resistance of 3 again. However, RNDR got support on 0.382 Fibonacci Projection and keep pumping, this is a good bullish sign. Through Fib, the first target is around 3.7~4 and next is 5.5, then we can set up a trading plan.
TP: 3.7~4 / 5.5
SL: 1.67150

RNDR shortRNDR looks heavy atm... Time for a short position...
It lost the trendline, made a deviation allready...
See chart for more info...

RNDRUSD: Small but steady rise. Expect more aggression soon.Render Token has been steadily rising since the August 28th contact on the HL trendline but more importantly the 1W MA50, which held for the second time since the week of March 6th 2023. The 1W technical outlook is neutral (RSI = 53.781, MACD = 0.060, ADX = 33.069) meaning that there is significant upside potential. The Bullish Cross that is about to be formed on the 1W MACD also reveals that this is only the start of a long term leg. We are aiming at the R2 level (TP = 4.25000).
## If you like our free content follow our profile to get more daily ideas. ##
## Comments and likes are greatly appreciated. ##

RNDR LONG SWING IDEA +60%Current price holding and rejection from POC.
Opens the door to the VAH level, but before that I expect another drop because the 100 and 200 Dma arrive at the daily level of 1.72.
If the setup appears down again at POC or a little below the last monthly level, you can entry to swing long and try to capture 60% of the profit.
I showed where I would hold a stop loss if this idea comes up.
A hidden bullish divergence appeared on the weekly.
Below stop loss to be passive, possibly a DCA who follows and believes in this project.
If you like this post, check my profile and find something useful!

RNDR IS REALY BEARISH (1D TF)rndr has been forming a large bearish triangle for some time now. We now seem to be in wave E.
The waves of this triangle are for the daily time frame and it takes time.The red box is the right place for the termination of the last wave of this triangle, i.e. wave e, and then the symbol can enter a strong falling wave. You must control your risk and do not enter a position without capital and volume management.

$RNDR SHORTBINANCE:RNDRUSDT SHORT - 1 month range has been $1.3 - $1.55. Deviated above the range for a few days and now back inside again. Lost horizontal and diagonal support. Bearish retest and reject.

RNDR IS VERY BEARISH (4H TF)RNDR has reached a daily resistance. RNDR actually returned to this resistance, which is a falling order block, to gather orders.
CH has made a downtrend which is a good confirmation. In my opinion, RNDR is very runny.
I have specified the goals.
I have specified the invalidation level, closing 1 daily candle above this level will cause an analytical violation.
For risk management, please don't forget stop loss and capital management
When we reach the first target, save some profit and then change the stop to entry
Comment if you have any questions
Thank You

RNDR SHORTBINANCE:RNDRUSDT SHORT
Deviation above range highs to hunt stops and back inside the range again.
Bearish divergence building up on 6h since last Friday.
Entry now: 1.48
Target: 1.33
Stop: 1.54

RNDRUSD ❕ divergenceTD Sequential formed a reversal signal down (30m TF)
Price and RSI formed a divergence, volatility continues to decline.
I expect the price to decline.

$RNDR performed Descending broadening$RNDR performed Descending broadening wedge
What is a descending broadening wedge?
A descending broadening wedge is bullish chart pattern (said to be a reversal pattern). It is formed by two diverging bullish lines.
A descending broadening wedge is confirmed/valid if it has good oscillation between the two upward lines . The upper line is the resistance line; the lower line is the support line.
Each of these lines must have been touched at least twice to validate the pattern.
NB: a line is said to be "valid" if the price line touches the support or resistance at least 3 times.
This implies that the descending broadening wedge pattern is considered valid if the price touches the support line at least 3 times and the resistance line twice (or the support line at least twice and the resistance line 3 times).
A descending broadening wedge does not mark the exhaustion of the selling current, but the buyers’ ambition to take control. The divergence of the two lines in the same direction (increase in price magnitude) informs us that the price continues to fall with movements that are increasingly low in magnitude. The sellers manage to make the price rebound on the resistance line but lose control after the formation of a new lowest point. The highest point reached during the first correction on the descending broadening wedge’s resistance line forms the resistance. A second wave of decline then occurs of more magnitude, signalling the sellers' loss of control after a new lowest point. A third wave forms afterwards but the sellers lose control again after the formation of new lowest points.
During the formation of a descending broadening wedge, volumes do not behave in any particular way but they increase strongly when the support line breaks.

RNDRUSDT heading towards weekly resistanceThis one is going as per expectation. The monthly support is doing its job and holding the price well and making the price bounce if the price hits that level. High time frame view is still the same and expectation is there that the price will be held by the monthly support and will head towards weekly resistance. I do see that weekly resistance stopping the price and making it stop its upward move at least temporarily but we will reevaluate once the price reaches that resistance zone.

RNDR SHORTBINANCE:RNDRUSDT SHORT. Horizontal resistance and 6hr bearish divergence. Rejected at range highs, looking for a move towards range lows again.

RNDR on monthly support, very likely to head higherAs mentioned in the original post, this one has hit the monthly support and has been since trading around that support zone. The price has bounced from there and I think it is getting ready for the upward move. I think this is a very good opportunity. Even if the price dips again into the support zone, the probability of bouncing from there is very high although I do not see very likely that the price will dip deeper into the support zone again. This is also characterized by the last weekly candle close which rejected any attempt to go lower than the previous weekly low.

RNDRUSD Strong buy evidence but best wait for a break-out.Render Token (RNDRUSD) is on the 3rd straight green 1D candle, having the best bullish sequence since June 21. The pattern remains a 3-month Channel Down but for the first time this is being executed from oversold 1D RSI levels as well as almost testing the 1W MA50 (red trend-line) for the first time since January 23.
The formation of a 1D Death Cross though, makes our sentiment mixed and prefer to take a confirmed buy signal instead. That will be above Resistance 1 (1.7685) and obviously the top (Lower Highs trend-line) of the Channel Down. Upon that break-out (1D candle closing above) we will buy and target 2.1600 (0.618 Fibonacci).
-------------------------------------------------------------------------------
** Please LIKE 👍, FOLLOW ✅, SHARE 🙌 and COMMENT ✍ if you enjoy this idea! Also share your ideas and charts in the comments section below! **
-------------------------------------------------------------------------------
💸💸💸💸💸💸
👇 👇 👇 👇 👇 👇

RNDRUSDT at monthly support and the support likely to holdThe price has hit the monthly support zone. It has bounced from there but a revisit possibility to that zone cannnot be denied. However, this is a high time frame support and shall hold on monthly basis and therefore offers long opportunity. The first resistance that would be faced by the price in case of upward move is the weekly resistance sitting around 1.63-1.72.

RNDR LOOKS BEARISHHi, dear traders. how are you ? Today we have a viewpoint to SELL/SHORT the RNDR symbol.
For risk management, please don't forget stop loss and capital management
When we reach the first target, save some profit and then change the stop to entry
Comment if you have any questions
Thank You

Render Token (RNDR) formed bullish Gartley for upto 11% pumpHi dear friends, hope you are well and welcome to the new trade setup of Render Token (RNDR) with BTC pair.
Previously we caught more than 12% pump of RNDR as below:
Now on a 4-hr frame, RNDR has formed a bullish Gartley move for the next price reversal.
Note: Above idea is for educational purpose only. It is advised to diversify and strictly follow the stop loss, and don't get stuck with trade.

RNDRUSD ❕ descending wedgeTrading volumes declined.
The price has formed and continues to move in a descending wedge.
The asset will start rebounding after fixing above the resistance level.

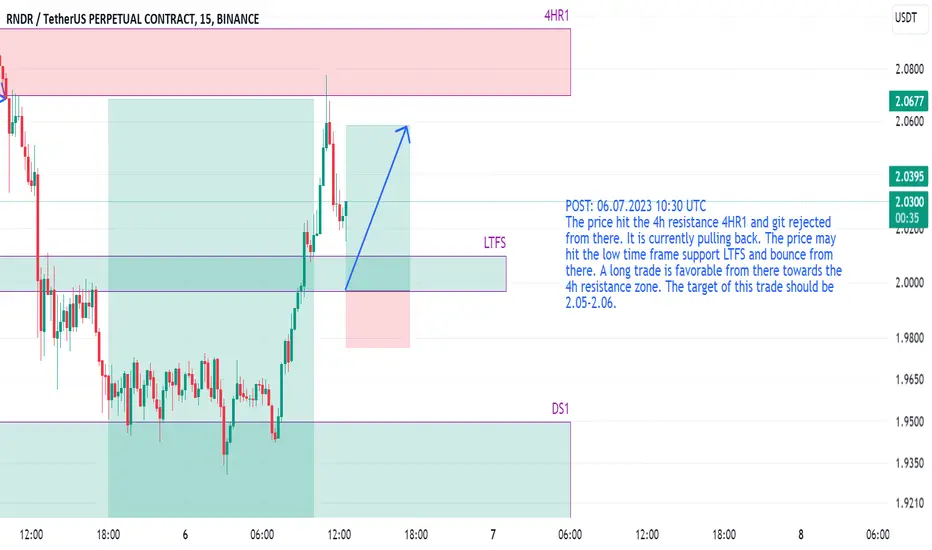
RNDRUSDT long idea from LTFSThe price hit the 4h resistance 4HR1 and git rejected from there. It is currently pulling back. The price may hit the low time frame support LTFS and bounce from there. A long trade is favorable from there towards the 4h resistance zone. The target of this trade should be 2.05-2.06.
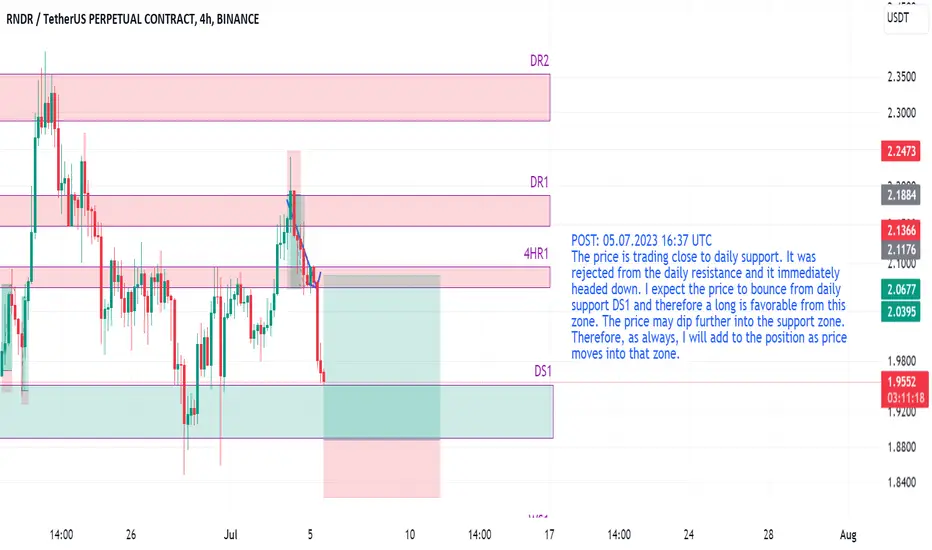
RNDRUSDT at daily support, likely to head to 2.07The price is trading close to daily support. It was rejected from the daily resistance and it immediately headed down. I expect the price to bounce from daily support DS1 and therefore a long is favorable from this zone. The price may dip further into the support zone. Therefore, as always, I will add to the position as price moves into that zone.