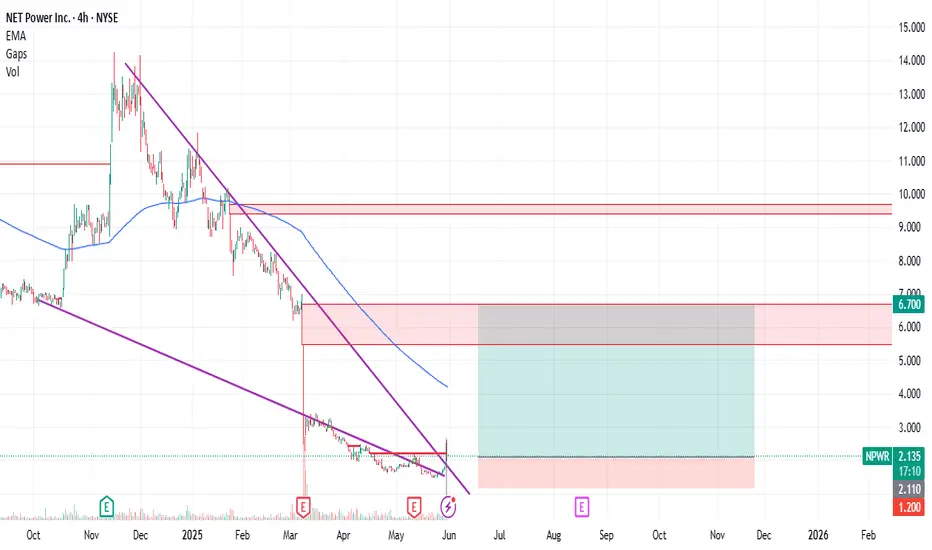
NPWR : Small Position Size Play with 5.00 Risk-Reward RatioNet Power Inc. NPWR stock has seen high volume and a tendency to break the falling wedge. Can this initiative close the gap that ended at 6.7 ?
This traded can be tried with very small position size.
Because Stop-Loss and Target are very wide.
Risk-Reward Ratio : 5.00
Stop-Loss : 1.20
Target: 6.70
RR
AXL 8R Trade Idea with Entry, Targets, and Stop LossAXL is down from entry and has tagged the previous weekly entry that sent price down 32% and then up 500% (47 cents entry to 32 cents low, and finally a rally to $2.7). Price has retraced this move back to the previous entry of 47 cents AND made another weekly entry at 57 cents.
Targets based on the risk from that entry have been drawn.
Yellow Stop loss of -20% is based on previous lows.
Orange stop loss of -33% is based on how low price went after the previous weekly entry of 48 cents before the rally (-32% from weekly entry)

XAUUSD Look at this reversed from exact level from where I told you guys look at previous post and see for yourself

Rolls Royce: driving to further losses?Rolls Royce
Short Term - We look to Sell a break of 81.96 (stop at 86.87)
Bias is mildly bearish today but we need to see a break of 81.96 to confirm the downward pressure. The medium term bias remains bearish. The bias is still for lower levels and we look for any gains to be limited. We look for losses to be extended today.
Our profit targets will be 68.53 and 61.30
Resistance: 86.00 / 100.00 / 110.00
Support: 82.00 / 70.00 / 50.00
Disclaimer – Saxo Bank Group. Please be reminded – you alone are responsible for your trading – both gains and losses. There is a very high degree of risk involved in trading. The technical analysis, like any and all indicators, strategies, columns, articles and other features accessible on/though this site (including those from Signal Centre) are for informational purposes only and should not be construed as investment advice by you. Such technical analysis are believed to be obtained from sources believed to be reliable, but not warrant their respective completeness or accuracy, or warrant any results from the use of the information. Your use of the technical analysis, as would also your use of any and all mentioned indicators, strategies, columns, articles and all other features, is entirely at your own risk and it is your sole responsibility to evaluate the accuracy, completeness and usefulness (including suitability) of the information. You should assess the risk of any trade with your financial adviser and make your own independent decision(s) regarding any tradable products which may be the subject matter of the technical analysis or any of the said indicators, strategies, columns, articles and all other features.
Please also be reminded that if despite the above, any of the said technical analysis (or any of the said indicators, strategies, columns, articles and other features accessible on/through this site) is found to be advisory or a recommendation; and not merely informational in nature, the same is in any event provided with the intention of being for general circulation and availability only. As such it is not intended to and does not form part of any offer or recommendation directed at you specifically, or have any regard to the investment objectives, financial situation or needs of yourself or any other specific person. Before committing to a trade or investment therefore, please seek advice from a financial or other professional adviser regarding the suitability of the product for you and (where available) read the relevant product offer/description documents, including the risk disclosures. If you do not wish to seek such financial advice, please still exercise your mind and consider carefully whether the product is suitable for you because you alone remain responsible for your trading – both gains and losses.

Putting Risk Reward into PerspectiveMost newbies, and even intermediate traders don't really understand what high risk to reward trades require from themselves and from the market. They think it is something to strive for, and that high RR trades are reserved for the pros. This is far from the truth.
In this video I try to give more perspective to this concept.
- R2F

BACK TO 82!!!!!If we encounter a gap that needs to be filled, we opted for a 1:4 trade, indicating the necessity to address this gap. This decision was prompted by our deviation from the established sideways trend and supported by several technical confirmations that guided us to follow and stay informed.

XLM IDEA, POSSIBLE 25% GAINSXLM has broken back above old support. History shows us that every time it has reached the above resistance. If it was to retrace and show that it held support, then I would take the long to the above resistance. I will update if the opportunity arises so make sure to follow!

XRP possible end of the correction The 61.8% retracement level is considered significant because it represents a deep retracement that often occurs before the price resumes its trend in the original direction. However, it's important to note that no retracement level is foolproof and that traders should always use additional analysis and risk management techniques when making trading decisions.
Possible good entry since the RR in this scenario is going to be quite high


RR to found buyers at 50% pullback?Rolls Royce (RR.) - 30d expiry- We look to Buy at 79.07 (stop at 75.15)
Short term bias has turned positive.
Levels close to the 50% pullback level of 79.62 found buyers.
Levels below 80.00 continue to attract buyers.
We look to buy dips.
Daily signals are mildly bullish.
Our profit targets will be 88.88 and 90.88
Resistance: 90.00 / 94.80 / 97.00
Support: 84.50 / 82.00 / 78.30
Disclaimer – Saxo Bank Group.
Please be reminded – you alone are responsible for your trading – both gains and losses. There is a very high degree of risk involved in trading. The technical analysis , like any and all indicators, strategies, columns, articles and other features accessible on/though this site (including those from Signal Centre) are for informational purposes only and should not be construed as investment advice by you. Such technical analysis are believed to be obtained from sources believed to be reliable, but not warrant their respective completeness or accuracy, or warrant any results from the use of the information. Your use of the technical analysis , as would also your use of any and all mentioned indicators, strategies, columns, articles and all other features, is entirely at your own risk and it is your sole responsibility to evaluate the accuracy, completeness and usefulness (including suitability) of the information. You should assess the risk of any trade with your financial adviser and make your own independent decision(s) regarding any tradable products which may be the subject matter of the technical analysis or any of the said indicators, strategies, columns, articles and all other features.
Please also be reminded that if despite the above, any of the said technical analysis (or any of the said indicators, strategies, columns, articles and other features accessible on/through this site) is found to be advisory or a recommendation; and not merely informational in nature, the same is in any event provided with the intention of being for general circulation and availability only. As such it is not intended to and does not form part of any offer or recommendation directed at you specifically, or have any regard to the investment objectives, financial situation or needs of yourself or any other specific person. Before committing to a trade or investment therefore, please seek advice from a financial or other professional adviser regarding the suitability of the product for you and (where available) read the relevant product offer/description documents, including the risk disclosures. If you do not wish to seek such financial advice, please still exercise your mind and consider carefully whether the product is suitable for you because you alone remain responsible for your trading – both gains and losses.


EURCAD CHART ANALYSISI believe that the last retracement of the price towards the trend line on EURUSD was due to the pressure of the ECB to contain inflation recently. Certainly, there were rumors that the Russia-Ukraine conflict might be taking a turn. Considered the possibility that the Ukraine-Russia conflict would escalate, and sure enough. The best opportunity given this escalation of the conflict was against the CAD, given that it would benefit from the rise in oil prices that the risk-off environment entails.


BUY oppertunity for TIME TECHNOPLAST hey guys ,
TIME TECHNOPLAST stock was moving in a uptrend in a fixed area
and now this stock has touched it's support area and made a candle called
A MORNING STAR
i have marked the RR RATIO for you ,
you can see the target and sl by zooming in the above image
RR RATIO is 3:1
try to trade according to that ratio or adjust it accordingly to you
TIME TECHNOPLAST 😀😀

COFORGE , starting UPTREND after retesting hey guys ,
COFORGE stock is showing signs of UPTREND,
this stock was moving in a fixed downtrend ,
2-3 weeks before this stock has crossed it's RESISTANCE and broke the DOWNTREND AREA .
After breaking that area , the stock has retested
But instead of going into a straight uptrend ,
this stock started to follow a pattern called TRIANGLE PATTERN
and now this stock has CROSSED the RESISTANCE of that TRIANGLE PATTERN ,
and a big green candle is presented by this stock .
therefore guys , i suggest you that
try to grap this stock and earn high returns .
( but it is not sure that you will achieve your target
if stop loss is hit , pls cut ur position)
i have marked the RR RATIO , TARGET AND STOP LOSS
BUT FIRST CONSIDER THE GLOBAL MARKET SITUATIONS
1. INFLATION
2. WAR
3. RISING BANK RATES
AFTER CONSIDERING THESE SITUATIONS, YOU CAN BUY THIS STOCK
😀😀


HDFC BANK has retested, and showing BULLISH signs hey guys ,
just found a good stock to talk about ,
HDFC BANK was moving in a great downtrend .
This stock was following a pattern called
DESCENDING TRIANGLE 📐 PATTERN
previously also ,
this stock has tried to cross his resistance
and to break hi pattern,
but it FAILED
and it resulted to BULL TRAP for TRADERS
but now this stock has again broke his resistance and pattern ,
and now I think that
this stock will be successful in BREAKING HIS PATTERN ,
because there is no place left for this stock to continue his pattern ,
therefore , from my opinion you can bet on this stock and earn high returns ,
i have marked the RR RATIO , TARGET AND SL
y'all can trade according to this RR RATIO ( IF U WANT TO )
otherwise, you can adjust it accordingly. BUT PLS CONSIDER THE GLOBAL MARKET SITUATIONS
1. INFLATION
2. WAR
3. RISING BANK RATES ( IMPORTANT FOR THIS STOCK )
😀😀
HDFC BANK


RR > 20 , Risk < 1%based on previous analysis which is linked below, I'm sure about bearish market and losing bottom (26.7 k)
for catching an interesting opportunity, I suggest this long position ....
bermuda on 29K is a strong level to support BTC, in addition the yellow trend line make a tempting liquidity for big boys to fill their buy orders
I expect reversal pivot on purple level above, so 35k would be first terget

2306 EURUUSD 4H chance to sell WITH SIGNAL!!!!Hello traders,
Let me make is simple on this 4H chart.
Price took a week to rise up to the pressure zone 1.05-1.06 with 5 waves . You can say it is not easy for it.
With strong possible bearish signal on 4h chart, that the final candle will finish in 2 hrs, you can say that sideways price action inside the circle is going to finish with a bearish candle which will make all those small body candles into a complicated evening star signal.
So make sure you plan can make a entry by those candle and a possible trade with RR>3 WILL BE YOURS.
GOOD LUCK ON THIS SELLING PLAN.
LESS IS MORE!


