Ascending triangle in Filecoin* Filecoin in 4H time frame forms Ascending triangle with it's resistance near $75.5 and the below trend-line as it's support.
* The RSI divergence also appears on Filecoin, it occurs when there is no longer the same momentum between the price and the RSI indicator.
* If the price breaks either side of the pattern we can see a healthy move.
Rsidivergence

Bitcoin 2300+ In Profit SetupGood day guys! If you were able to enter into this position, you are 2300+ pips in profit. Another phenomenal call. Be sure to move your stop loss into profit. I still do see there is a lot of downside to go, however, nothing goes straight up or straight down. Well I do appreciate you for checking out our post and remember, we will see you on the other side.
Rodrick Goss (CEO)
Third Eye Traders
SPY reversal: Turning downtrendAs one can see in the chart, there is RSI divergence. This is a hint at a reversal in momentum.
After the impulsive move towards 447 we are due for a pullback. I believe we should hit some support at 446 and experience a very small rise again (not to an ATH) before we experience a pullback through the support at 446 toward the support at 443.
Once we hit support at 443 I believe we will see an impulse movement toward 446 in which we will reject it and start the downtrend where we have lower highs and lower lows. From here we may form a head and shoulders.

✅EOSUSDT +45%💥✅This trade is made taking into account the RSI divergence shown in the chart. Price went down while RSI is going Up. Our Target Price is close to 6.8, with a +45% profit.
Play safe, Use only 2% of your available capital.

AUDUSD - Head and ShouldersPotential Head and Shoulders formation for up on AUDUSD, stops has to be placed below the head as this is a sloping head and shoulders.

RSI Bearish Divergence: Ascending Broadening Wedge.If we were to go based off of textbook targets then the next stop of 0x would be around 52 cents but if we wanna be conservatize i'd say just to target the 618 for profit taking as that will yield more than enough profit to justify the trade.

$YFIUSDT - DivergenceHello everyone!
There is a divergence on YFIUSDT!
While the Relative Strength and the Volume is going down, the price is going upwards.
The explanation to this is that all crypto are following Bitcoin but at some point buyers would start accumulating their profits, hence we are looking to short it.

GBPUSD - Support and ResistanceIf you had joined our live session last night, you will be amazed by how the market unfolds and respected the Support Line, Blue Line.
I've bought GBPUSD at 1.3886, first target goes to the structure resistance at 1.3976 and target 2 will be an extended target.
Check out the link in my signature.


Resume Bullrun 🐂 Historic Support 🟢 TP1 ✅ Go for TP2 🤔Resume Bullrun 🐂 Historic Support 🟢 TP1 ✅ Go for TP2 🤔
"History never repeats and always rhymes."
- A TradingView trader whose name I forgot
It's an extension of my previous idea.
I hold my opinion on everything there and add a new viewpoint with this idea.
◀️ KEY POINTS:
- Opportunity To Break All Bearish Channels At Once & Resume Bullrun (= Open New Bullish Channel)
- Bears Are Vulnerable
-- Saturday Bear Trap Was Successful
-- Bears Are Tired: Multiple Bullish Divergences On RSI
- Bulls Are Powerful
-- Bulls Are Still Energetic: Higher Highs on RSI
-- Historic Invincible Support Hit
-- Smart Money Bought The Dip
-- Psychologically Tempting Target: $40k
-- Funding Rate Favors Longs
-- Excellent RRR: 400%
-- Every Time In History When BTC Hit This Support Then Hit $40k Within A Week
-- Next Week Will Be Green
--- Starts From Today
🌌 OUR SIDE:
POSITION: Long
LEVERAGE: x10
ENTRY: $32 000
STOP LOSS: Daily close below $29 900 and staying there for six hours
TARGET: $40 000
$33 000 - $34 000 TP1 ✅
We Hold Our Position & Go For TP2: $40 000 - $42 000

LTCUSD Breakout & RSI Divergence | Bad Days Over for CRYPTOFollowing chart is of Litecoin, which shows RSI Divergence and Breakout.
RSI Divergence is a condition when the price trend is opposite to the RSI Trend.
Here, in this case, The price is making Lower Top Lower Bottom, but the RSI is making Higher Top Higher Bottom.
Also breakout has been completed.
Do follow for more such Analysis.
Comment below any Queries.
Thanks for your time.

NZDJPY - TrendlineDon't underestimate this trendline, if the candle fails to break and close above this trendline, it shows that this will be an amazing shorting opportunity. Even when it breaks and closes above this trendline, I'm not looking for a buying opportunity right away and the reason is that on the 4-hourly chart there is multiple shorting opportunities.

EURUSD-Weekly Market Analysis-Jul21,Wk5Don't underestimate the earning potential when the market is moving sideways, always assess the market before giving up on the trading setup.
What if I tell you that this bounce has a 60pips range?
Now, will you be interested?
I'm waiting for a retest at 1.1759 for a buying opportunity.

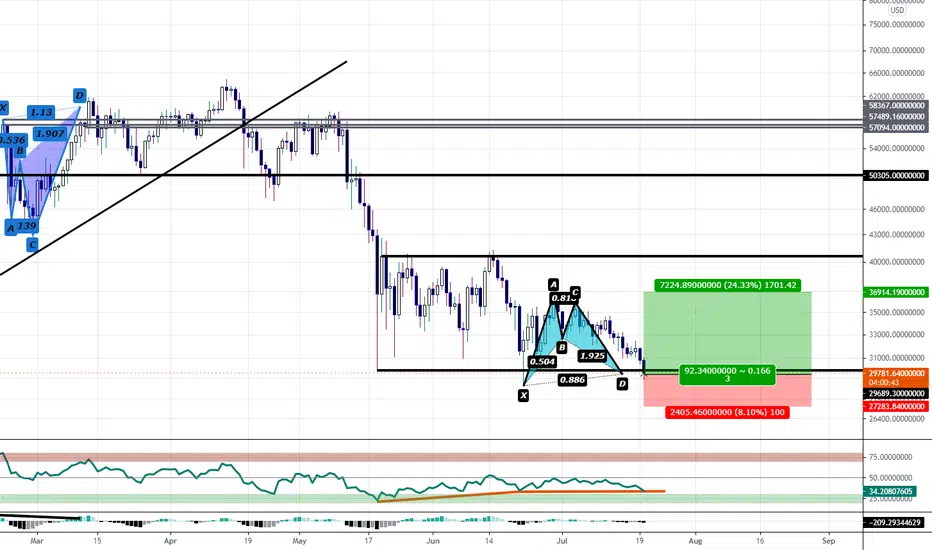
Bullish bat near bottom of a range: RSI DivergenceWe have RSI Divergence near the bottom of a range at an 0.886 PCZ to a bullish bat pattern if we're lucky we may see a run up back to around $35,000 but if BTC Breaks the range and fails to stay above $28,000 then we will likely see BTC dump down to $18,0000 or lower.
The RSI explained ! how to identify buy and sell signals Hello everyone , as we all know the market action discounts everything :) I have created this short video to explain what is the RSI and how to use it to identify buy and sell signals with this oscillator , everything you need to know about this indicator is right here.
Its been around since the late 70s so its probably one of the more established oscillators out there .
So lets check out the formula and how the RSI works :
RS=100 -100/1-RS
RS (relative strength) average X day up / average X day down
So simply lets say we are using a 10 days average so we check how many days the price closed up and we add them and we divide by 10 which would give us the average X days up.
And we do the same for the average X days down but we calculate how many days the price closed down and then we add them and divide by 10 ,And after all of that has been calculated we will always get a value between 0% and 100%
And that's why the RSI is considered a bounded oscillator it means that the value will always be between 0 % and 100%
The oscillator has 2 major zones which are the overbought and oversold zones. Anything above 70% is considered overbought and anything below 30% the market considered oversold .
So when the market reaches overbought zone it tells us that the market has gone up to far and its due a bounce back down , and the same when it reaches oversold zone it means that the market has gone to far down and its due a bounce back up.
So looking to buy or sell when the market reaches oversold and overbought is one strategy .
But because the market moves a lot and reaches these levels so much this way is not as reliable that much , the better way to use the RSI is to check if it has a divergence with the market price.
what is a divergence you may ask !!!
A Divergence is when the price of the market is moving in the opposite direction of a technical indicator, such as an oscillator, Divergence warns that the current price trend may be weakening, and in some cases may lead to the price changing direction.
These signals of divergences doesn’t happen that often but they do give us a better way to use the RSI .
And there is it that’s everything you need to know about the RSI and how it works it’s a really simple oscillator and its one of the most popular oscillators used by technical analysts.
_____________________________________________Make sure to Follow, Like & comment for more content_____________________________________________
If you have any questions please ask
Thank you for reading & watching .

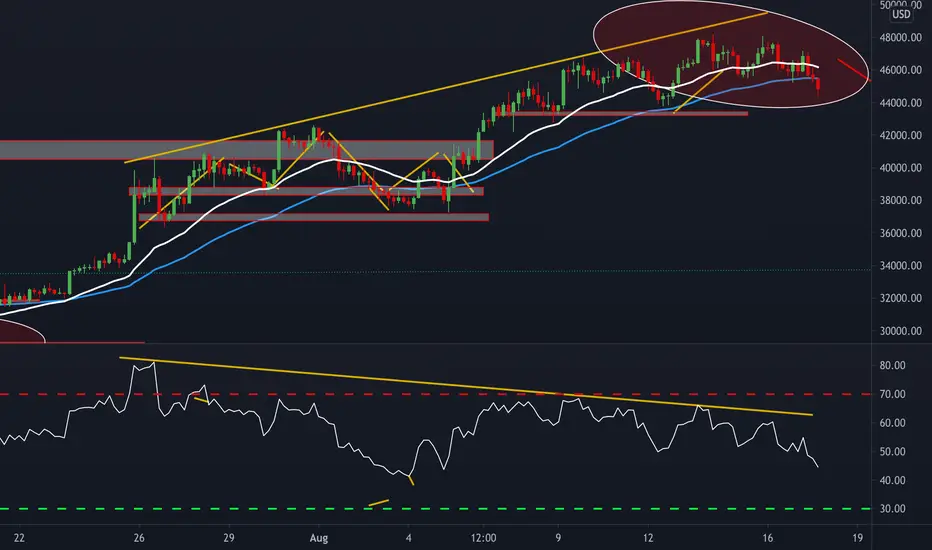
Bitcoin 2021: RSI divergence A bearish divergence is the pattern that occurs when the price reaches higher highs, while the technical indicator makes lower highs. Although there is a bullish attitude on the market, the discrepancy means that the momentum is slowing. Therefore it is likely that there will be a rapid decline in price. RSI divergence is primarily used to determine when it’s time to sell because prices are likely to drop or when a general trend reversal is in the cards. As a leading indicator of a trend reversal, divergence should be combined with other technical analysis methods when making the decision to act on a specific investment.

EURJPY - Sideway BounceWell, if you have read this week analysis on GBPUSD, EURJPY offers a better sideway bounce setup. Comment down below if you know the reason behind it.
I'm waiting for a buying opportunity at 129.67, alert has been set for a buying opportunity.

GBPUSD-Weekly Market Analysis-Jul21,Wk4GBPUSD has a sideway bounce formation on the 1-hourly chart but I would say the EURJPY sideway bounce setup is a better setup, check out my trade-ideas profile for the setup.
On GBPUSD a minimum setup will be a Double Bottom with RSI Divergence for me to engage a buying opportunity.
Conservative traders will place stop-loss below the low of the circled shadow.


A nice trading idea on AMC! 🤑Yes, we have something nice going on here! The breakpoint is the 49.79, and AMC has this weird RSI with some good divergences.
We are just at a support level in the 4H chart, doing a good candlestick pattern. If AMC triggers the buy sign, the 65 will be the target! Let’s pay attention to these signs!
If you liked this trading idea, remember to click on the “Follow” button to get more trading ideas like this, and if you agree with me, click on the “Agree” button 😉.

All going as planned! 👍 How to proceed now? 🧐Again, PLTR did exactly as we planned, and it did hold around the support area we talked about yesterday. Just like WISH, we have an RSI divergence + advanced breakout. All of this is great, and tells us there’s a good chance PLTR will do something good next.
In the 4H we are still oversold, and we do have a good candlestick, as we expected. Now there’s a good chance PLTR will fly again but remember: Always trade with a strategy! I do have mine, be sure to have yours!
I see PLTR at 25 is it triggers its buy signs!
If you liked this trading idea, remember to click on the “Follow” button to get more trading ideas like this, and if you agree with me, click on the “Agree” button 😉.
See you soon,
Melissa.
