RUNE SHORT SETUPThe RUNE symbol is one of the bullish symbols of the market. But we have signs on the chart that show that the rise of the RUNE symbol seems to be over.
It can go back up to the specified range to collect orders and complete reversal waves. In the specified range, we are looking for confirmation to take sell/short transactions. Until this range is reached, it is risky to enter sell/short positions.
I specified the invalidation level, closing a candle above this level will violate the analysis
For risk management, please don't forget stop loss and capital management
Comment if you have any questions
Thank You
Rune

#THORChain #RUNE Long-Term chart analysis#THORChain #RUNE Long-Term chart analysis
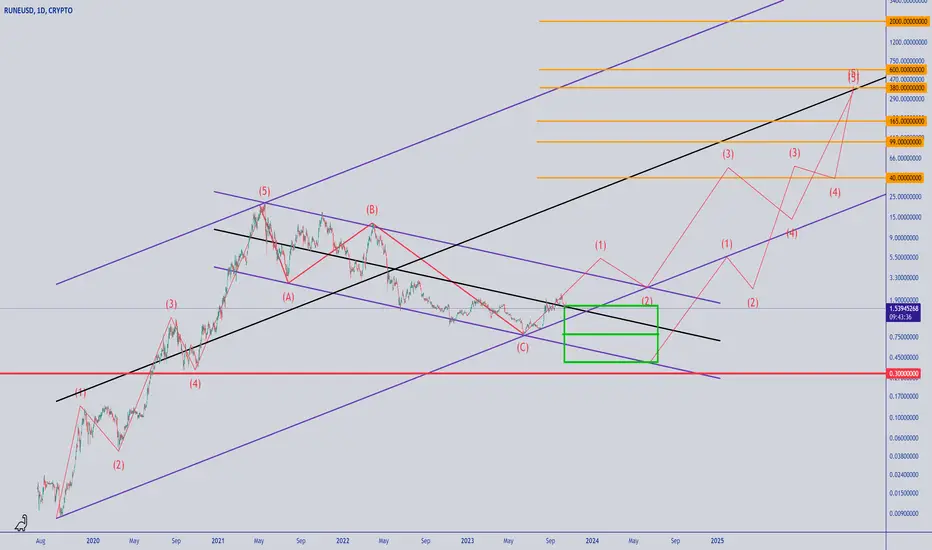
According to the chart and the wave counter marked on it, the downward trend of this currency is probably over. And we can expect the beginning of its long-term upward movement. But since there is a possibility that we will have more decline ahead, so three entry steps are suggested at the current price of $1.53, then the price of $0.80 and finally the price of $0.40.
The primary target of the possible rise is the price of $40 by the end of 2025, which has a good risk-to-reward ratio.
The target are:
target1: 40$
target2: 99$
target3: 165$
target4: 380$
STOP LOSS: 0.30$
TIME: 1 YEAR
RUNEUSD Megaphone rebound aiming higher.THORChain (RUNEUSD) is testing the 1D MA50 (blue trend-line) as short-term Resistance after a clear-cut bounce at the bottom of the Megaphone pattern and just above the 1W MA50 (red trend-line). This mobilizes the 1W MA levels to come into focus and justifies a short-term (at least) buy towards 2.5000 (top of Megaphone and expected contact with the 1W MA100 (yellow trend-line)).
-------------------------------------------------------------------------------
** Please LIKE 👍, FOLLOW ✅, SHARE 🙌 and COMMENT ✍ if you enjoy this idea! Also share your ideas and charts in the comments section below! This is best way to keep it relevant, support us, keep the content here free and allow the idea to reach as many people as possible. **
-------------------------------------------------------------------------------
💸💸💸💸💸💸
👇 👇 👇 👇 👇 👇

RUNE/USDT Scalp Chart AnalysisCRYPTOCAP:RUNE Technical Analysis
#RUNE is attempting to break past key resistance at $1.70
If this level is cleared, we could see a move towards $2 next
But rejection here would put $1.60 back to the test
Always wait for confirmation before entering any trades!
Let me know your thoughts on #RUNE below.
But remember to trade responsibly, have a plan, and never gamble with money you can't afford to lose. Patience and discipline are keys.

RUNEUSDTBINANCE:RUNEUSDT
I missed the entry point for the short position, but it is possible for the price to return to that point
⚠️Note:
In this type of signals, only the entry point and trade direction are specified, and stop loss and target are not determined.
If you are interested in entering these signals, please provide a stop loss and a logical market-based target.
⛔"Daily crypto market analyses I provide are personal opinions & not financial advice. Trading carries risks, so do your own research & seek advisor's help.#DYOR"
Don't forget to like and comment

RUNEUSDTThis is a 1D frame analysis for RUNEUSDT Analysis of the crypto market: After breaking the resistance line which is currently playing the role of a support line, the price has been able to experience a good rise and slightly move above the resistance line, however it was unable to sustain above it and take a corrective price action. Currently, if the price is unable to hold above the support line and fully consolidate below it, we can expect a pullback to the second support line. But if it is able to hold above the support line after the collision and show signs of market reversal, we can be with the price at the resistance line. Suggestion: If friends who have still bought this currency and are in loss, wait for the price to consolidate above the first support line and buy again on the support zone and take profit on the resistance zone so that they can reduce their loss or exit the trade with profit.

RUNE/USD - Great Run, Now PullbackRUNE had a great run after its lending mechanism went live.
However, the price has hit a major resistance at $2.2 and it's unlikely the price will push higher at this time.
Momentum indicators are also turning a bit bearish after such a rally. So expect a pullback.
The area at $1.3 looks interesting for buyers.
Bias a bit bearish in the short term.
Like and follow for more updates!

RUNE EMA's crossing upThe RUNE EMA's have crossed to the upside indicating that this crypto could be reversing its trend from down to up. If this is the case, it will have more upside left.
While it has moved quite a bit, the strength it has shown during this last crypto down move is encouraging. RSI is also showing strength and we have a nice slope up on MACD.
There is no telling if we will get a pullback or not, but for a longer-term hold, rune looks promising.

RUNE/USDT Crucial Moment. Continue Upward or Broke the Support ?💎 RUNE is on our radar due to its significant movements. Currently, it's hovering in a pivotal zone that previously acted as daily resistance but now serves as support. At present, RUNE is in a retesting phase, with the candlestick patterns indicating several bullish rejections.
💎 This suggests that RUNE might be gearing up for an upward trajectory, possibly targeting the Bearish OB zone. Additionally, there's an FVG Area that RUNE might interact with.
💎 However, if RUNE struggles to maintain its position above this support and breaks below, there's a chance it could descend to the demand zone. Here, it might either exhibit a rejection or initiate a new upward leg. If it continues its downward trend, it might even reach the Strong Demand area.

RUNEUSD Rally far from over.RUNEUSD is trading inside a Channel Up, which after the Golden Cross on the (1d) time frame, is supported firmly by the MA50 (1d).
It has already crossed above Falling Resistance (1) of the Bear Cycle and only one remais (Falling Resistance 2) but of course will take time.
The final barrier before that test is Resistance (1) at 3.1500.
Trading Plan:
1. Buy on the current market price and as long as the MA50 (1d) supports.
Targets:
1. 3.1500 (Resistance 1).
Tips:
1. The RSI (1d) has diverged from the typical drop straight to 30.00 after being overbought above 70.00. This consolidation is a formation seen during impressive past rallies for RUNE.
Please like, follow and comment!!

RUNE on the way to 2.5 as plan!2h time frame
According to our previous analysis about RUNE, this Cup and Handle is doing well so far.
Here is the best timing to set protective stop to avoid unrealized profit gone.
Adjust SL from 1.414 to 1.95
Previous post as below.

RUNEUSDT - Buy SetupRUNEUSDT (1D Chart) Technical analysis
RUNEUSDT (1D Chart) Currently trading at $1.959
Buy level: Above $1.95
Stop loss: Below $1.55
TP1: $2.2
TP2: $3
TP3: $4
TP4: $5
Max Leverage 2x
Always keep Stop loss
Follow Our Tradingview Account for More Technical Analysis Updates, | Like, Share and Comment Your thoughts

RUNEUSD Close to making a new 12 month High!THORChain / RUNEUSD is testing yet again Resistance A (1.97500), after after 3 failed attempts to cross over it in the past 6 weeks.
That would favor a bearish move if at the same time the 1week MA50 didn't hold being the Support.
If it closes the week over Resistance A, it will the signal to buy and target 3.5000 (1week MA200). That will be inside the 0.5-0.382 Fibonacci range, a hot zone for the market as it was the long term Support turned to Resistance during the Bear Market.
Expect consolidation inside this range and then another run to 5.000 as the 1week MACD is marginally over the 0 mark, meaning that there is still considerable upside to it.
Follow us, like the idea and leave a comment below!!

RUNE Cup and Handle target 2.52h time frame
-
RUNE is creating a potential cup and handle srtucture, also in the phase of continuation structure, which pumping wave is 0.905 ~ 2.028. Critical resistance is obvious at 1.973, if RUNE can break above it then we can have higher target based on the cup and handle structure.
TP: 2.493~2.665
SL: 1.414

Triangle Breakout Signals Bullish Momentum for RUNEUSDT💎 Since its low in June, #RUNEUSDT has demonstrated impressive strength, boasting a remarkable 140% price surge. This performance places it among the top performers in recent times. Notably, the price journey broke free from a descending channel, catapulting from $1 to the psychological resistance at $2.
💎 Following this substantial upward move, a consolidation phase ensued. During this period, #RUNE established robust support at $1.385, corresponding to the 38.2% Fibonacci retracement level. Within the confines of this consolidation, a triangle pattern took shape. Recently, #RUNE decisively breached the upper boundary of this triangle, signaling a robust bullish sentiment.
💎 Simultaneously, the breakout extended beyond the confines of the previous descending channel. This demonstrated a compelling surge in buying pressure. As a result, it's reasonable to assume that the overall trend remains bullish. According to Elliott Wave theory, there appears to be potential for at least one more upward wave.
💎 Evaluating the factors at play, including the strength of the preceding uptrend, the presence of trendline resistance, and the 161.8% Fibonacci retracement level, we can anticipate #RUNE's next move. There is a high probability of #RUNEUSDT aiming for the $2.434 resistance area in the near future.
💎 Nevertheless, Paradisers, it's essential to remain prepared for potential range-trading and even short-term pullbacks before the uptrend fully resumes. Given the recent pace of growth, any uptrend resumption is likely to be relatively swift.

#RUNE/USDT 1D (ByBit) Descending trendline fakeoutTHOR Chain is about to print an evening star deviation and RSI looks overbought, seems likely to retrace down to 200MA support.
⚡️⚡️ #RUNE/USDT ⚡️⚡️
Exchanges: ByBit USDT
Signal Type: Regular (Short)
Leverage: Isolated (3.2X)
Amount: 5.0%
Current Price:
1.649
Entry Targets:
1) 1.727
Take-Profit Targets:
1) 1.292
Stop Targets:
1) 1.945
Published By: @Zblaba
CRYPTOCAP:RUNE #RUNEUSDT #ThorChain #DeFi
Risk/Reward= 1:2
Expected Profit= +80.6%
Possible Loss= -40.4%
Estimated Gaintime= 4-6 weeks
thorchain.org

RUNE SHORTBINANCE:RUNEUSDT SHORT. Rejected by range highs again. There’s also a bearish divergence on 4h. Shorting range highs has worked out for me 4 times in the last 2 weeks. Let’s see if i’ll get lucky again!

RUNEUSD This Bull Flag can take it to 3.1500 by end of the yearWe last looked into THORChain (RUNEUSD) 3 weeks ago (see chart below) when we called for a pause of the enormous uptrend within the Resistance Zone:
As expected, the price got rejected on the 1.9750 Resistance and pulled-back to the 0.382 Fibonacci retracement level. Needless to say that after breaking above the Falling Wedge pattern, as well as the 1W MA50 (red trend-line), the cryptocurrency has entered a new long-term bullish trend. The very same 1W MA50 has turned into a Support and held twice already (August 18, 16), while the 1D MA50 (blue trend-line) is crossing today above the 1D MA200 (orange trend-line), forming a Golden Cross.
Now the last 1D Golden Cross (February 17) had a bearish outcome but at the time not only was the price below the 1W MA50 but also the 1D MACD failed to form a Bullish Cross. As a result, it the 1D MACD forms the Bullish Cross (which is in course of completing in 2 days), we expect the current consolidation to be just a Bull Flag pattern that will break this time above 1.9750 (Resistance 1) that has been holding since February 02. Our long-term target is 3.1500 (Resistance 2) on the long-term, which is the August 11 2022 High.
-------------------------------------------------------------------------------
** Please LIKE 👍, FOLLOW ✅, SHARE 🙌 and COMMENT ✍ if you enjoy this idea! Also share your ideas and charts in the comments section below! **
-------------------------------------------------------------------------------
💸💸💸💸💸💸
👇 👇 👇 👇 👇 👇

RUNE ANALYSIS (1D)The upward movement we had was for a diametric of the daily degree. Considering the resistance that is in the way of the price and the diametric channeling, it seems that this upward movement is over. We expect downward movements at least to the green zone from RUNE.

THORChain (RUNE) formed Gartley for upto 21.50% pumpHi dear friends, hope you are well and welcome to the new trade setup of THORChain (RUNE) with US Dollar pair.
Previously we I shared a long-term trade setup which produced almost 340% pump as below:
Now on a daily time frame, RUNE has formed a bullish Gartley move for the next pump.
Note: Above idea is for educational purpose only. It is advised to diversify and strictly follow the stop loss, and don't get stuck with trade.

RUNE/USDT is Ready For a Potential Correction | RUNE Analysis💎Paradisers, turn your attention to RUNE/USDT. Currently, it's meandering within a falling channel, and we're on high alert for a possible downward breakout in the near future.
💎If this breakout unfolds as we expect, prepare for a swift corrective movement.
💎It's important to highlight the two verified order blocks in the shorter time frame. These zones are probable targets for the THORChain (RUNE), considering the liquidity present there.
💎Reflecting on past trends, we saw a transition from a demand to a supply zone, resulting in a significant price drop and targeting the previous Order Block (OB).
💎In the ever-evolving landscape of crypto, staying vigilant and flexible is essential. Keep those charts refreshed and stay tuned for more updates! 🌴

RUNE Pullback to the upward trend lineRUNE Pullback to the upward trend line
It can be a good condition for a long position
It can be confirmed with a candle that it took a long time.
Good luck and profitable

RUNE: Breakout after BreakoutHello friends!
Few days ago I've put BINANCE:RUNEUSDT on my list cause I've seen it to be close to the breakout of the new short-term resistance formed on 1h TF. Interestingly enough, it had just broke out of the long going resistance level two weeks ago, went through the point of BoS (Breaking of structure) (by creating the new higher high after the one that has been under that previous resistance at 1.969) and by this moment it is creating the new Higher Low.
Again, interestingly enough, while forming the new lower low it is creating the new zone of interest by creating this new resistance I was talking about and actually breaking through it. At this particular moment, the breakout isn't yet totally confirmed cause it hasn't gone through the new BoS, but this point might be this new higher low.
So:
If you are risky enough, consider the Entry 1 Zone with the Stop Loss below the previous Low. In case if the Higher Low isn't yet catched, the price can go to the zone of $1.2-1. Consider re-entering at that point.
If you don't like the risk - wait until the break of structure will be confirmed and consider Entry 2.
First Targets will be within the fulfilling of the wick that led us to the previous BoS. Fulfilling it strongly will most probably lead RUNE to the next zone: $2.9-3.1

"rune" new trendit seems rune has started a new upward trend which i have no interest to explain about it anymore :))))))))
i think pullback is almost completed and buying "rune" is a good idea.
