Mr. Rusell (Small Cap index) & Altseason go hand in hand. That's right it does.
Why?
Because small businesses employ nearly half of the workforce of the United States.
So when financial conditions exist for confidence to grow at this level of the economy expressed via hiring and expansion of said businesses the ripple effects are huge.
Which can be seen during Altcoin boom's (banana zones)
This cycle especially as one whole Bitcoin is out of reach for the common man. When Retail hot money does return to crypto expect small cap low numerical valued coins to really start outperforming BTC
RUSSELL 2000

RUSSELL: Short term consolidation before ATH test.Russell is technically neutral on its 1D outlook (RSI = 55.323, MACD = 20.400, ADX = 20.042) as for the whole month of May it is trading sideways inside the 1D MA50 and 1D MA200. April's bottom and the subsequent RSI DB rebound, is very much like the October 27th 2023 bottom. The rebound that was followed, also had the index consolidate between the 1D MA50 and 1D MA200 and soon after it resumed the uptrend to cross above the R1 level (prior High) before pulling back to the 1D MA50 again. Based on that we remain bullish on Russell, aiming for the R1 (TP = 2,470).
## If you like our free content follow our profile to get more daily ideas. ##
## Comments and likes are greatly appreciated. ##

Could the Fiber reverse from here?The price is rising towards the pivot, which lines up with the 127.2% Fibonacci extension and could reverse to the 1st support.
Pivot: 1.1690
1st Support: 1.1058
1st Resistance: 1.1910
Risk Warning:
Trading Forex and CFDs carries a high level of risk to your capital and you should only trade with money you can afford to lose. Trading Forex and CFDs may not be suitable for all investors, so please ensure that you fully understand the risks involved and seek independent advice if necessary.
Disclaimer:
The above opinions given constitute general market commentary, and do not constitute the opinion or advice of IC Markets or any form of personal or investment advice.
Any opinions, news, research, analyses, prices, other information, or links to third-party sites contained on this website are provided on an "as-is" basis, are intended only to be informative, is not an advice nor a recommendation, nor research, or a record of our trading prices, or an offer of, or solicitation for a transaction in any financial instrument and thus should not be treated as such. The information provided does not involve any specific investment objectives, financial situation and needs of any specific person who may receive it. Please be aware, that past performance is not a reliable indicator of future performance and/or results. Past Performance or Forward-looking scenarios based upon the reasonable beliefs of the third-party provider are not a guarantee of future performance. Actual results may differ materially from those anticipated in forward-looking or past performance statements. IC Markets makes no representation or warranty and assumes no liability as to the accuracy or completeness of the information provided, nor any loss arising from any investment based on a recommendation, forecast or any information supplied by any third-party.

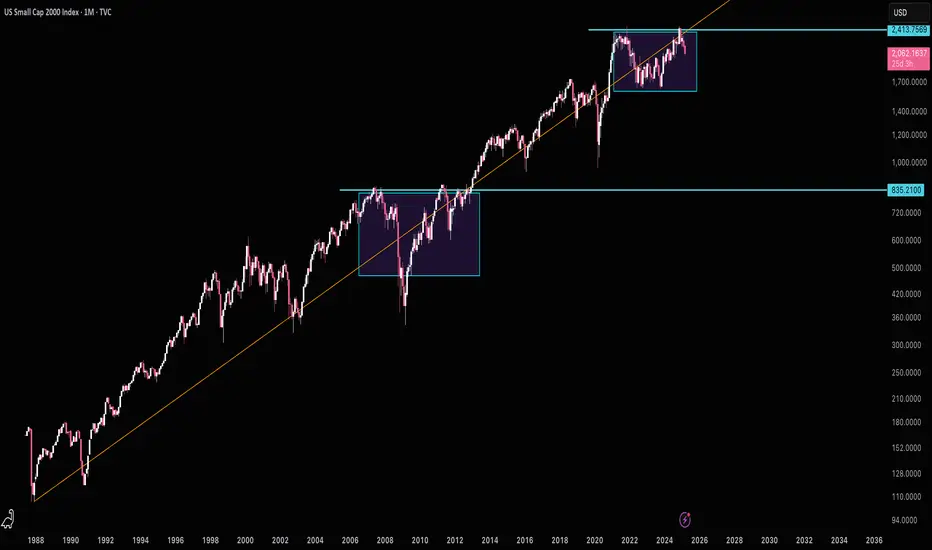
RUSSELL 15-year Cyclical pattern calls for enormous growth.Russell 2000 (RUT) made a massive rebound on last month's candle on the 1M MA100 (green trend-line), closing above it and maintaining the long-term price action above this Support since the March 2020 COVID crash.
Practically that was the only time the 1M MA100 broke since the October 11 recovery, which was the start of a 15-year Cyclical Pattern that initiates Bull Cycles after 1M MA50 (blue trend-line) ad then 1M MA100 rebounds that peak on the 2.0 Fibonacci extension.
Last month's rebound sets the stage for a post-COVID type recovery, especially if the Fed cuts the Interest Rates on their next meeting. The 2.0 Fibonacci extension is a little bit over 3500, which is our long-term Target.
-------------------------------------------------------------------------------
** Please LIKE 👍, FOLLOW ✅, SHARE 🙌 and COMMENT ✍ if you enjoy this idea! Also share your ideas and charts in the comments section below! This is best way to keep it relevant, support us, keep the content here free and allow the idea to reach as many people as possible. **
-------------------------------------------------------------------------------
💸💸💸💸💸💸
👇 👇 👇 👇 👇 👇

3/21 Gap Fill Bullish BounceUS indices are poised to fill downside gaps from Friday's close. Could be good for a bounce w/ upside cash gap targets higher.

Russell 2k looks very good, even with rising YieldDaily
The TVC:RUT looks okay, slowly grinding higher.
Spreading the chart out, it's still forming the, usually bullish, Inverse Head & Shoulder pattern.
Had this on a daily & weekly but the chart we see here is for the monthly (see profile for more info on where to get more data)
it is easier to see the pattern on the Weekly chart. Interesting.
However, we see something interesting on a monthly.
Monthly it looks similar to 2008 to 2010
AMEX:IWM

Russell 2000 Elliott Wave Analysis (WXYXZ in progress)Possible wave (ii) complex correction in the form of a WXYXZ still in progress.
Expecting corrective rally to fail around the 2200 resistance zone.
A final wave down from there should find a bottom around the 1900 support zone where wave (ii) should end.
Expecting wave (iii) to commence from there...
------
*would appreciate feedbacks and thoughts on this*
**this is not a trade recommendation, just an idea that I am working with**

This RUT/NDX ratio may convince you to buy NASDAQ aggressively.Nasdaq (NDX) has been under heavy selling pressure in the past 30 days. This short-term pull-back however is nothing but a buy opportunity on the long-term, and this study shows you why.
The answer lies on the RUT/NDX ratio which shows that this may be the time to get heavier on tech. The use of the Russell 2000 index (RUT) is due to the fact it represents a wider array of companies. Naturally over the years (this 1M chart shows data since 2006), the ratio declines within a Channel Down as historically the riskier tech sector attracts more capital and grows more.
However there are instances where Russell gains more against Nasdaq. We are currently though at a time where this isn't the case as the ratio seems to be ready for decline following the completion of a consolidation that on previous fractals (March 2015, September 2008) was bearish, thus positive for Nasdaq.
As you can see, this movements can be grasped by the Sine Waves, though not perfectly, but still good enough to understand the cyclical pattern we're in, also with the help of the 1M RSI Triangles.
Nasdaq (which is represented by the blue trend-line) has started massive expansion Channel Up patterns following this unique signal given by the RUT/NDX ratio. The first was right after the 2009 Housing Crisis bottom and the second during the 2015/ 2016 E.U., VW and Oil crisis.
The key here is on the 1M RSI. The Triangle is about to beak to the upside and every time this happened in the last 20 years, it coincided with a pull-back on Nasdaq (blue circle) similar to the current one. What followed was massive rallies each time.
As a result, this could be an indication that even though the tariffs have rattles investor confidence lately, this is an opportunity for a strong buy position for at least the rest of the year.
-------------------------------------------------------------------------------
** Please LIKE 👍, FOLLOW ✅, SHARE 🙌 and COMMENT ✍ if you enjoy this idea! Also share your ideas and charts in the comments section below! This is best way to keep it relevant, support us, keep the content here free and allow the idea to reach as many people as possible. **
-------------------------------------------------------------------------------
💸💸💸💸💸💸
👇 👇 👇 👇 👇 👇

Gold takes Adv. since Trump-a-rally pans out to Bulls fartIt's gone 2 weeks or so, since Mr. Trump has secured a win over his Democrat-rival Kamala Harris in the 2024 U.S. presidential election, as it declared by the Associated Press.
Since that, a lot of stocks soared in a meme-style mode, while Bitcoin clears $93,000 and Dogecoin soared amid Trump-fueled crypto rally.
Among nearly 2000 components of Smallcap Russell 2000 Index TVC:RUT , appr. 90 percent of them (without any fundamental reasons) were up on November 6 - at the day Trump clinched White House victory.
For S&P 500 SP:SPX and Nasdaq-100 NASDAQ:NDX indices these numbers were 70 and 75 percent respectively.
Since US dollar interest rates are still near multi year highs and Powell still says the Fed is in no hurry to cut interest rates.. all of that means Trump-a-rally gives no light for super-duper bets, as it's been discussed in earlier posted ideas.
Moreover, Geopolitics is roaring back, as current U.S. President Joe Biden tries to authorize the yellow-blues to use powerful long-range American-made weapons inside Russia's legal areas, potentially inside Kursk region where located The Kursk Nuclear Power Plant, that is one of the three biggest nuclear power plants (NPPs) in Russia and one of the four biggest electricity producers in the country.
The main graph is for Gold spot OANDA:XAUUSD , and it indicates on Cup with Handle technical structure in development as Gold takes Adv. since Trump-a-rally pans out to Bulls fart.

Russel 2000 Compared to General MarketTVC:RUT has continued to sell off since my last couple posts and I believe we could see a huge market correction this year if price doesn't look to stop selling.
The next play on RUT I would like to see price pullback to the last breakout zone ($2,200) to confirm a continuation in trend
This play also looks very familiar to the 2022 selloff with equal highs to our current price structure. Seeing that AMEX:SPY is at a higher high tells me there is market-wide divergence and a topping pattern could be in play.
Now when we add CRYPTOCAP:BTC and $OTHER to the mix we can see bitcoin actually tops out first while Alts and SPX look to make one more leg up before crashing out.
The Trend Reader at the lower tab has topped out and has a bearish crossing in the overbought zone indicating we can see a long term play to the downside.

RUT - Russle signals a drop to 1900ishThe white Pitchfork was guiding us to the Center-Line. As so often, price is turning at this level, just to reach the opposite side.
It's the same game every time.
Just follow the rules, apply a good risk and money management.
The down-sloping red Fork projects the current most probably path of price to the downside. And of course our profit target, which is the red Center-Line.
The signal is the break, the close below the shelf, the tiny support, marked by the petrol horizontal line.
Trade wisely, trade without attaching your emotions. It just is what it is, whatever the outcome will be. Knowing this, you can embrace inner freedom in trading.

RUSSELL: Targeting at least 3,000 end of yearRussell 200 may be almost neutral on its 1D technical outlook (RSI = 34.476, MACD = -14.090, ADX = 24.893) but still neutral on 1W as the 1W MA50 continues to hold since November 2023. The price action is exactly around the middle of the 16 year Channel Up and since the September 2022 low, we've been on the new Bull Cycle / bullish wave. The Cycles are repetitive and so far in these 16 years we've had another three similar phases of growth. The 1W RSI indicates that the current will top near the end of 2025. All prior have reached at least the 2.0 Fibonacci extension but since the pace of the current Bull Cycle has slowed down, a TP = 3,000 will be much more suited as the target of this Cycle.
## If you like our free content follow our profile to get more daily ideas. ##
## Comments and likes are greatly appreciated. ##

RUSSELL 15-year Cycles holding perfectlyIt has been 6 months ago (August 15, see chart below) when we updated our long-term call on Russell 2000 (RUT) based on a 15-year Cyclical pattern:
As you can see, since we introduced this long-term commitment on Russell back on October 07 2023, the index made a remarkable recovery and now the final step is to break above the previous All Time High (ATH) and turn it into the long-term Support.
That is what happened on all 3 of its previous Cycles (only broken temporarily during the COVID flash crash). As long as the 1M MA50 (blue trend-line) holds, we expect the pattern to hold once more and fulfil the 2.0 Fibonacci extension condition as the near Cycle Top. Our long-term Target remains 3500.
-------------------------------------------------------------------------------
** Please LIKE 👍, FOLLOW ✅, SHARE 🙌 and COMMENT ✍ if you enjoy this idea! Also share your ideas and charts in the comments section below! This is best way to keep it relevant, support us, keep the content here free and allow the idea to reach as many people as possible. **
-------------------------------------------------------------------------------
💸💸💸💸💸💸
👇 👇 👇 👇 👇 👇

Mixed Signals. Is Inflation ramping up?As hot data comes with CPI and PPI, the Treasury Yields and DXY have come down somewhat sharply.

RUT global planThe Russell 2000 Index is a small-cap U.S. stock market index that makes up the smallest 2,000
Possible Targets and explanation idea
➡️Global weekly chart RUT. We are in a middle.
➡️Summer 2022 we got signal to buy.
➡️Market mood we are in a depression zone
➡️Direction indicator (whales accumulate, even on covid dump we didn't see this signal)
➡️Take profit line marked + buy line (but I think we will see take profit first)
Hope you enjoyed the content I created, You can support with your likes and comments this idea so more people can watch!
✅Disclaimer: Please be aware of the risks involved in trading. This idea was made for educational purposes only not for financial Investment Purposes.
---
• Look at my ideas about interesting altcoins in the related section down below ↓
• For more ideas please hit "Like" and "Follow"!

RUSSELL 2000 One last Resistance remains before mega rally.Russell 2000 (RUT) gave us an excellent buy signal on our last analysis (October 22 2024, see chart below) exactly on the 1D MA50 and within 5 weeks it hit our 2465 Target:
The price almost immediately pulled back, showing the efficiency of our Target placement and the pattern that has now prevailed is the Channel Up that started more than a year ago (October 27 2023).
The recent Higher Low of this pattern was exactly on the 1D MA200 (orange trend-line), the pattern's bottom. The 1D RSI showcased a Bullish Divergence (Higher Lows) against the price's Lower Lows as an early buy signal, which was confirmed on the January 14 2024 1D MACD Bullish Cross. As you can see, all Bullish Crosses below a 0.0 MACD, have been technical buy signals.
What remains is for the price to break above the 1D MA50 (blue trend-line), which is the level that is causing a rejection today. Once recovered, we expect the index to complete at least a +21% rally from the recent bottom, the minimum of the previous 3 rallies, and target 2600.
-------------------------------------------------------------------------------
** Please LIKE 👍, FOLLOW ✅, SHARE 🙌 and COMMENT ✍ if you enjoy this idea! Also share your ideas and charts in the comments section below! This is best way to keep it relevant, support us, keep the content here free and allow the idea to reach as many people as possible. **
-------------------------------------------------------------------------------
💸💸💸💸💸💸
👇 👇 👇 👇 👇 👇

RUSSELL 2000 ACCURATE TREND CAUGHTRUSSELL 2000!
So much happened in the last 2 weeks! And we were able to catch most of the profits that it offered!
Started off with a good SHORT position giving us around 50 points (2%+)
Following with a bullish reversal with 55 open P&L so far!
Applied on 15 minute time frame using Risological Options Trading Indicator.

RUT - Russel is in a similar "Dump" patternIn 2021 we saw the Russel creating this Dump Pattern:
1. Sideways
2. Break the high
3. Dump
Watch how it looks now.
To me it's very, very similar.
Any other confirming signals?
Yes!
Price reached the white Center-Line and started to go south.
Here's my game plan:
If the weekly TB is broken on a close, and an Open is below the TB afterwards, I'm looking for a short entry.
PTG1 is at the red Center-Line and a runner with a definite PTG2 at the green support line.
My weapons will be the Options, not the Futures. It gives me much more leeway and freedom of flexibility.

Russell 2000, on a 15-minute timeframe, delivered a perfect shorRussell 2000 SHORT Trade:
Russell 2000, on a 15-minute timeframe, delivered a perfect short trade using the Risological Swing Trader, achieving all targets in a seamless bearish move.
The trade unfolded with precision, as the Risological Swing Trader pinpointed the entry and accurately mapped the downward trajectory. Each target was hit with remarkable accuracy, reflecting the tool's power in identifying high-probability trades.
Enjoy and have a great weekend!

Russell 2000 Small Caps (IWM) Breakout cup and handle on RUTRussell 2000 Small Caps TVC:RUT and AMEX:IWM on the Cusp of a Breakout?
The Russell 2000 small-cap index, tracked by the iShares Russell 2000 ETF (IWM), is forming a cup and handle pattern. This technical formation could be indicative of a significant breakout.
Key Levels to Watch:
Resistance: $230-$232
Support: $220-$222
A decisive close above $234 confirmed the breakout, potentially leading to further upside. Conversely, a failure to hold above $220 could negate the pattern.
Keep a close eye on IWM as it navigates this critical juncture.

Presidential cycle. Will the crossing of RUT and SPX be repeatedDuring the Presidential Cycle is possible to verify that both indexes make peaks and troughs by the same time with similar moves.
By early 2016, the indexes followed the same movement by roughly three months, after that SP500 and Russell2000 made a new high just before the elections.
The prices continues to rise until the pandemic.
By early March 2020, SPX crosses above RTU and it was above until a little before Biden election, thereafter RUT crossed again making a new high two months later SP500 also made a new high.
By early January 2024, SPX crossed definitely RUT with SPX already making a new high.
So following the history after the elections is time to RUT to cross above the SPX line as well as to reach another higher high(??)

Direxion Small Cap Bull 3x | TNA | Long in the $30sMarkets are forward looking. When the Federal Reserve drops interest rates (perhaps in 2024?), I anticipate money to flow into the heavily beat-down small-cap market (filled with stocks most negatively impacted by high interest rates). TVC:RUT would rise rapidly, and my bet is on AMEX:TNA to follow.
From a technical analysis perspective, the fact there is a gap to close for AMEX:TNA in the low $90s is enticing. It may be a bumpy or speedy rise there, but the $30's have been a personal buy zone.
Target #1 = $54.00
Target #2 = $92.00

RUSSELL Rally doesn't seem to seek correction any time soon.Russell 2000 is overbought on its 1D technical outlook (RSI = 73.532, MACD = 34.900, ADX = 27.532) as the monthly candle is already as high as any in the last 12 months, despite being only on the 1st week. This bullish trend can keep going as this is the bullish wave of the long term Channel Up that started in March 2009 (housing bubble). We are already past a 1M MACD Bullish Cross and all 4 major bullish waves before had such a Cross to show. The minimum rise they gave was +81.48% and this is our target (TP = 3,000) until the end of 2025.
## If you like our free content follow our profile to get more daily ideas. ##
## Comments and likes are greatly appreciated. ##
