The Sandbox (SAND) forming bullish Shark| A good buy opportunityHi friends, hope you are well and welcome to the new trade setup of The Sandbox (SAND) with US Dollar pair.
Previously I shared a long-term trade setup for SAND, which is still in play.
Now on a 4-hr time frame, SAND is completing the final leg of a bullish Shark pattern.
Note: Above idea is for educational purpose only. It is advised to diversify and strictly follow the stop loss, and don't get stuck with trade
Sandusdt

🔥🚀BINANCE INVEST IN NFT: BRIGHT FUTURE FOR SAND AND CO.?🔥 Hi friends! NFT have a great future, Binance is investing in the industry, Binance CEO CZ⚡️ said. CZ made this statement during his AMA. This is a green light for the NFT projects such as SANDBOX.
I will publish the list of NFT altcoins ant the end, but now more details about SAND technical situation.
Now the price consolidate inside the HUGE accumulation area of $0.5-0.6 where the whales buy a lot of coins. Take a loof on volume indicator. 4 huge candle spikes! This is a bullish sign for this altcoin.
📊 THE PRECONDITIONS TO OPEN A LONG ON SANDBOX:
1. breakout and test the trendline as the support
2. huge volume to buy on SAND. I use DOM and Footrpint to see the real whales oders to buy or sell, so this will not be a huge problem
3. bullish BTC
✅ THE 3 TARGETS FOR SANDBOX:
🔥 $0.64 - key level and local high
🔥 $0.69 - important mirror level
🔥 $0.76-0.8 - value area
🚩 I make the list of NFT or related to NFT projects on Binance for you: APE , FLOW , XTZ , SAND , CHZ , THETA , AXS , MANA , CAKE , IMX , SUSHI , STEPN, GALA , TLM , BSW , DAR. Traders, take a more detailed look at these altcoins.
💻Friends, press the "boost"🚀 button, write comments and share with your friends - it will be the best THANK YOU.
P.S. Personally, I open an entry if the price shows it according to my strategy.
Always do your analysis before making a trade.

SAND LONGS SET UPBullish bias on SANDUSD
- adapting to bullish fundamentals in crypto market due to the recent cpi data release and fed pivot
- bull flag market structure form on the 4hr timeframe.
- Price showing rejections at key support on the very high timeframe
Trade safe and enter upon confirmations like a break and retest of market structure

TradetoProspa - #SAND, looking to shortHi traders,
#SAND #crypto #SANDBOX
I give a macro overview and what I think is a good shorting opportunity.
All the best,
S.SAri

Crypto SAND SANDUSDTView on Crypto SAND SANDUSDT (5 Sept 2022)
SAND is in the range bound play recently and we are some value in the long term perspective.
For the near term, I'd say it shall retest the recent resistant of 1.35~1.40 region.
DYODD, all the best and read the disclaimer too.
Feel Free to "Follow", press "LIKE" "Comment".
Thank You!
Legal Risk Disclosure:
Trading foreign exchange or CFD on margin carries a high level of risk, and may not be suitable for all investors.
The high degree of leverage can work against you as well as for you. Before deciding to trade foreign exchange you should carefully consider your investment objectives, level of experience and risk appetite.
The possibility exists that you could sustain a loss of some or all of your initial investment and therefore you should not invest money that you cannot afford to lose.
You should be aware of all the risks associated with foreign exchange trading, and seek advice from an independent financial advisor.
DISCLAIMER:
Any opinions, news, research, analyses, prices or other information discussed in this presentation or linked to from this presentation are provided as general market commentary and do not constitute investment advice.
Sonicr Mastery Team does not accept liability for any loss or damage, including without limitation to, any loss of profit, which may arise directly or indirectly from use of or reliance on such information.

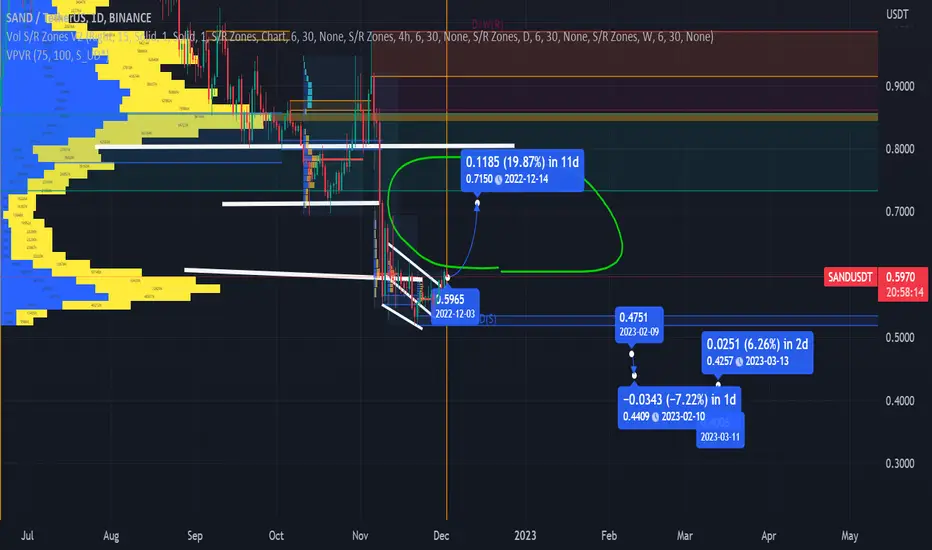
SANDUSDT analysis buy signal 12/3/2022we will stick to our yellow BC buying area after formation of III yellow sequence RR :3:1 talking in consideration that the market can take the bearish green target as point of starting bullish sequence

SANDUSDT.P trade idea - 4H Ichimoku levelsHere we trade SANDUSDT using 4H Ichimoku levels/zones.
What do we see?
- price made a higher high
- RSI appears to remain bullish (higher high)
It further looks like we did not yet reach our take profit area. We might therefore expect a higher push, towards zone 1.
For our entry, we identified what looks like a gap in the 4H Ichimku conversion line (Tenkan sen, bleu line). Indicated by the arrows left on the chart. We draw a zone and yes, it looks like we did find support on that level. We enter for a long position with 25% of our budget, 1x leverage. Take profit on zone 1. Stop loss below the next support level underneath our zone.
Remember: this is just an idea, NOT financial advice. Please do NOT take this trade, as it may run into a loss. Only take trades that fit YOUR plan and/or risk tolerance. Happy trading!


SAND CAN GO UPPERHello, I hope you are doing well, dear traders
I think sandbox can reach higher levels. The main sell orders are not yet consumed, which are located in higher areas

mask target through blank space upon breakoutSand has broken out of the downward channel it was in. Although we still are not free to cross through the blank space yet........ i will link a more detailed chart
The Sandbox | Same As Polkadot (65%+ Potential Target)This is the second one of the two Altcoins, Polkadot (DOTUSDT) and The Sandbox (SANDUSDT).
The charts are very similar, almost identical.
For SANDUSDT, we do not have a bullish divergence on the RSI but the RSI is above 57, which is strong/bullish, even while a new low has been hit just days ago.
This is a strong bullish signal.
EMA21 is being challenged now as resistance while on the 30th of November SANDUSDT managed to break and stay above EMA10.
The law of alternation comes into play here when looking at the bottom pattern and the coming upwards correction.
The June/July low was V shapped, while this time it is rounded.
These signals can lead to higher prices.
The support level, light blue, can be used as the stop-loss.
The target is set above 65%.
Namaste.

SANDBOX ⌛🦜 Time for a Rebound 🏴☠️☠Time to look at Sandbox again as the price is breaking higher
0.59 is now solid support and we will remain Long (my stop loss at 0.584)
4 Main Targets to be hit:
0.788
1.006
1.435 and eventually even 1.711
NEWS:
For Playboy’s 69th birthday, the lifestyle brand, in collaboration with The Sandbox Metaverse, is releasing its first original NFT collection, The Playboy Party People. On December 2022, 1,969 NFT Avatars will launch on The Sandbox Metaverse. Let’s dive into the collection and the future utility of Playboy Party People.
Sounds like fun. Especially if Rate Hikes will be eased and we can jump back on the Metvarse fun.
One Love,
The FXPROFESSOR

Sand headed for top of channel5% gains ahead after that we may run down the same 5 and support then bounce again Nice channel trade


SAND USDT IDEA Hi,
I'm looking for sand move towards weekly gap.
I'm still waiting for market structure to get broken on Daily. When you're looking for weekly objectives always wait for daily structures to break.
GOOD opportunity!

This trend can remain bearish!SAND had a weak downtrend during the past week. After breaking the support range of $0.65-0.75, its price has hit more important support in the range of $0.48-0.54. Although the encounters were associated with a positive reaction, strong rebound power was not observed. Also, we are still in the descending channel and near the midline of this channel. So, according to the dynamic midline support, if the selling pressure increases again in the market, the possibility of breaking this support and falling to the range of 0.33 to 0.39 dollars will increase.
Also, strong support in the range of $0.197-$0.160 is considered for SANDBOX, which can hit this range momentarily and react positively if the strongest selling pressure is created. A downward trend is clearly observed in the 4-hour period. Therefore, until buyers attempt to break the resistance of $0.60 and test the resistance of $0.70, this trend can remain bearish.

SAND SHORT Term Expectation (19.11.22)Short attempts can be made in the red areas after the red falling trend break.
What I write here serves as a note to myself. Does not include investment advice.

SAND : NEW VOLUME VIEWSAND: NEW VOLUME VIEW
seems interesting for a low time frame.
There is a good chance for a breakout of Sand if the time frame gets confirmed.
Volume range activated

SAND/USDT sell short idea . Greetings from Team : Trading The Tides.
Lets discuss a short sell oportunity on (SAND)
Target area for initiating short :0.617
DCA Limits : ,0.65 , 0.67
TP : 0.565
SL : Not gonna end up with stop loss , its a risky trade use less margin and lev (2x max )
Hold Time : swing
Technical Chart Pattern: Descending triangle
Posible liquidity area : mentioned on chart
Rules :
We use big capital with less leverage .
Max leverage : 3x
Better take trades with 1x.
We only post the exact setup we are following for the trades .
But DYOR .
Not a Financial Advice !
From Team :
Trading The Tides
Like , Share ,Follow
Thanks a lot and see you soon on the next trade .

SANDBOX the last chance (bottom) and the range market 📖🚀Hello 🐋
Based on the chart, the price is close to the major support (bottom) or better to say the previous zone that started its amazing pump to the upside ✔️
we
expect to see gain besides the range market is acceptable scenario too 📖💡🚀
and
if the price break the rang area to the upside, we will see more gain 🚀
Please, feel free to share your point of view, write it in the comments below, thanks 🐋


SANDUSDT analysis buy setup 12/11/2022if market go with the scenario shown with the green area it will give strength to bulls to raise the market ICI sequence will be formed
