Commodity Markets can be Strengthened !I expect an increase in the USCI (US Commodity Index Fund) Index.
This could be a forerunner of the rise of commodity-based Stocks and Commodities.
It would be more accurate to turn to single commodities and stocks rather than this fund.
We'il talk about going from general to private later.
Nevertheless, let's write down the parameters that make this idea less risky:
Position Size : Small amount of Portfolio
Risk/Reward Ratio : 1/2.4
Stop-Loss : 35.48
Goal : 38.78
Recent status on my Commodity-related Terminals (Duration : Autonomous LSTM Adaptive Period):
-General :
-Futures :
Recent status Commodity-related Terminals ( Duration : 14 weeks ) :
- General :
- Futures :
Regards.
Search in ideas for "COMMODITY"

Commodity ETF Breakout! Long CommoditiesThis commodity index has broken multiple downtrends and is now taking out the horizontal resistance that goes back over 20 years! Explosive moves ahead. The MACD contains bullish divergence while the RSI hasn't been this high since 2011!

Commodity prices: Iron OreFrom mid-September until the end of October, Iron Ore appeared to have found a safe space above US $100. Now, after a steep decline beginning October 27, 2021, Iron Ore has started to test May 2020 lows, close to US $90 per metric tonne. The commodity is grating against predictions by ANZ Bank (ASX: ANZ) for it to “find a floor around current levels”.
Demand (or lack thereof) from China is what has driven the price of Iron Ore sub-100 dollars. Chinese authorities have ordered its steel manufacturers (large consumers of Iron Ore) to cut production to meet targets to reduce energy consumption and pollution across its provinces. China’s production restrictions are scheduled to last until mid-March 2022.
According to S&P Global, Iron Ore outlook is unfavourable, with “pricing risk is to the downside” as supply tends to increase in the latter half of the year.


Commodity Reaserch Bureau (CRB) IndexExpected increase in price of commodities for this year.
Remember that in this index, each asset has different a weight and includes 19 commodities. According to Investopedia:
39% allocated to energy contracts
41% to agriculture
7% to precious metals
13% to industrial metals
Related indices:
SPGSCI: S&P Goldman & Sachs Commodity Index
BCOM: Bloomberg Commodity Index

Commodity soybean idea (29/09/2022)soybean
We expect a decline in the soybean commodity in the coming period because trading is below the critical point of 1509. Currently, the continuation of the decline in wave ((iii)), which may reach prices 1373 or 1302 before rising again.


Commodity soybean idea (20/09/2022)soybean
We expect a drop in the soybean commodity in the coming period since trading is less than the crucial point 1509. Currently, we expect to complete the correction in wave ((ii)), which may reach prices of 1471 or 1480 before declining again.


COMMODITY DEFLATION HOLDS BOND YIELDS DOWNThe 10-year yield is sensitive to falling inflation. The 10 Year yield curve (2.22%) normally starts to rise at the start of a Fed tightening cycle as bond yields start to rise. Historically, the Fed has started raising rates to combat rising inflation. That isn't the case right now with the CRB Commodity Index trading at the lowest level in 14 years (ETF DB CRB solid area). The main reason for the drop in the 10-year yield curve is the monetary global easing.
It's true that the U.S. economy is starting to do better than most foreign markets which may justify a higher Treasury yield. Monetary easing in Europe and Japan, however, are keeping global yields at historically low levels. That's also keeping Treasury yields down. That's especially true in the eurozone with most bond yields in negative territory.

GS Commodity Index ChartLooking at the Goldman Sachs Commodity Index and how the prices went up dramatically from the Covid lockdown, i would say that there is still room for a final rally, before a major correction in 2024.
The chart is self-explanatory.
Looking forward to read your opinion about this.

Are Commodity Prices Going Up? Lumber, Cash Crops, And Iron OreSome interesting factors are currently affecting commodity prices. Supply chain bottlenecks, unpredictable demand from economies reopening, geo-political tensions, climate change policies are just a few examples.
I find it helpful to review the state of the commodities market periodically. In this article, we will examine Lumber, Cash Crops, and Iron Ore.
Commodity prices: Lumber
Lumber Mills have done their best to increase timber supply in 2021, with production hitting a 13-year high to meet the unpredicted demand from new house builds and renovations. After reaching a peak of over US $1,600 per thousand board feet in May this year, Chicago Lumber Futures have retraced to US ~$640 per thousand board feet as of early November. It could be said that the psychological level of US $600 is very supportive of this commodity. November 2021, and January and March 2022 Future prices are also trading above this level.
Speculation is rife that Lumber is due for another price run-up, with Sawmills cutting production to counter the gluttonous output earlier in the year. One indicator supporting this theory is Chicago Lumber Futures increasing by just-under ~40% since plateauing in August, at one point hitting US $820 in mid-October.
Commodity prices: Cash Crops
Corn and many other grain Futures are currently trading at premiums or multi-year highs, including Wheat and Oats. As of writing, Corn, Wheat, and Oats are trading at 555 USd/Bu, 781 USd/Bu, 716 USd/Bu, respectively.
Several factors have led to inflation in grain prices. For one, we can thank (or curse) the high cost of crude oil. Due to WTI and Brent trading US ~$80 per barrel, demand for ethanol has been pushed to the extreme. It is important to note, that in the US, Ethanol is produced predominantly by fermenting Corn (25% of the Corn grown in the US is used for ethanol production).
Kluis Commodity Advisors does not believe the prices of grains is sustainable, even in the short term. The Advisors go so far as to suggest that farmers should be hitting the sell button right now to make the most of the grain rally. Butting up against this prediction are forecasts for a continuation of unfavourably dry weather, which have already put the supply of Cash Crops, including Wheat and Oats, in a precarious position.
Commodity prices: Iron Ore
From mid-September until the end of October, Iron Ore appeared to have found a safe space above US $100. Now, after a steep decline beginning October 27, 2021, Iron Ore has started to test May 2020 lows, close to US $90 per metric tonne. The commodity is grating against predictions by ANZ Bank (ASX: ANZ) for it to “find a floor around current levels”.
Demand (or lack thereof) from China is what has driven the price of Iron Ore sub-100 dollars. Chinese authorities have ordered its steel manufacturers (large consumers of Iron Ore) to cut production to meet targets to reduce energy consumption and pollution across its provinces. China’s production restrictions are scheduled to last until mid-March 2022.
According to S&P Global, Iron Ore outlook is unfavourable, with “pricing risk is to the downside” as supply tends to increase in the latter half of the year.

Are we entering a commodity super-cycle?Definition of a commodity super-cycle:
Commodity super cycles are decade-long periods in which commodities trade above their long-term price trend.
Technical Analysis:
Using a weekly candlestick to see the bigger picture.
DBC is breaking out of a 10 year long downtrend.
On Balance Volume is supportive, as it is also breaking higher, reaching levels from a decade before.
We are breaking and testing $18.5, which is a very long-term resistance; now potentially turning into support.
This is a long-term setup.
R1, R2 and R3 are potential targets to take some profits.
Fundamental factors:
Weakening dollar
Supportive central banks
Fiscal stimulus geared for infrastructure spending
Pent-up demand once as global economies re-open.
Government and private companies increasingly pledging carbon reduction measures.
Inflation ticking higher, as the Fed is taking a new approach of waiting, rather than anticipating, as it has done in the past.

Commodities Uptrend Incoming? | CRB Commodity Index ($TRJEFFCRB)✨ Drop a comment asking for an update, we do NEW setups every day! ✨
Like, Comment & Follow to help the community grow 🎉🎉
---
Commodities have rallied into resistance. We are currently looking for a pullback to the last support range. To chart this we are looking at the Thomson Reuters/CoreCommodity CRB Commodity Index (TRJEFFCRB), which is an index comprised of 19 commodities: aluminum, cocoa, coffee, copper, corn, cotton, crude oil, gold, heating oil, Lean Hogs, live cattle, natural gas, nickel, orange juice, silver, soybeans, sugar, unleaded gas, and wheat.
For those who want to trade the price action, one could take a position with Commodities ETFs like Invesco DB Commodity Tracking (DBC) and First Trust Global Tactical Commodity Strat ETF (FTGC). With that said, we aren't trading this one, we are just looking at levels.
Although the trend is still bearish overall, it is interesting to see commodities trending up to resistance as money is being created by central banks. It is a longstanding economic theory that inflation should cause an increase in the price of commoidites, and that commodity price increases are a leading indicator of inflation.
While the correlation between commodities and money printing hasn't been noticeable in recent years, COVID-19 has changed things up a bit and it'll be interesting to see if old trends repeat or new trends emerge (consider things like recent meat processing issues increasing the cost of meat, and the recent temporary drop in the price of oil to zero).
Although the trend is currently bearish, we are only looking levels of interest. We see two relevant support levels, S1 and S2. S1 would be of particular interest if commodities were going to officially start trending up. If we do get more upside, R1 and R2 are both levels to watch. R2 specifically represents the bottom of the previous range before COVID, and seems like a logical target in an uptrend.
To sum it all up, tracking commodities can help us to make profitable trades, either on specific commodities or baskets of commodities via ETFs like the ones noted above, but it is also academically interesting.
Could a spike in commodities prices now signal coming inflation from an increase of the money supply? Should we be filling our freezer with OJ and beef to avoid higher prices in the near future? Or, should we just be looking for bullish continuation or bearish consolidation to help us find a nice setup on oil, coffee, and gold?
Resource: mises.org + www.investopedia.com

The Fed Signals Commodity TrendThe Fed signals that the commodity trend may be moving higher. In the latest FOMC meeting, the Fed lowered rates by a quarter point.
Contrary to the expectations of many analysts who anticipated more cuts in 2025, they signaled only two rate cuts next year, reflecting greater caution about the pace of further reductions in borrowing costs.
So, how is this being interpreted as an indication that the commodity trend may be moving higher?
Corn Futures & Options
Ticker: ZC
Minimum fluctuation:
1/4 of one cent (0.0025) per bushel = $12.50
Disclaimer:
• What presented here is not a recommendation, please consult your licensed broker.
• Our mission is to create lateral thinking skills for every investor and trader, knowing when to take a calculated risk with market uncertainty and a bolder risk when opportunity arises.
CME Real-time Market Data help identify trading set-ups in real-time and express my market views. If you have futures in your trading portfolio, you can check out on CME Group data plans available that suit your trading needs www.tradingview.com

ECONOMISTS agreeing on THIS COMMODITY🚀Hi Traders
Ev here. Been trading crypto since 2017 and later got into stocks. I have 3 board exams on financial markets and studied economics from a top tier university for a year.
Over the past few weeks I have heard many opinions on the commodity Copper and it's great upside potential. Some economists are even saying that Copper may outperform Gold this year.
So why Copper?
Copper is a precious metal that is often overlooked by investors, despite the fact that it’s one of the most useful and reliable minerals on Earth. Copper has distinctive value in the global market due to its industrial business enterprise worth. Not only is copper a low-risk investment, but it could also yield excellent value to investors. With the reopening of lockdowns, the Chinese government released new guidelines to accelerate clean energy growth, including the construction of major wind and solar farm projects. “The support from authorities should increase the odds that the renewable energy sector will continue to see strong growth and support the demand for metals such as copper and aluminum,” analysts at Dutch bank ING noted.
At the same time as traders are anticipating a rapid bounce in demand from China, protests in Peru have the potential to disrupt supply, while Chilean output has fallen. The Chilean Copper Commission (Cochilco) reported that state-owned mining firm Codelco produced 6.1% less copper year on year in April, with production down by 5.8% year to date. The copper market climbed to a five-week high recently as the prospect of tightening supply out of Latin America coincided with Shanghai’s reopening from Covid-19 lockdown. And now, by using technical indicators and analysis, it seems likely that the price might pullback after recent highs. This could be a great time to diversify and get exposure to this precious commodity.
What are your thoughts on this commodity?
_________________
👀 Follow us here on TradingView for daily updates and trade ideas on cryptocurrency, stocks and commodities 💎
👍Hit like & Follow 🔔
We thank you for your support !
CryptoCheck

COFFEE - My Commodity of ChoiceI've laid out a plan I'm looking at on one of my favorite commodities - COFFEE ☕😍
What makes it so hard is the predictability of the weather - nearly impossible for the future. However, it is odd to see that the price still bonces at key support and resistance zones, almost like any "stock". Which tells me regular market trading still applies despite the odd weather event.
The reason Coffee has fallen so hard over the past few months is supply - due to extremely favorable weather conditions, coffee supply is more than demand. Resulting, as market dynamics goes, in a drop of price.
It's unfortunate though that my favorite pack of beans at the supermarket has not gone down - weird how that works 🙄 I like a medium roast, Columbia single origin.
It's dropped -33% already, but I can clearly see the market structure entering bearish phase after the bullish phase, peak (the new high) and now likely a multi-month bearish season. The question is just where the price can bottom for such a well loved commodity.
I looked at past cycles, not too long ago we dropped roughly 44% during the bearish cycle, taking 2-3 years to move into accumulation before another impulse wave up. That places a target for entry exactly in the highlighted zone around $250ish.
But I wouldn't get too greedy on my favorite commodity, buying orders can't be too low either. This would likely have to be a multiyear hold. Pepperstone sells coffee on cash contract but I usually do futures. Pity that I didn't get in sooner, bullish cycles is also at least a 2 year journey. I'll sell when the weather is bad 😅
Next up? Chocolate for sure...

Is silver a safe commodity ?Is silver a safe commodity ? This is the main question. In the short, maybe yes.
The price of silver has once again returned to lateralize in this channel. Between static support at 14.07 and static resistance at $ 14.75 an ounce. Until one of the two is violated, the trend remains flat. So speculators will tend to trade this commodity on very short time frames.
In any case, from a technical point of view, the silver seems to be directed towards the support just mentioned. In any case, from a technical point of view, the silver seems to be directed towards the support just mentioned. A test of the area around $ 14 will trigger a series of long entries by investors, who will keep the positions in the medium period, keeping them in their portfolios up to the maximum target between 16.50 and 17 dollars. Coinciding with the dynamic resistance zone identified by the EMA200 periods.
Basically, this raw material tends to start rising again immediately. The tensions caused by a trade war between the USA and China, the political and economic instability that plagues Europe and a possible return to an even more restrictive monetary policy by the United States, will lead investors to take refuge and differentiate their portfolio with assets such as silver and gold, or other precious materials.
Operative ideas
So, as we said before: Is silver a safe commodity ? Maybe with this strategy.
Having said that, it is advisable to start to position ourself long on the SILVER and increase if the price falls to the support indicated, from a purely technical point of view.
As a first target we can hypothesize the resistance of the channel in which the price is lateralized ($ 14.75). If it is broken to the upside, you will see an acceleration of the price up to the second target in area 15.23. The short-term final target is located close to $ 15.74 an ounce.

DJIA: DOWI: Long-term Dow Jones and Commodity Cycles clean chartDow Jones Industrials and Commodity Cycles
Apologies for this chart. Very sketchy. Tradingview data on CRB index only goes back to 1994 so have had to hand-draw
the index in very rough form to try to explain a very obvious but seldom mentioned inverse relationship between stock
markets and commodities. It's less apparent in shorter term 10 year data sets (as next 10 year comparison will show, next
upload) so maybe that's the reason it doesn't get a mention but if you look at the super-long term charts a clear pattern
emerges underneath the shorter term noise...you can clearly see that when the Dow is in bull phase the CRB index trades
sideways to down. And that when the Dow trades sideways to down for years on end, the CRB starts to rally against this
trend. Weird. Counter intuitive. But there. Clearly. The underlying message written into the 110 year history of
this chart is that we should expect further long-term pressure on commodity prices as a whole. That sounds crazy. It would
have in 1949 and 1982, too, probably.
Expect oil prices to struggle to regain $50 and hold for any
length of time. Only hope for commodities in general really is that USD falls a lot further to sustain prices. But as a general
rule of long-term strategy the lesson of this chart is to sell commodity rallies, as opposed to buying the dips. The exact
opposite of current longer term strategy for trading the Dow and S&P. Interesting. Or not?

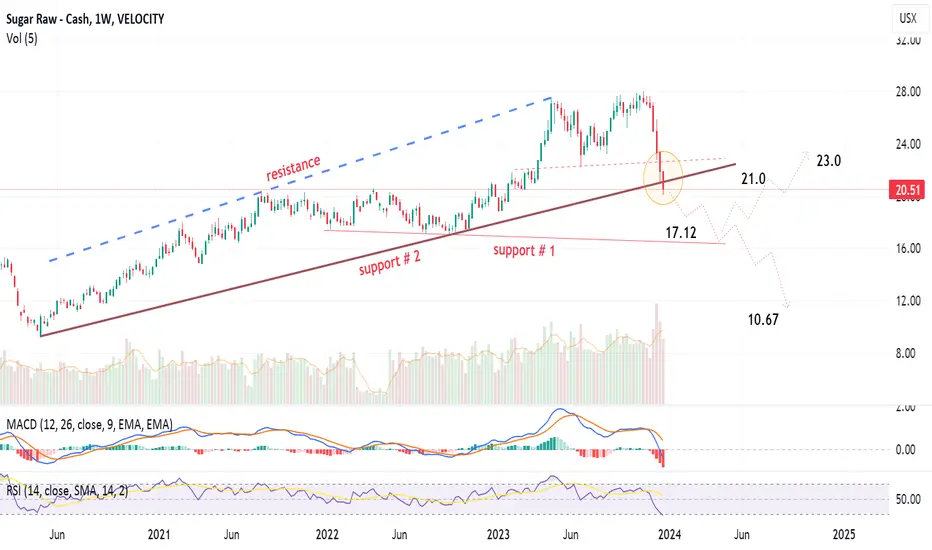
Time for SUGAR (commodity) international prices to cool down?Weekly chart, SUGAR commodity has broken down support line # 2, and is heading towards #1 at around 17.12
Below that, the next target price will be 10.67
Another scenario is to rebound from Support # 1 towards 21 then 23
MACD indicator went negative, while RSI is getting into the buy area
DB. commodity index idea (27/09/2022)DB. commodity index
We expect the index to continue declining because prices are below the 27.05 resistance point, and wave (2) has already ended and started falling in waves (3). We expect prices to drop to 1.618% at 22.18, but currently, we expect the correction to continue to 61% at 26.06 to end wave 2 before descending again.

Carry trade + commodity dollar section of FX market on riseSince Fed's inaction to raise interest rates and the publicatin of very poor NFP data carry and commodity currencies are absolute outperformers.
The trend might continue is case of further negative US data publication...


