Ethereum (ETHUSDT) Daily Long&Short Trade Setups 2021/01/25Live trades will be called in the latest daily post. Follow me to trade live with me!
Also check out my daily post on Bitcoin!
MARKET OVERVIEW
Price Action: ETH going on an insane pump to create a new ATH @ $1475. Lets see if it corrects down from here or goes parabolic like BTC did when it broke $20K
Chart Patterns: No patterns.
Areas of Interest: The area(s) of interest for us are the current levels around $1438 and the 200MAs @ $1290-1310. Once price reaches one of our areas of interest and gives us a valid entry signal, I will update the trade, so make sure you follow me to get the trade entry signals in real time.
TRADES(S) RECAP: LATEST 3 TRADES
2021/01/11: We had losing trade! We entered a long @ $1024.8, with Stop Loss @ $971, which was hit.
2021/01/10: We had winning trade! We entered a long @ $1283, with Stop Loss @ $1247, and price reached a high of $1325, giving a risk reward ratio of 1:1, meaning if you risked 1BTC on this trade, you could've made 1BTC.
2021/ 01 /07: We had two winning trades! We entered a short @ $1213, with Stop Loss @ $1224, and price reached a low of $1159, giving a risk reward ratio of almost 5:1, meaning if you risked 1BTC on this trade, you could've made almost 5BTC. After our short trade, we had a trade of a new experimental trendline strategy. We entered a long @ $1194, with Stop Loss @ $1173, and price reached a low of $1289, giving a risk reward ratio of almost 4.5:1, meaning if you risked 1BTC on this trade, you could've made almost 4.5BTC.
TRADE SETUPS
Below are the potential trade setups that I would be interested in trading. Regardless of the path that the price takes, I will be monitoring the market for a valid trade entry signal.
Long Trade Setup #1: Retest and Continuation (200MAs)
To open a long position, we are waiting for price to retrace back down to test the 200MAs and then continue moving up.
1. Price Action: Price needs to move back down to the 200MAs, currently projected to be @ $1290-1310 by the time price reaches it, and bounce back up.
2. Trade Entry Confirmations: Bullish candlestick pattern, above average volume, MACD bottoming
Short Trade Setup #1: False Breakout
To open a short position, we are waiting for price to break above the horizontal resistance and then fall back down.
1. Price Action: Price breaks above and then falls below the high @ $1438, forming a bull trap
2. Trade Entry Confirmations: A breakout candlestick followed by a breakdown candlestick, above average volume on both breakout candle and breakdown candle, MACD topping out
Why Follow Me
Daily analysis on the latest market movements and price zones for high probability trade setups.
Live trade signals so that you can take the same trades that I am taking.
A great place to help each other, learn from each other, and grow together.
Trading education in the form of personal advice and educational materials
Constantly testing and adding new trading strategies and refining battle-tested ones.
About Me
I started trading in 2008, first got introduced to bitcoin in 2009, and have been actively trading cryptocurrencies since 2016.
I have worked on Wall Street trading bonds, stocks, and options.
I have worked at top consulting firms advising Fortune 500 companies and worked on $10Billion+ deals.
I have founded and advised blockchain projects and companies, including in the areas of defi, nft, data ownership, and personal identity.
I have taken hundreds of live trades, each recorded with over 50 data points, all meticulously analyzed, using data analysis and modeling to optimize win probability and risk reward.
DISCLAIMER: I'M NOT A FINANCIAL ADVISOR AND THIS IS NOT FINANCIAL ADVICE, AND I WILL NOT BE RESPONSIBLE FOR YOUR WINS OR LOSSES, DYOR.
Please support me by liking, sharing, commenting, and following, and sharing your ideas and analysis below! Thanks!
Search in ideas for "Chart Patterns"

Ethereum (ETHUSDT) Daily Long&Short Trade Setups 2021/01/24Live trades will be called in the latest daily post. Follow me to trade live with me!
Also check out my daily post on Bitcoin!
MARKET OVERVIEW
Price Action: ETH consolidated at the 200MAs, and has broken out from that range and is rallying hard.
Chart Patterns: No patterns.
Areas of Interest: The area(s) of interest for us are the highs @ $1438 and the 200MAs @ $1235-1255.. Once price reaches one of our areas of interest and gives us a valid entry signal, I will update the trade, so make sure you follow me to get the trade entry signals in real time.
TRADES(S) RECAP: LATEST 3 TRADES
2021/01/11: We had losing trade! We entered a long @ $1024.8, with Stop Loss @ $971, which was hit.
2021/01/10: We had winning trade! We entered a long @ $1283, with Stop Loss @ $1247, and price reached a high of $1325, giving a risk reward ratio of 1:1, meaning if you risked 1BTC on this trade, you could've made 1BTC.
2021/ 01 /07: We had two winning trades! We entered a short @ $1213, with Stop Loss @ $1224, and price reached a low of $1159, giving a risk reward ratio of almost 5:1, meaning if you risked 1BTC on this trade, you could've made almost 5BTC. After our short trade, we had a trade of a new experimental trendline strategy. We entered a long @ $1194, with Stop Loss @ $1173, and price reached a low of $1289, giving a risk reward ratio of almost 4.5:1, meaning if you risked 1BTC on this trade, you could've made almost 4.5BTC.
TRADE SETUPS
Below are the potential trade setups that I would be interested in trading. Regardless of the path that the price takes, I will be monitoring the market for a valid trade entry signal.
Long Trade Setup #1: Retest and Continuation (200MAs)
To open a long position, we are waiting for price to retrace back down to test the 200MAs and then continue moving up.
1. Price Action: Price needs to move back down to the 200MAs, currently projected to be @ $1235-1255 by the time price reaches it, and bounce back up.
2. Trade Entry Confirmations: Bullish candlestick pattern, above average volume, MACD bottoming
Short Trade Setup #1: False Breakout
To open a short position, we are waiting for price to break above the horizontal resistance and then fall back down.
1. Price Action: Price breaks above and then falls below the high @ $1438, forming a bull trap
2. Trade Entry Confirmations: A breakout candlestick followed by a breakdown candlestick, above average volume on both breakout candle and breakdown candle, MACD topping out
Why Follow Me
Daily analysis on the latest market movements and price zones for high probability trade setups.
Live trade signals so that you can take the same trades that I am taking.
A great place to help each other, learn from each other, and grow together.
Trading education in the form of personal advice and educational materials
Constantly testing and adding new trading strategies and refining battle-tested ones.
About Me
I started trading in 2008, first got introduced to bitcoin in 2009, and have been actively trading cryptocurrencies since 2016.
I have worked on Wall Street trading bonds, stocks, and options.
I have worked at top consulting firms advising Fortune 500 companies and worked on $10Billion+ deals.
I have founded and advised blockchain projects and companies, including in the areas of defi, nft, data ownership, and personal identity.
I have taken hundreds of live trades, each recorded with over 50 data points, all meticulously analyzed, using data analysis and modeling to optimize win probability and risk reward.
DISCLAIMER: I'M NOT A FINANCIAL ADVISOR AND THIS IS NOT FINANCIAL ADVICE, AND I WILL NOT BE RESPONSIBLE FOR YOUR WINS OR LOSSES, DYOR.
Please support me by liking, sharing, commenting, and following, and sharing your ideas and analysis below! Thanks!

BTC-USD: is BTC repeating July 2018 PA??Hello All,
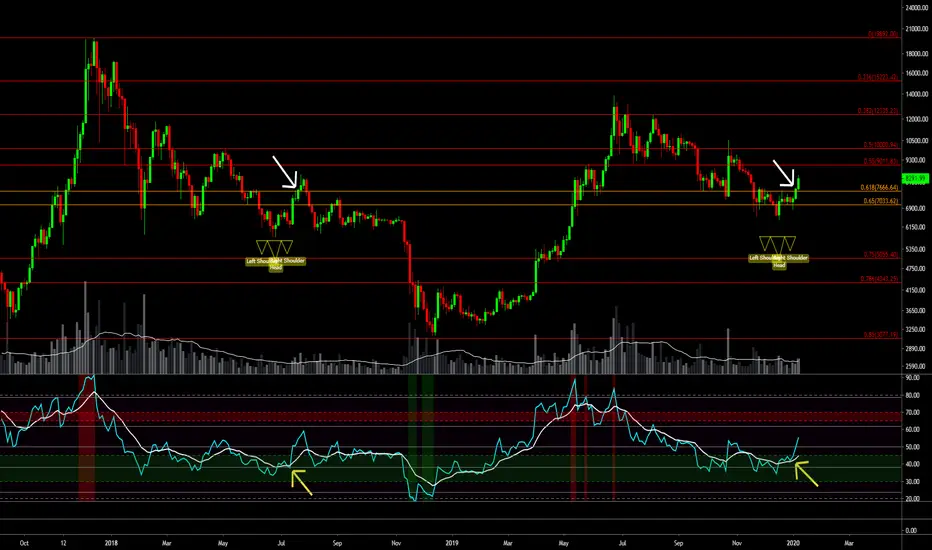
In this post I would like to point out some key similarities I saw on BTC chart with old PA from July 2018 (top of 8500).
1) Similar chart patterns:
On 3D BTC chart, in july 2018 we saw very nice Inv-H&S formation which broke up taking BTC to 8500. This pattern also formed near Golden Fib Pocket (highlighted with golden lines).
We have exact similar structure now as well, we saw break from Inv-H&S pattern which also broke above the Golden Fib Pocket.
2) Similar RSI patterns:
Back in July we saw RSI getting supported by its MA as BTC broke that Inv-H&S formation, this happened when RSI was at ~38.2 Fib level. We saw same pattern this time as well.
3)EMA alignment:
During the July high, we saw a very specific EMA alignment (see the chart), On today's BTC chart we are seeing exactly same EMA alignment as well.
144EMA is freshly crossed below 200EMA in both these cases.
4) similar descending channel:
We also saw a similar descending channel in July 2018 which we have been seeing at present. BTC topped out at this exact resistance level back then.
** I don't know if BTC will follow that exact PA we saw back then, but I think the similarities we have should not be ignore**
**Promotional**
We saw ~1000$ move in BTC in last 2 days. Me and some other guys in my channel traded this move for insane profits.
Shepherd Indicator gave perfect buy signal as you see here, I shared this with my discord members. Check out link in signature section below.
Also Check below my forecast for BTC PA in 2020 and ahead..
Happy and safe trading...
Chao...
7 Dimension Sell Setup for EURGBP😇 7 Dimension Analysis
Top-Down View:
A daily internal swing breach indicates the possibility of a retracement to fill the Daily Fair Value Gap (FVG) area. Additionally, an H4 Change of Character (CHoCH) along with a major swing liquidity sweep suggests a move towards the H4 inducement area, which aligns with the H1 decisional order block and the Daily Bullish FVG, creating a robust buy Point of Interest (POI) for long-term entries. However, in this 15-minute analysis, we focus on the short-term bearish momentum for a counter-trend sell entry.
Analysis Time Frame: 15-Minute (15M)
Swing Structure:
Bullish with BOS (Break of Structure): The 15M structure is bullish with a valid BOS, which took an inducement to confirm a swing high.
Discount Zone: We’re waiting for the price to enter the discounted zone to mitigate the POI, which has been refined across multiple time frames. The target area is between 0.8340 and 0.8420, where liquidity is expected to be resting.
Pattern:
🟢 Chart Patterns:
Flag Pattern: An H1 flag pattern indicates strong sell-side momentum, reinforcing the idea of a retracement within this bullish structure.
🟢 Candle Patterns:
Momentum Candles: Strong momentum candles closing bearishly indicate solid selling pressure in the area of interest.
Volume:
A noticeable increase in volume on the last candle suggests significant interest from sellers, supporting a bearish bias in the short term.
Momentum (RSI):
🟢 Super Bearish Zone: Momentum is in the super bearish zone with a clear range shift, indicating that bearish pressure may continue in the immediate term.
Volatility (Bollinger Bands):
🟢 Contraction and Squeeze: Following a volatile move, price contraction has led to a tight squeeze on the bands. A clear “M” pattern has formed within this squeeze, and we now expect a continuation of bearish momentum with a “walking on the band” move on the downside.
Strength (ROC and DMI):
ROC and DMI Analysis: The Bearish DMI line is sharply increasing, indicating strong bearish momentum. The setup suggests an anticipated strong selling attempt as the market opens.
Rating: ⭐⭐⭐⭐
Probability: 75%
Overall, the analysis provides high confidence in a short-term pullback, with several technical indicators and patterns supporting a temporary bearish move.
Trade Setup:
Entry Details:
Entry Time Frame: 15-Minute
Entry TF Structure: Bullish (counter-trend)
Point of Interest (POI): Recent Order Flow
Trade Execution:
💡 Decision: Sell Limit
🚀 Entry: 0.8379
✋ Stop Loss: 0.8391
🎯 Take Profit: 0.8340
😊 Risk to Reward Ratio: 3.25 RR
🕛 Expected Duration: 1 Day
SUMMARY:
This short-term sell setup targets a counter-trend pullback within a larger bullish structure on the higher time frames. With multiple confluences including strong sell-side volume, bearish flag patterns, and clear RSI bearish momentum, this setup anticipates a retracement to the identified support zone. A Sell Limit order at 0.8379 seeks to capture the downside move towards 0.8340, offering a favorable 3.25 RR.

7 Dimension Analysis For GBPNZD Yearly: The market is entrenched in a multi-year downtrend. Despite yearly structure breakouts, rejections from the CIP level have been consistent, indicating strong resistance. The failure to breach upper yearly resistance suggests substantial selling pressure. A post-breakout bearish buildup implies a high likelihood of further downside in the coming years.
Monthly: A shift from a bullish to a bearish character is evident. Strong resistance rejections, particularly marked by a classic doji in August 2023 within a blue-box-highlighted area, indicate significant downward potential. The momentum flow in August 2023 adds conviction to the bearish scenario.
Weekly: While the weekly chart shows some sideways movement, the current positioning lacks clarity. Further examination is required for a comprehensive view of the market dynamics.
😇7 Dimension Analysis
Time Frame: Daily
Swing Structure: Bearish
Structure Behavior: Choch 50%
Swing Move: Impulsive
Inducement: Done; high is confirmed
Pull Back: 1
Internal Structure: Bearish
Ext OB: Unmitigated
Resistance: Found at the FVG area, with demand formed and three proper IFC rejections.
Time Frame Confluence: Daily
Pattern
Chart Patterns: A rounding triple top within a green rectangle indicates a bearish breakout, signaling the end of the corrective move.
Candle Patterns: Inside, with a Harami on Friday close.
Volume
Fixed range volume indicates a strong seller presence.
Significant bearish volume is observed at the green rectangle.
During the cycle, only one bearish candle had a significant impact on price.
Momentum RSI
Zone: Sideways
Range shift: Not clear but oscillating between sideways to bearish.
Divergence: A hidden bullish divergence suggests the potential for short-term bullish momentum.
Overbought sold rejections count: 1, with a bullish divergence.
Volatility Bollinger Bands
The middle band is below, indicating a bearish trend.
Expansion suggests a short-term sideways zone.
Just finished a walking on the band.
Strength According to ROC
Values: -0.37 GBP vs. 3.5 NZD, indicating NZD's strength.
Sentiment
High selling sentiment according to all the studies.
✔️Entry Time Frame: H1
✅Entry TF Structure: Bearish
☑️Current Move: Impulsive is starting.
✔Support Resistance Base: Extreme supply area.
☑️Candles Behavior: Rally-based drop, Momentum.
☑️Trend Line Marked: Waiting for breakout.
💡Decision: Ready for sell
🚀Entry: 2.046
✋Stop Loss: 2.0602
🎯Take Profit: 1.9750
2nd If Internal Structure change also Exit 3rd trendline breakout, Fomo
😊Risk to Reward Ratio: 1:5
🕛Expected Duration: 15 days
SUMMARY:
The analysis reveals a strongly bearish sentiment in the market. The yearly and monthly perspectives provide a broader context, while the daily analysis points to an imminent impulsive move. The entry strategy aligns with the overall bearish outlook, with a clear risk-to-reward ratio and an expected duration of 15 days.

XAGUSDTechnical and Fundamental Analysis of Silver (XAG/USD)
Based on the provided chart, a detailed technical and fundamental analysis of silver is presented below:
1. Overall Market Trend:
Strong Uptrend: The chart indicates a strong uptrend where silver prices are approaching a critical resistance level. This resistance is around $31.96, a level the price has previously struggled to break.
Key Resistance Level: Around $32.00, the price has attempted to break through this level multiple times but has failed. This level is recognized as a strong psychological and technical resistance area.
2. Candlestick Patterns:
Bullish Candlestick Pattern: In recent days, strong bullish candlesticks have been observed, indicating a market inclination toward upward movement.
Possible Reversal Pattern: If a candlestick pattern such as a "Pin Bar" or "Doji" forms at this resistance level, it could signal a price reversal and the inability to break the resistance.
3. Chart Patterns:
Double Top Pattern: If the price fails to break the $32.00 level and reverses downward, a double top pattern may form, signaling a potential bearish reversal.
Potential Resistance Break: If the price manages to break this level, it could trigger a new uptrend, potentially pushing the price higher toward $33.00 or beyond.
4. Fundamental Analysis:
Macro-Economic Factors: Silver, as a safe-haven asset, is influenced by global economic changes and inflation. In times of economic uncertainty and rising inflation, the demand for silver as an inflation hedge tends to increase.
U.S. Dollar: Fluctuations in the U.S. dollar can also impact silver prices. A weakening dollar may lead to an increase in silver prices.
5. Trade Suggestions:
Long Scenario (Buy):
If the $32.00 resistance is broken:
Entry Point: After a candle closes above $32.00, consider entering a buy position.
Stop Loss: Around $31.50, just below the breakout level.
Take Profit 1: $33.00.
Take Profit 2: $34.00 (if the uptrend continues).
Short Scenario (Sell):
If the price fails to break the $32.00 resistance and reversal signals appear:
Entry Point: Between $31.90 to $32.00 (after observing bearish reversal signs in candlesticks).
Stop Loss: Above $32.20.
Take Profit 1: $30.50 (first support level).
Take Profit 2: $29.50 (next support level).
6. Risk Management:
Using a stop loss is crucial due to the proximity to the resistance level.
The trade size should be adjusted according to capital and risk tolerance.
Conclusion:
Silver prices are approaching a strong resistance level. If this level is broken, a buying opportunity arises, but if the price fails to break it, there is a chance of a reversal towards lower support levels. For more detailed and up-to-date analysis, always consider market conditions and fundamental factors.
Given the comprehensive silver analysis, attractive trading opportunities are ahead. For more professional and precise analyses, make sure to follow Dr. Rezvani's page and benefit from daily insights and up-to-date trading signals! 🌟

ready to breakThe chart for Bhartiya International (NSE) is a monthly timeframe chart. Let's break it down and analyze it step by step.
### General Observations:
1. Resistance Breakout:
The price had previously formed a resistance around the **₹638 level**, which was tested multiple times between **2016 and 2018**. However, in those attempts, the price failed to break out.
In **2024**, the price has decisively broken above this level. A breakout like this, especially on higher volume, suggests strong bullish momentum.
2. **Volume Analysis (Highlighted Circle)**
There is a noticeable increase in volume at the beginning of 2024, right before the breakout, which is often a confirmation of a strong trend reversal. The increased volume shows that institutional or significant investor participation is present, supporting the upward movement.
The subsequent monthly candles also show significant gains, supported by decent volume, which adds further confirmation to the bullish outlook.
### Candlestick Patterns:
1. **2024 Candles:**
The latest candle (September 2024) is a strong bullish candle with no upper wick, indicating that bulls dominated the session, closing near the high of the month.
Prior months in 2024 show a series of higher highs and higher lows, a classic uptrend pattern.
2. **Long-Term Trend:**
The stock was in a prolonged downtrend or consolidation from **2018 to 2020**, followed by a recovery in **2021**.
After some consolidation around the **₹337 level** (acting as previous resistance turned support), the stock began its upward movement starting around **late 2023**.
### Chart Patterns:
1. Cup and Handle Formation:
There seems to be a potential **Cup and Handle** formation spanning from **2016 to 2023**:
The price peaked in **2016** around **₹638**, followed by a prolonged correction down to **₹85** (forming the cup base) and eventually moving back up to the resistance level.
The **handle** was relatively short and formed in early **2024**, leading to a breakout.
This pattern is typically bullish and often leads to strong upward momentum post-breakout.
### Possible Targets:
**Target 1 (Near-term):**
After the breakout above ₹638, the next potential target can be projected using a Fibonacci extension or by measuring the height of the cup (from ₹85 to ₹638, i.e., approximately ₹553) and adding this to the breakout point.
This gives a near-term target around **₹1200**.
**Target 2 (Long-term):**
If the breakout sustains and the stock continues its uptrend, we could see much higher levels in the longer term. A next major psychological level would be around **₹1500** or higher.
### Support Levels (Stop-Loss):
**Immediate Support:**
₹638, the previous resistance, now acts as immediate support. If the price closes below this level on a monthly basis, it may signal weakness.
**Major Support:**
₹337 is a strong support level that previously acted as resistance. In case of a significant market correction, this level could be tested.
### Summary:
**Bullish Bias:** The stock has broken out of a long-term resistance supported by strong volume, indicating bullish momentum.
- **Target:** near-term target could be around ₹1200, with potential for even higher levels over the long term.
- **Stop-Loss:** A conservative stop-loss can be set just below ₹638, or for a larger safety margin, below ₹337.
This stock seems to be in the early stages of a breakout, and the chart is giving clear bullish signals. However, regular monitoring is required, especially for potential corrections or changes in market conditions.

11 RR Sell Setup for USDCADCore Analysis Method: Smart Money Concepts
Based on the Smart Money Concepts methodology, we have identified a strong demand zone on the daily timeframe, which has once again given a strong rejection, changing the price character from bullish to bearish on the H1 timeframe.
😇 7 Dimension Analysis
Time Frame: H1
Swing Structure:
Bearish CHoCH from higher timeframe zone rejection.
Took inducement and now ready for a corrective swing move with its 1st pullback.
Internal structure turned bullish for a correction towards extreme and decisional POI (Order Flow or Order Block).
Preferred POI: Order Flow in the Premier zone of the swing.
Entry Model: Regular SMC.
Daily Resistance: Supply zone where sellers still have full control, with the 3rd breakout attempt failure.
Pattern:
🟢 Chart Patterns:
Reversal: Head and Shoulders pattern is clearly visible and completed.
🟢 Candle Patterns:
Observed multiple reversal candlestick patterns on the daily timeframe, including Doji, Long Wick, Engulfing, and Dark Clouds. These patterns indicate strong bearish momentum at the level.
Volume:
🟢 Very massive volume observed on the daily timeframe right before and after rejection, with the price reacting bearish. This is a strong indication for a sell position.
Momentum RSI:
🟢 Price is in the bullish zone yet, but strange things are noted in terms of momentum on the daily timeframe.
🟢 Strongest 3-candle divergence and loud moves.
According to Andrew Cardwell's method (used for momentum analysis with RSI), loud moves are almost 90% confirmed moves.
Volatility Bollinger Bands:
🟢 After one of the longest contraction phases, the breakout to the upper side was unable to give the expected move and was rejected after a squeeze breakout.
🟢 Walking on the band took a rejection with a head fake, indicating strong bearish control here.
Strength ADX: Neutral
Rating: ⭐⭐⭐⭐⭐
Entry Time Frame: H1
Entry TF Structure: Bearish CHoCH
POI: Waiting for mitigation
Decision: Sell limit order with extreme risk (as per my money management strategy).
🚀 Entry: 1.3855
✋ Stop loss: 1.3955
🎯 Take profit: 1.2818
😊 Risk to reward Ratio: 11 RR
🕛 Expected Duration: 45 Days
SUMMARY:
Based on the comprehensive analysis using Smart Money Concepts, a sell limit order at 1.3855 with a stop loss at 1.3955 and a take profit at 1.2818 is recommended. The setup shows strong bearish indications across various parameters, making it a high-probability trade. The expected duration for this trade is 45 days with a risk to reward ratio of 11 RR.
If any one want learn this type of analysis can contact

7 Dimension Analysis For Gold Core Analysis System (SMC)
1 Price, 2 pattrens, 3 Volume ,4 Volitality, 5 Momentum, 6 Time, 7 Sentiments
🕛 TOPDOWN Analysis
H1 shows a bullish structure with price successfully touching its extreme Point of Interest (POI). Afterward, it provides a bullish confirmation, indicating readiness for a bullish position on the 5-minute timeframe.
😇 7 Dimension Analysis
Time Frame: 5 MIN
1️⃣ Swing Structure: Bullish with Confirmation (Choch)
🟢 Swing Move: Corrective move towards mitigating the 5-min Extreme POI
🟢 Inducement: Taken with the first deep pullback for this swing
🟢 Strongest Demand: Accumulation on the Discounted Zone supporting the bulls
🟢 Traps: False Breakout observed
🟢 Time Frame Confluence: H4, H1, and M5
2️⃣ Pattern
🟢 CHART PATTERNS: Triple bottom reversal with a massive shakeout indicating a reversal
🟢 CANDLE PATTERNS: To be observed upon price reaching the execution level
3️⃣ Volume
🟢 Fixed Range: Volume on Fake Out observed to be massive compared to previous
🟢 Volume during Correction: No significant volume indicating weaker sellers
4️⃣ Momentum RSI
🟢 Divergence and Loud Bullish Move: Observed at the start, with the price still in the bullish zone above 40
🟢 Oversold Rejections: Indicating bullish sentiment
5️⃣ Volatility Bollinger Bands
🟢 Volatility Contraction Phase: Suggesting a Squeeze breakout is expected with Walking on the band scenario
6️⃣ Strength According to ROC
🟢 Gold Stronger than Dollar: For this week
7️⃣ Sentiment
Gold expected to undergo a short bigger timeframe correction
✔️ Entry Time Frame: M5
☑️ FIB Trigger event: Awaited
☑️ Trend line breakout: Awaited
💡 Decision: Buy
🚀 Entry: 2296
✋ Stop loss: 2290
🎯 Take profit: 2380 (If Internal Structure changes)
😊 Risk to Reward Ratio: 14
🕛 Expected Duration: 3 Days
📚 SUMMARY: The analysis indicates a bullish sentiment with various patterns and indicators suggesting a potential buying opportunity on the 5-minute timeframe. High volume on the Fake Out and absence of volume during correction hint at weaker sellers. Traders are advised to monitor candle patterns upon reaching the execution level and consider a buy position with a favorable risk-to-reward ratio of 14 over an expected duration of 3 days.

7 Dimensions Idea for BUY Gold CORE Analysis Method: Smart Money Concept
😇 7 Dimension Analysis
Time Frame: H1
1️⃣ Swing Structure: Bullish
🟢 Structure Behavior: Break of Structure (BoS)
🟢 Swing Move: Impulsive
🟢 Pull Back: 2
🟢 Internal Structure: Bullish
🟢 External Order Block (OB): Mitigated
🟢 Support & Demand: Start Accumulation from discounted area
🟢 Time Frame Confluence: H4 and H1 POI
2️⃣ Pattern
🟢 CHART PATTERNS:
W pattern formed at major swing
Continuation: Falling Wedge with proper breakout and retest, aligning with the breakout level and Fair Value Gap (FVG) level, making this area a high-probability POI for buyers
🟢 CANDLE PATTERNS:
Record Session Count (RSC) detected, indicating a correction towards 2404
Long wick candle at the bottom of RSC indicates bullishness
Engulfing and Kicker Sash patterns indicate bullish control at 2403
3️⃣ Volume
🟢 Volume during Correction: Dried up but now showing good volume as price moves upward
4️⃣ Momentum
🟢 RSI: Indicates full bullishness according to Grandfather Father Strategy
5️⃣ Volatility Bollinger Bands
🟢 Middle Band: Supported, contraction during retracement indicating potential range formation
🟢 Band Puncher: Lower band puncher indicates bullish strength
6️⃣ Strength According to ROC: Bullish
7️⃣ Sentiment: Bullish
✔️ Entry Time Frame: 5 minutes
✅ Entry TF Structure: Bullish with 5-minute swing liquidity sweep
☑️ Current Move: Impulsive in entry time frame
☑️ FIB Trigger Event: Triggered
☑️ Trend Line Breakout: Done
💡 Decision: Buy
🚀 Entry: 1st entry at 2406, 2nd entry at 2397
✋ Stop Loss: 1st at 2399, 2nd at 2391
🎯 Take Profit: 2441
😊 Risk to Reward Ratio: 7.5
🕛 Expected Duration: 2 days
SUMMARY
This analysis identifies a bullish swing structure on the H1 time frame with a proper BoS and impulsive moves. The internal structure remains bullish, supported by a mitigated external OB and accumulation at the discounted area. The pattern analysis highlights a W pattern and a falling wedge breakout with a retest, positioning this area as a high-probability POI for buyers. Candlestick patterns further confirm bullish control, supported by favorable volume and momentum indicators.
The sentiment is bullish with key indicators such as RSI and Bollinger Bands supporting an upward move. Entry points are identified at 2406 and 2397 with respective stop losses and a target take profit at 2441, providing a risk to reward ratio of 7.5. The expected duration for this trade setup is 2 days, contingent on continued bullish momentum and price behavior as outlined.

7 Dimension analysis CADCHF😇 7 Dimension Analysis
Time Frame: H1
1️⃣ Swing Structure: Initially bullish with proper Breakout of Structure (BoS), now showing a corrective move after inducement, possibly heading towards extreme swing area of correction
🟢 Internal Structure: Bearish
🟢 Ext POI: Unmitigated
🟢 Support & Discounted: Same area, drawing a Trendline break upside for additional confirmation
🟢 CHART PATTERNS: Double top reversal formed
🟢 CANDLE PATTERNS: Inverted Hammer with long wick, strict engulfing, fakeouts observed
🟢 Volume: High buy volume at POI area, good volume on breakout but none on fakeout
🟢 Momentum RSI: Bullish zone, momentum shifted from bullish to sideways, bearish divergence at the top, with loud moves and overbought rejections observed
🟢 Volatility Bollinger Bands: Contraction started, squeeze breakout expected in lower side, walking on the band anticipated with headfake, W patterns, and band puncher observed
🟢 Strength According to ROC: CAD stronger than CHF
🟢 Sentiment: Fully bullish
✔️ Entry Time Frame: H1
✅ Entry TF Structure: Bullish
☑️ Candles Behavior: To be observed once price reaches the level
☑️ FIB Trigger event: To be updated once occurred
☑️ Trend line breakout: To be updated when necessary
💡 Decision: Buy
🚀 Entry: 0.6658
✋ Stop loss: 0.6646
🎯 Take profit: 0.6699
😊 Risk to reward Ratio: 3.5
🕛 Expected Duration: 5 days
📚 SUMMARY: The analysis indicates a bullish sentiment with various patterns and candlestick formations suggesting a potential buying opportunity. High volume at the POI area adds to the bullish bias, with attention drawn to key events like FIB trigger and trend line breakout for updates. Traders are advised to monitor candle behavior upon reaching the specified level and consider a buy position with a favorable risk-to-reward ratio of 3.5 over an expected duration of 5 days.

XAU/USD: Navigating Fibonacci Levels with uptrendIntroduction:
The XAU/USD pair exhibits a compelling narrative of bullish tenacity as delineated by its Fibonacci retracement adherence. Engaging this commodity with a tripartite long entry stratagem offers an analytical spectacle, particularly for the enthusiast with an eye for harmonic patterns and momentum indicators.
Technical Analysis:
Chart Patterns:
A rising channel is evident, displaying higher highs and higher lows. The price action within this channel provides a bullish outlook, suggesting continuity in the uptrend, albeit with expected retracements.
Candlestick Patterns:
Recent candles have shown moderate bullishness with no significant wicks, indicating sustained buying pressure. Observers should watch for patterns such as bullish engulfing or morning stars near support levels for additional entry confirmations.
Fibonacci Analysis:
The Fibonacci retracement levels have served as pivot points, with the 0.382 level at 2393.30 and 0.5 level at 2365.47 acting as interim resistance zones. The pair's responsiveness to these levels offers entry points for long positions.
Volume Analysis:
An analysis of volume reveals a consistent interest, with no significant spikes, suggesting a lack of abrupt selling pressure.
RSI (Relative Strength Index):
The RSI hovers near the median, indicating neither overbought nor oversold conditions. However, traders should remain vigilant for divergence which could preclude shifts in momentum.
Risk Management:
Stop Loss (SL): A firm SL is set at 2312.55, which cushions the position against any abrupt reversal in trend.
Take Profit (TP): The TP levels are stratified, with the initial TP at 2393.30 (0.382 Fibo level) and a subsequent TP at 2418.39 should a bullish fervor persist.
Risk-Reward Ratios:
The risk-reward ratios are calibrated to match the entries:
Entry 1 (2347.83): Assumes moderate risk with the potential for a favorable reward up to the 0.382 Fibo level.
Entry 2 (2332.74): Offers a conservative risk approach, with rewards extending to the primary TP.
Entry 3 (2322.74): This aggressive entry assumes higher risk, compensating with the highest reward potential.
Entry and Exit Levels:
Entry 1: Initiating a position at 2347.83, nearest to the 0.786 Fibo level, which could serve as immediate support.
Entry 2: Placed at 2332.74, offering a buffer from Entry 1 and aligning with the channel's lower boundary.
Entry 3: Set at 2322.74, as a catchment for any deeper pullbacks and near the robust support at SL.
Conclusion:
In sum, the XAU/USD pair's behavior around these Fibonacci levels coupled with RSI readings grants traders a structured approach to engage the market with a risk-averse perspective. The outlined multi-tiered entry methodology caters to varied risk appetites, fostering a balanced and diversified portfolio approach.
Disclaimer:
This analysis is presented for educational purposes and should not be construed as financial advice. Due diligence and personal risk assessment are paramount when trading in the financial markets.

"Deciphering Bitcoin's Descent: A Technical RoadmapTechnical Analysis Overview
Chart Patterns:
Descending Channel: The price has been trading within a descending channel, indicating a short-term bearish trend.
Potential Double Bottom: There is a formation that resembles a double bottom pattern near the support level at 57364.46, which, if confirmed, could signal a trend reversal to bullish.
Candlestick Patterns:
Long Wick Rejections: Multiple candlesticks with long lower wicks near the support level suggest strong buying pressure and potential for a reversal.
Bearish Candles: The recent large bearish candles indicate strong selling pressure, confirming the current downtrend.
Indicators:
Moving Averages: The price is currently below a downward sloping 50-period moving average, reinforcing the bearish outlook.
RSI (Relative Strength Index): RSI is nearing oversold territory, indicating potential for a bounce back if the market considers BTC undervalued.
Volume: There's a spike in trading volume at the support level, which may point to a significant interest level and a possible pivot point.
Risk Management:
Entry Points: The chart suggests two potential entries. Entry 1 at 61995.62 could be considered if there is bullish confirmation, such as a bullish candlestick pattern. Entry 2 at 58297.48 is closer to the strong support level and might offer a better risk-reward ratio.
Stop Loss: A prudent stop loss for both entries could be just below the support level at 57364.46, where the chart shows a consolidation of buy orders.
Take Profit: Two take profit levels are indicated. Take Profit 1 at 66917.28 represents a conservative target near the top of the descending channel. Take Profit 2 at 70920.99 is more ambitious and assumes a breakout above the channel.
Risk-Reward Ratio:
Assuming Entry 1, the distance to Stop Loss is approximately 3631 units, while the distance to Take Profit 1 is approximately 4921 units, yielding a risk-reward ratio of approximately 1:1.36.
For Entry 2, the risk-reward ratio could be more favorable given the closer proximity to the support level.
Trading Plan
Entry: Wait for bullish signals near support levels or a breakout above the channel for Entry 1. Entry 2 requires confirmation of support holding with a strong bullish reaction.
Exit: Take partial profits at Take Profit 1 and consider trailing stops or further profit taking if momentum continues towards Take Profit 2.
Monitoring: Keep an eye on the RSI for divergence that may signal weakening of the current trend and volume spikes that could indicate trend reversals.
Conclusion
The market is currently in a downtrend within a descending channel, but approaching a strong support level that could catalyze a reversal. Traders should watch for bullish signals and confirmations before entering, and employ strict risk management to protect against further downside movement.
#Bitcoin
#Crypto
#TechnicalAnalysis
#TradingView
#BTCUSD
#Cryptocurrency
#Blockchain
#DayTrading
#Investing
#DigitalCurrency

7 Dimension Analysis for AUDCAD 😇 7 Dimension Analysis
Time Frame: H4
1️⃣ Swing Structure: Bullish
🟢 Structure Behavior: Break of Structure (BoS)
🟢 Swing Move: Impulsive
🟢 Inducement: Done
🟢 Internal Structure: Also bullish
🟢 Decisional FVG liquidity: Mitigated, Making a prebreak out Buildup
🟢 Traps: Fakeout done at the top, grabbed all the swing liquidity from lower side
2️⃣ Pattern
🟢 CHART PATTERNS: Continuation Ascending Triangle
🟢 CANDLE PATTERNS: This is a consolidation area; no valid candle pattern is observed. We will check our candle patterns at the breakout or market opening
3️⃣ Volume
🟢 We need a deep observation of volume on the breakout
🟢 less than the previous move
4️⃣ Momentum RSI
🟢 Zone: Sideways
🟢 Range shift: Bullish to sideways
🟢 Divergence: A bearish divergence is here, but it's weak
5️⃣ Volatility Bollinger Bands
🟢 High level of contraction
🟢 Various Band Punchers on the upper band, but they don't follow up the signal
6️⃣ Strength According to ROC
🟢 Values: AUD is 7.01 vs CAD 3.02
7️⃣ Sentiment
When we mix up all the parameters, there is a high chance the price can go up during the coming sessions, so we need to seek buy entries during the week
✔️ Entry Time Frame: H4
✅ Entry TF Structure: Sideways as internal
☑️ Current move: Impulsive sideways
✔ Support resistance base: Fixed range volume POI
☑️ Candles Behavior: Nothing is clear
💡 Decision: We need to wait for the price to break the upper level or come downside to our POI area, then we can buy this pair
🚀 Entry: 0.8980
✋ Stop Loss: 0.8925
🎯 Take Profit: 0.9150
2nd If Internal Structure changes also Exit 3rd Trendline Breakout, Fomo
😊 Risk to Reward Ratio: 3.1
🕛 Expected Duration: 7 days
SUMMARY: The analysis indicates a bullish stance with a well-defined structure and pattern, though the candle patterns are not clear at the moment. The decision suggests waiting for a breakout or a move to the POI area for a buy entry, considering potential internal structure changes and trendline breakouts.

AMD Broke Out... Now What??!!... An Earnings Story!!AMD appears to have confirmed a technical breakout on the Daily chart. The stock has experienced a meteoric rise since its last earnings report(10/30/23) moving over +20% in just a few short days. This extremely BULLISH price action has not only been fueled by a great earnings report, but there is also a major news catalyst driving the stock price higher. The catalyst has been strong enough to boost the price despite weak 'Q4 forward guidance. There are talks of a new AI chip that may allow them to compete with the likes of NVDA, the main player in the semiconductor industry. AMD may never surpass NVDA in stature however, AI projects to be the biggest technological innovation since the implementation of the internet making being the second, or even third biggest player in the space not a bad spot to be in. The need for semiconductors in general will most likely dominate the future resulting in plenty of profits to be made.
The recent price action of AMD is really a tale of earnings. Zooming out to the Daily chart and this phenomenon can be easily identified. The story really began with an earnings miss on 11/01/22. A few days before the release of this report AMD would set what ultimately turned out to be its 52 wk Low. This was preceded by a precipitous drop from the ATH of $164.46 set on 11/30/21. This rise to a new ATH and subsequent fall to a new 52 wk Low ironically occurred during a streak of nine consecutive earnings beats. Further analysis and one is able to discern that price action broke down over a series of DBL TOP patterns before recovering in a series of a DBL BTM patterns. This behavior may prove to be foreshadowing, but I digress.
Fast forward to 11/3/23 AMD has just closed above the neckline of a DBL BTM pattern, after completing a series of DBL TOP patterns, in the midst of four consecutive earnings beats. History may not repeat itself, but it has a tendency to rhyme. The stock has also broken through the top of a Descending Channel(D) that it has been trading in since the start of the series of DBL TOP patterns. The upward momentum has been so strong that the stock broken and closed above the 200MA(D), 100MA(D), and 50MA(D) over just the last three trading sessions, making a new local high in the process. The stock has been on a rocket ship since finding support at levels identified and explained in a previous idea(see AMD Earnings Breakout or Breakdown).
As for this idea. The series of DBL TOP patterns is represented by the black curves above the would be tops, with their respective necklines identified by the small black circles seen on the chart. The DBL BTM pattern is represented by the green curves found at the would be bottoms with the neckline also identified with a circle as well. The red curves represent a failed DBL TOP even after a closing confirmation on the Daily chart below what would have been the neckline. Proof that the markets can do anything at any time therefore, you can never let your guard down. However, it should be noted that this failed DBL TOP pattern comes after two successfully executed DBL TOP patterns, and a third that could be considered successful depending on your perspective. The third one just happened to occur near the 200MA(D) which has historically been strong support for any asset. Regardless the diagnosis it still amounts to a series of successful BEARISH patterns that have begun to fail, possibly indicating BULLISH price action moving forward.
Bull Case
1. Strength above $111.31. If the DBL BTM pattern is to play out, this area would be the neckline of the formation.
2. Strength above the top of the Descending Channel(D) in which the stock has been trading for the past three months or so. The stock has closed above the top of the channel with momentum. It would not be shocking to see the stock retest the top of the channel.
3. A retest and bounce from the local low, creating a higher low. This would be a BULLISH indication as the stock has already created a higher high signaling the potential start of an uptrend.
Bear Case
1. Strong rejection at the stock's current levels. Such price action could imply yet another DBL TOP formation, leading to further downward momentum.
2. BEARISH price action, chart patterns, or strong rejection at the yellow rectangle drawn above the current price level. This area represents the Golden Zone of a BEARISH Fib Retracement from the local high of $132.83 to the local low of $93.12. This area serves as a strong area of resistance and could serve as a logical area of rejection. Especially given how far and fast the stock has run since earnings.
3. A break below the DBL BTM pattern all together. This would be extremely BEARISH and could signal a falling knife situation. Under these circumstances bias should switch to the downside and the stock should be monitored for short opportunities.
*As things currently stand, bias is to the upside, with a guilty until proven innocent approach. The market has been extremely erratic, and rallies have been hard to trust. The stock has only created its first higher high, after trading in a clear downtrend(a series of lower highs and lower lows).
*RSI(D) displays a DBL BTM formation that has been confirmed with a break of the neckline.
*Watching AVP(52 wk Low)(POC), Moving Averages(D), Descending Channel(D), Key Levels(black rectangles), Ascending Support(red trendline), Bollinger Bands(D), and the AVWAP(52 wk Low) at their respective levels for additional confluence.

Why I Don't Trade Patterns AnymoreHi Purpose Traders. Let's talk chart patterns. As you may know there are dozens of chart patterns out there. I don't know if you're like me, but I get a bit anxious when there are too many things to choose from. It's like being in an ice cream shop. I like ice cream, but I only eat 1 flavor most of the time.
Long story short, I used to be a pattern trader and what I realized was like most patterns, I had to wait for the pattern to form before I could trade it. By the time a pattern formed I would have missed a good move because the pattern would change and price moved without providing me an entry.
I remember there was a time I thought I saw a bullish wedge formation that turned into a flag that turned into a false break out trade. The more I kept waiting for patterns to form the more I realized I just don't like them because they constantly change.
I believe it's the whole break and retest with different timeframe variables that leave a bad taste in my mouth.
What do I do instead?
I focus on price fluctuations to identify the trend. I figured the more decisions I eliminate the better my trading will be and it has improved tremendously. This wasn't an overnight thing and yes I do still see patterns, but creating my own edge by trading one strategy with simple rules helps me focus on price action alone.
I like a cleaner chart with as little detail as possible. No games. No patterns. No lines blocking the flow of price. Just straight price action.
Do you prefer to trade this way too or are patterns your thing. There is no right o wrong. You have to trade what works for you.
GBPJPY 1H QUASIMODO STRATEGYQuasimodo Pattern Trading Rules
The Quasimodo trading rules for sell signals can be summarized as follow:
A prevailing uptrend needs to be visible – series of HH followed by a series of HL.
Break in the market structure – price start to make lower lows LL.
Entry Option #1 - Place a sell order near the right shoulder.
Entry Option #2 - The 50% - 61.8% Fibonacci retracement zone is a better entry technique if price does not reach
right shoulder level.
Hide the protective stop-loss above the last higher high HH.
Take profit near the first valley of the Quasimodo chart pattern.
Final Words – Quasimodo Pattern Trading
In summary, Quasimodo pattern trading is a new technique used to catch trend reversals. Don’t be afraid to give it a try just because it’s a new chart pattern. When all the elements of this reversal pattern come together, you have a receipt for success. With our Quasimodo trading strategy, you now have a proper framework to tame the high volatile forex market.
So, here is a quick summary of what you’ve learned today:
Quasimodo chart pattern is a reversal pattern.
Quasimodo trading is not similar to Head and Shoulder trading.
Quantify the crookedness of Quasimodo by drawing a visual line on the price chart.
V-shaped price structure of the Quasimodo pattern produces more profitable signals.
The 50% - 61.8% Fibonacci retracement zone is a better entry technique.
Quasimodo Trading Strategy – The Crooked Pattern from Notre Dame
Learn the Quasimodo trading strategy to find profitable trend reversal opportunities. Throughout this trading guide, you’ll learn what is Quasimodo pattern trading, how to spot this reversal setup, what are the similarities between Quasimodo trading and Head and Shoulder trading, and, last but not least, we’re going to have a deep dive into how to create a winning trading strategy.
Trading is not an easy game, but with the Quasimodo trading setup you can gain some valuable insight into that market sentiment, more precisely, you will know in advance when the trend is about to reverse. By being able to stay ahead of the market, you can increase the accuracy of your trading strategy and improve your expected return on investment (ROI).
Table of Contents
1 What is Quasimodo?
2 Differences between Quasimodo and Head and Shoulder
3 When to Trade Quasimodo Trading Setup?
4 How Quasimodo Pattern Trading Works?
5 Quasimodo Pattern Trading Rules
6 Quasimodo Trading Strategy
7 Final Words – Quasimodo Pattern Trading
What is Quasimodo?
Quasimodo is a reversal trading pattern that appears at the end of an uptrend. As a price formation, the Quasimodo pattern is depicted by three peaks and two valleys, where:
First, the middle peak is the highest, while the outside two peaks are of the same height.
And secondly, the second valley is lower than the first one.
Note* Some technicians might call this reversal pattern the “Over and Under” chart pattern.
Quasimodo pattern in forex trading predicts a bullish-to-bearish trend reversal.
Based on the analogy of market sentiment we can distinguish two types of Quasimodo patterns:
Bullish Quasimodo, which appears at the end of a downtrend.
Bearish Quasimodo, which appears at the end of an uptrend.
Now, you might be inclined to believe that the Quasimodo pattern looks similar to the Head and Shoulder trading pattern.
You’re not mistaken as the two trading chart patterns are related but at the same time, they are distinguished price formations.
Below, we’re going to expand on the differences between Quasimodo trading vs. Head and Shoulder trading.
Differences between Quasimodo and Head and Shoulder
There are two major differences between the Quasimodo pattern trading and Head and Shoulder trading:
The valleys have different price structures – aka the depth of the valleys have no symmetry with the Quasimodo pattern.
And, the two reversal patterns use two different entry techniques.
The main difference between the Quasimodo pattern and the Head and Shoulder pattern is the left leg (second valley) of Quasimodo is much lower than the right leg (first valley). With the Head and Shoulder pattern, both valleys are more or less of the same scale.
The Quasimodo price structure doesn’t stand out compared to the HS pattern.
That’s where the Quasimodo name is derived from – aka the “malformed” second valley, which depicts a crooked Head and Shoulder pattern.
In this regard, it’s not going to be that easy to identify with your naked eye the Quasimodo forex chart pattern. Instead, you'll need to use advanced trading indicators.
The second major difference between the two reversal patterns is the point of entry.
Usually, the point of entry for the HS pattern is the break of the neckline, but with the Quasimodo pattern, we put an entry order near the left shoulder.
Basically, Quasimodo is an advanced pattern of Head and Shoulder.
A key question that is asked by many traders is how we determine when to trade the Quasimodo chart setup?
When to Trade Quasimodo Trading Setup?
The best time to trade the Quasimodo pattern is after a significant rally or sell-off no matter the time frame used. All chart patterns are fractal in nature meaning they generally appear in various forms in different time frames from the daily chart down to the 1-minute chart. This is great news for traders who trade across multiple time frames.
The existence of the prevailing trend gives us the opportunity to either catch an entirely new trend or at least we get the chance to profit from a temporary retracement.
Additionally, the Quasimodo chart pattern allows for better entry points, which is in contrast with trend trading where the entry signals are delayed. But, as you might know, each trading style has its pros and cons.
Now, let’s see how Quasimodo pattern trading works.
How Quasimodo Pattern Trading Works?
The Quasimodo pattern works based on the imbalance between the supply and demand forces.
Or, in other words, the Quasimodo chart pattern tracks the shift in the price structure.
Market structure is the continuous series of higher highs and higher low producing higher peaks and troughs. When we have a break of structure, meaning a break of the ongoing HH and HL, the price starts first to print a lower low.
The Quasimodo trading strategy provides us with a proper framework to interpret the constant ebbs and flows of any asset (currency, cryptocurrency, stocks, commodity, etc.).
The bearish Quasimodo pattern is in short concerned with how the market comes from a buying momentum and heads towards the selling momentum.
The Quasimodo chart pattern starts to become visible only once the price fails to make another higher low (HL).
For some novice traders, this type of information might be enlightening because now you can have a proper framework to analyze the price structure. You have to keep in mind that this is one approach to view the markets and by no means the only one.
Now that things are starting to get clearer, we’re good to define the Quasimodo pattern trading rules.
Quasimodo Pattern Trading Rules
The Quasimodo trading rules for sell signals can be summarized as follow:
A prevailing uptrend needs to be visible – series of HH followed by a series of HL.
Break in the market structure – price start to make lower lows LL.
Place a sell order near the right shoulder.
Hide the protective stop-loss above the last higher high HH.
Take profit near the first valley of the Quasimodo chart pattern.
As a general rule, the Quasimodo pattern carries more weight if the second valley is much lower than the first valley. In other words, the bigger the distance between the two valleys, the more crooked the Quasimodo pattern becomes.
Next…
Let’s have a look at the bullish Quasimodo reversal pattern.
The Quasimodo trading rules for buy signals can be summarized as follow:
A prevailing downtrend needs to be visible – series of LL followed by a series of LH.
Break in the market structure – price start to make higher high HH.
Place a buy order near the right shoulder.
Hide the protective stop-loss strategy below the last lower low LL.
Take profit near the first peak of the Quasimodo chart pattern.
Now let me share with you a simple but effective trading trick.
If you want to test how crooked the Quasimodo chart pattern is, simply draw some lines along with the price structure. When you do this, the Quasimodo price structure will pop up on your price chart.
When you highlight the price structure we can clearly see the crookedness of Quasimodo.
Thus, in this particular trade, the market didn’t give us the chance to enter a buy order.
And that’s the thing with the Quasimodo pattern trading, meaning lots of missed opportunities.
To go around this pitfall that is common with all chart patterns, we’re going to add some confluence to the Quasimodo pattern and twist the rules.
Below, we’re going to outline an advanced Quasimodo trading strategy:
Quasimodo Trading Strategy
You don’t have to add complicated stuff to make a simple chart pattern give more accurate trade signals. The only extra tool we need to optimize the Quasimodo trading strategy is the Fibonacci retracement indicator.
Now, if you’re a fan of the Fibonacci retracement tool, you might want to check this new Fibonacci Trend Line Trading Strategy.
The Fibonacci retracement indicator can help us anticipate where the last price swing that is part of the Quasimodo chart pattern might end. If you backtest this pattern, you’ll see a lot of missed trading opportunities because the last swing wave of the Quasimodo pattern doesn’t always stretch near the left shoulder. If you need to learn the best backtest strategy check out our blog!
The Fibonacci retracement levels can help us identify reliable price zones of support and resistance. We’re particularly interested in the price zone between the 50% Fibonacci retracement and 61.8%, with the sweet spot being the 61.8% Fibonacci retracement level.
By applying the new rules of the Quasimodo trading strategy, we’re able to capture a full-blown reversal.
Another key point to take into consideration when you trade the Quasimodo pattern is the quality of the swing highs and lows.
We need to find a mechanical approach to quantify the quality of the swing highs and swing low points.
As a general rule, we consider a qualified swing high (swing low) only those points that have a V-shaped pattern. These price formations are also known as V tops and V bottoms.
A V-shaped swing low can be easily recognized by the price sharply switching from bearish to bullish respectively from bullish to bearish.
If we examine the Quasimodo chart pattern, we can notice that every single swing high and swing low part of the Quasimodo pattern is V-shaped.

7:1 Risk to Reward sell Setup for USDCHFCore Analysis Method: Smart Money Concepts
Based on the Smart Money Concepts methodology, the following analysis has been conducted:
😇 7 Dimension Analysis
Time Frame: H1
Swing Structure:
The current swing structure is totally bearish with a proper inducement.
The corrective swing move has already reached its mid-Point of Interest (POI) with four pullbacks. Now, the internal structure has turned bearish, indicating the start of another impulsive move.
The mid of the move contains OB (Order Block), SOB (Significant Order Block), and FVG (Fair Value Gap), which are important areas for sellers. This zone also acts as a Change in Polarization (CIP), making it crucial for a potential downward move.
Pattern:
🟢 Chart Patterns:
A Head and Shoulders reversal pattern has formed, with the neckline broken, indicating a strong bearish sentiment.
🟢 Candle Patterns:
Follow-up momentum candles have appeared as engulfing patterns at the neckline breakout, confirming the bearish trend.
Volume:
🟢 A significant increase in volume was observed at the breakout point, signaling that bears are taking control at this level. This strong volume supports the bearish continuation.
Momentum RSI:
🟢 The price has entered a super bearish zone with a perfect range shift.
There is a bearish divergence at the top, and the price has taken a strong rejection from the highest point with a loud move. This makes the pair more attractive for sellers, as the momentum favors a downward continuation.
Volatility Bollinger Bands:
🟢 The contraction phase has led to a squeeze breakout, with one candle already closing outside the lower band. The "walking on the band" phase is about to start at the lower band, indicating sustained bearish volatility.
Strength ADX:
Bears are stronger than bulls in every dimension, according to the ADX.
Rating: ⭐⭐⭐⭐⭐
All parameters are in favor of sellers, giving this setup a strong 5-star rating, indicating high confidence in the bearish continuation.
✔️ Entry Time Frame: H1
✅ Entry TF Structure: Bearish
☑️ POI: Mid-point mitigated
💡 Decision: Sell
🚀 Entry: 0.8668
✋ Stop loss: 0.8717
🎯 Take profit: 0.8310
😊 Risk to reward Ratio: 7RR
🕛 Expected Duration: 10 days
SUMMARY:
The analysis suggests a strong bearish setup with an entry at 0.8668, a stop loss at 0.8717, and a take profit target at 0.8310. The risk-to-reward ratio is 7:1, and the expected duration for the trade is around 10 days. All dimensions—volume, momentum, volatility, and strength—are aligned in favor of the bears, making this a high-confidence trade. Close monitoring is advised to ensure the trade remains within the expected parameter

7 Dimension Sell Analysis for EurGBPCore Analysis Method: Smart Money Concepts
😇7 Dimension Analysis
Time Frame: H1/M5
1: Swing Structure: Bearish with proper BOS after taking inducement and marking valid low. The price completed its corrective swing move with 4 pullbacks and a proper internal bullish structure, mitigating the extreme POI OB and sweeping swing liquidity in the Premier zone. It also swept external swing liquidity, making this entry more interesting with the Whale scoop entry setup.
Resistance: Supply area acts strong with a false breakout. Post-break buildup failed strongly, indicating that the price will go further down to form another low.
2: Pattern
🟢 CHART PATTERNS:
Reversal: Rounding bearish patterns and consolidation rectangle bear side breakout. Shakeout reversal also at the same point.
🟢 CANDLE PATTERNS:
Multiple long wick candles at the POI area, then breakout the range with a momentum strict engulfing pattern.
3: Volume
🟢 Shows very good volume at the resistance level, but this volume is unable to break the resistance, so we consider it an execution volume at the point.
4: Momentum RSI
🟢 Since the start of July, momentum has been in the bearish zone with multiple bearish range shifts and divergence, everything loudly indicating this is still in the bearish phase.
5: Volatility Bollinger Bands
🟢 Expansion has started just with momentum. Bearish headfake also indicates bearish volatility in this pair for now.
6: Strength: Showing weakness.
7: Sentiment: Everything is in bearish favor.
✔️ Entry Time Frame: M5
✅ Entry TF Structure: Bearish
☑️ Trend line breakout: Yes
💡 Decision: Sell
🚀 Entry: 0.8441
✋ Stop Loss: 0.8451
🎯 Take Profit: 0.8400
😊 Risk to Reward Ratio: 5RR
🕛 Expected Duration: 3 Days
SUMMARY: Analysis supports a strong sell position based on the Smart Money Concepts methodology, with expected bearish momentum and high potential reward.

Strong BUY IndicationBullish Trend Confirmation:
Higher Highs and Higher Lows: The price action is forming a series of higher highs and higher lows, indicating a strong bullish trend.
Trendline Breakout: The price has broken above a long-term descending trendline, signaling a potential shift from a downtrend to an uptrend.
Technical Indicators:
Moving Averages: The price is trading above key moving averages (e.g., the 50-period and 200-period moving averages), suggesting bullish momentum. A golden cross, where the 50-period moving average crosses above the 200-period moving average, is a particularly strong buy signal.
MACD (Moving Average Convergence Divergence): The MACD line crossing above the signal line and moving into positive territory indicates increasing bullish momentum.
RSI (Relative Strength Index): The RSI is rising and staying above 50, confirming the strength of the bullish move. However, it's not yet in the overbought territory, indicating room for further upside.
Chart Patterns:
Bullish Reversal Patterns: Formation of bullish reversal patterns such as a double bottom, inverse head and shoulders, or cup and handle.
Breakout from Consolidation: Price breaks out from a consolidation pattern (like a rectangle or symmetrical triangle) on high volume, suggesting the beginning of a new bullish phase.
Volume Analysis:
Rising Volume on Up Moves: Increased volume during price advances and lower volume during pullbacks indicate strong buying interest.
Volume Spikes: Significant volume spikes accompanying upward price movements, confirming the strength of the breakout.
Fibonacci Levels:
Retracement and Extension Levels: Price retracing to key Fibonacci levels (38.2%, 50%, or 61.8%) and showing strong support can provide a buy indication. Additionally, price targets can be set using Fibonacci extension levels.
Fundamental Factors:
Economic Indicators: Positive economic data or geopolitical events that favor precious metals as a safe-haven asset.
Market Sentiment: Overall market sentiment turning bullish towards commodities and precious metals due to inflation concerns, currency devaluation, or other macroeconomic factors.

7 Dimension Sell Idea For EURGBPCore Analysis Method: Smart Money Concepts
😇7 Dimension Analysis
Time Frame: H1/M5
1: Swing Structure: Bearish with proper BOS after taking inducement and marking valid low. The price completed its corrective swing move with 4 pullbacks and a proper internal bullish structure, mitigating the extreme POI OB and sweeping swing liquidity in the Premier zone. It also swept external swing liquidity, making this entry more interesting with the Whale scoop entry setup.
Resistance: Supply area acts strong with a false breakout. Post-break buildup failed strongly, indicating that the price will go further down to form another low.
2: Pattern
🟢 CHART PATTERNS:
Reversal: Rounding bearish patterns and consolidation rectangle bear side breakout. Shakeout reversal also at the same point.
🟢 CANDLE PATTERNS:
Multiple long wick candles at the POI area, then breakout the range with a momentum strict engulfing pattern.
3: Volume
🟢 Shows very good volume at the resistance level, but this volume is unable to break the resistance, so we consider it an execution volume at the point.
4: Momentum RSI
🟢 Since the start of July, momentum has been in the bearish zone with multiple bearish range shifts and divergence, everything loudly indicating this is still in the bearish phase.
5: Volatility Bollinger Bands
🟢 Expansion has started just with momentum. Bearish headfake also indicates bearish volatility in this pair for now.
6: Strength: Showing weakness.
7: Sentiment: Everything is in bearish favor.
✔️ Entry Time Frame: M5
✅ Entry TF Structure: Bearish
☑️ Trend line breakout: Yes
💡 Decision: Sell
🚀 Entry: 0.8424
✋ Stop Loss: 0.8436
🎯 Take Profit: 0.8363
😊 Risk to Reward Ratio: 5RR
🕛 Expected Duration: 3 Days
SUMMARY: Analysis supports a strong sell position based on the Smart Money Concepts methodology, with expected bearish momentum and high potential reward.

7 Dimension Buy Trade For USDJPY Core Analysis Method: Smart Money Concepts
😇7 Dimension Analysis
Time Frame: 15M
1: Swing Structure: Bullish with BOS after taking the inducement. Bullish impulsive swing move starts making a pullback in the internal structure POI liquidity zone. External POI OB FVG already taken from the discounted area.
🟢 Entry Model: Whale scoop
Support liquidity demand area might act as a reversal zone.
2: Pattern
🟢 CHART PATTERNS: No chart pattern is formed. Shakeout continuation.
🟢 CANDLE PATTERNS: No significant candle pattern here.
3: Volume: Volume is almost dry during the whole corrective move, but we observed huge volume when the price takes liquidity or forms a false breakout.
4: Momentum RSI
🟢 RSI is still in the bullish zone, taking support on the extreme bullish support 40 level. No range shift yet and not any bullish support divergence. A bearish loud move makes some doubt, but it will confirm when the price gives a proper breakout on any side in this momentum range.
5: Volatility Bollinger Bands
🟢 A strong contraction is forming. This contraction breakout will confirm the proper move.
6: Strength: USD is still weaker.
7: Sentiment: Buy for the short term.
✔️ Entry Time Frame: 15M
✅ Entry TF Structure: Bullish
✔ Entry time liquidity take waiting
💡 Decision: Buy
🚀 Entry: 157.170
✋ Stop Loss: 156.890
🎯 Take Profit: 158.275
😊 Risk to Reward Ratio: 4RR
🕛 Expected Duration: 1 Day
Short SUMMARY: Analysis supports a strong buy position based on the Smart Money Concepts methodology, with expected bullish momentum and high potential reward.

7 Dimension Sell Setup for Gold Technical Analysis Method SMC
** 7 Dimension Analysis**
Time Frame: H1 / 5M (Minute)
1: Swing Structure: Bearish
🟢 Structure Behavior: Choch, now at this extreme POI (Point of Interest) 🟢
🟢 Swing Move: Corrective (about to end) ↪️
🟢 Lower Time Frame (M1): Inducement is done. It's better to wait for M1 structure shift. ⛔
🟢 Internal Structure: Bullish yet ⬆️
🟢 Supply Area: Based on M5 timeframe 🟦
2: Pattern
🟢 CHART PATTERNS: No reversal chart pattern detected yet. ⬜
🟢 CANDLE PATTERNS: Record Session count
3: Volume
🟢 After a good rally, volume is drying up now. **
🟢 Volume during correction is less than impulsive volume. **
4: Momentum RSI
Current: Bullish to sideways with proper bearish divergence and range shift. **
5: Volatility Bollinger Bands
🟢 Middle band is interim support yet. 🟦
🟢 Price is currently in a contraction phase, making a Bollinger Band "W" pattern with the complete leg about to end. ➡️
🟢 High with a pin bar price also indicates a Band Puncher. **
6: Strength (ROC - Not Included)
7: Sentiment: Bearish for M5 SMC (Smart Money Concept) timeframe
✔️ Entry Time Frame: M5
✅ Entry TF Structure: Bearish
☑️ Current Move: Correction at extreme POI ☑️
☑️ Resistance Area: Gives multiple rejections ❌
☑️ Candle Behavior: Not clear ⬜
☑️ Trend Line Breakout: Waiting ⏳
** Decision:** Sell if price gives a breakout of the trend line ⬇️
** Entry:** 2381
✋ Stop Loss: 2387
Take Profit:** 2355
Risk-to-Reward Ratio:** 3.5
Expected Duration:** One day
SUMMARY:
Based on the multi-timeframe analysis, a potential short selling opportunity exists with a bearish bias. The current corrective move might be nearing its end at the extreme POI. However, waiting for confirmation from a bearish breakout on the M5 timeframe and a clear bearish candle pattern is recommended before entering a trade. Remember, this analysis should not be considered financial advice.

7 Dimension Trade Idea for NZDCAD😇 7 Dimension Analysis
Time Frame: H4
1️⃣ Swing Structure: Bullish
🟢 Structure Behavior: Breakout of Structure (BoS); Current market is in a sideways mood
🟢 Swing Move: Impulsive to sideways
🟢 Inducement: Done
🟢 Decisional OB: Mitigated, but discount area liquidity is unmitigated yet
🟢 Support: Holds the price for the 4th time, indicating strong demand
🟢 Trendline: Buildup, prebreak, and a potential spike for tapping extreme areas
🟢 Time Frame Confluence: H4, Daily, and Weekly
2️⃣ Pattern
🟢 CHART PATTERNS: Reversal, Rounding Patterns, Cup and Handle at both daily and H4 with strengthening buildup. Consolidation Rectangle makes this area interesting and demanding.
🟢 CANDLE PATTERNS: In this highly consolidated zone, no candlestick pattern is effective. Watch and wait until breakout, then analyze candle behavior at breakout levels.
🟢 Volume: High volume throughout consolidation indicates bull dominance. Watch for volume on breakout or fakeouts for a final decision.
4️⃣ Momentum RSI
🟢 Momentum: Totally sideways
5️⃣ Volatility Bollinger Bands
🟢 Volatility: Highly contracted
6️⃣ Strength According to ROC
🟢 Values: NZD is stronger than CAD
💡 Decision: Wait till breakout or fakeout, but in both scenarios, consider buy positions
🚀 Entry: Breakout at 0.8418 / Fakeout at 8292
✋ Stop Loss: Breakout at 0.8383 / Fakeout at 8275
🎯 Take Profit: 0.8978
2nd Exit if Internal Structure changes; also Exit on 3rd trendline breakout, FOMO
😊 Risk to Reward Ratio: 20
🕛 Expected Duration: 50 days
📚 SUMMARY: The analysis points to a bullish trend with a strong consolidation zone. Breakout or fakeout opportunities are highlighted, emphasizing a buy strategy. The risk-to-reward ratio is favorable, and a patient approach is recommended until decisive market movements occur.
