Search in ideas for "INDICATORS"

Indicators point to XLM falling but overall trend is bullishQuick simple chart for you here. Overall news has been great for Stellar and it seems as though XLM is great for a long term hold. Indicators suggest we may fall a little more although I would be very wary about shorting. Personally I believe the smart money would be buying once this dip is over and holding until the 4100 mark.
Yours Truly,
Tragic Shit

2015 BTC Bottom IndicatorsIndicators that marked the 2015 BTC bottom
- Weekly MA 90 Breakout
- Moving Average Ribbon Crossover
- Huge sell volume
Will it repeat?

Swing Trading with your Indicators of preferenceIndicators of preference -
Stoch RSI with the RSI and the Bollinger Bands.
Each of you have your own style.

$SPY Over bought, Indicators Are Heavy, Short term BearishIndicators are pointing to over bought, expecting to see a retrancement to the 275 area \

Indicators now aligned for parabolic price actionThis is a reliable bitcoin specific automated trading approach backed by quantitative and semi quantitative techniques.
Indicators optimized for 4 hour time frame:
-Momentum
-Volume profile
-MACD
-Bitcoin momentum
-Squeeze mometum
-Negative and positive volume index
-Bitcoin buy/sell volume across multiple exchanges
Not shown, but model backed by:
-USDT/USD ratios
-Directional trend analysis
-Bitcoin market dominance

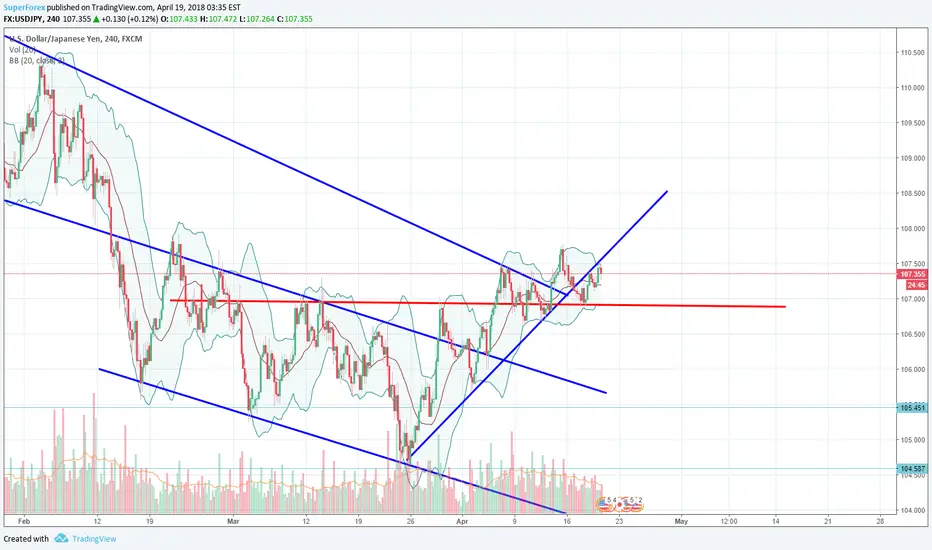
Indicators point to a growth of pairAt the moment, we are watching our pair come out of the descending channel and on the daily chart formed a "young" uptrend. And now the pair has found a new level of support.
In view of political unrest, the dollar is quite unstable. However, the current trend indicates a strengthening of the reserve currency.
Most technical indicators on the day and 4-hour time-frames indicate a purchase as well. Therefore, the trade council will take long positions from the support level and monitor the formation of an upward trend.
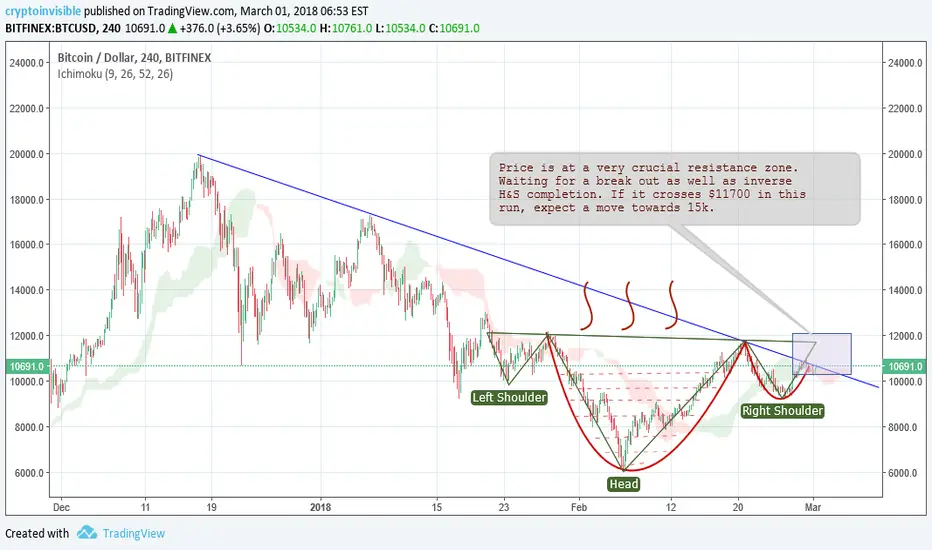
Indicators indicte a heavy bull run on its way(If H&S completes)$BTC has tried thrice to break out at around 11,200-11,700 zone in recent weeks and failed every time, it is trying once again and if it crosses 11700, which would ultimately create a break out as well as completion of inverse H&S pattern which might make it extra bullish.
Ichimoku, inverse H&S, cup&handle and MACD indicators look quite bullish,it needs some more volume to breach the resistance zone.
#DYOR
Indicators suggest coming uptrend RSI is at oversold levels, MACD is near a crossover, and the volume won't stay this low forever. All indicators suggest XLM is due for an uptrend. Happy trading!!

Indicators UpThere has been no new high yet but the indicators are pointing to the upside, so that a breakout may be expected.


possible long opportunity with CGEN stock + technical indicatorsprofit target at 6.60 USD. I suppose we have an HPS setup with the trend line divergences, the undersold stochastics indicator, the very much undersold relative strength index and the MACD line intersecting the signal line
It seems to me that it will bounce back off the support line one more time and possibly have a breakout over the resistance level. good luck to all. My personal opinion for this stock.

Indicators pick out the big tradeJust an example of how the Forex On Toast Sessions and ATRPlus indicators would have performed today on the big trade of the day.

Master Index: List of all my indicators ---------------------------------------------------------------------------------------------------------------------------------------
If you use any of these indicators regularly, appreciate a small donation :)
My Bitcoin address is : 1Cs5DJ7DGqYVBWaAt5rPuRcD66ULgVCFnx
My Amazon wishlist here : amzn.com
Ping me if would like other means of contributing to my tipjar.
---------------------------------------------------------------------------------------------------------------------------------------
Complete list of all my indicators in a Google Doc:
docs.google.com
*********************************************************************************************
******** NOTE: Below information is NOT complete and not updated anymore **
******** Please refer to the Google Doc above for all my latest indicators **
*********************************************************************************************
New indicators added: 18
Pointer to new indicators: www.tradingview.com
Total count: 142
New indicators added: 10
Pointer to new indicators: www.tradingview.com
Total count: 124
New indicators added: 7
Pointer to new indicators: www.tradingview.com
Total count: 114
New indicators added: 6
Pointer to new indicators: www.tradingview.com
Total count: 107
New indicators added: 6
List of indicators added: www.tradingview.com
Total count: 101
Reached 3 digits, yay!
New indicators added: 7
List of indicators added: www.tradingview.com
Total count: 95
New indicators added: 11
List of indicators added: www.tradingview.com
Total count: 88
New indicators added: 7
List of indicators added: www.tradingview.com
Total count: 77
List of indicators: www.tradingview.com
Description section does not allow me to list all indicators. So, I will be posting them in the comments. Total count : 70
Some of these indicators are my own concoctions, so very unique to TradingView.
Hope you find at least one that you like / makes you money :)
Feel free to PM me any new indicator requests.
This list is also available in Google docs: docs.google.com
--- LazyBear
-------------------------------------------------------------------------------------------------------------------------------
How to import / use custom indicators published by others (PDF):
drive.google.com
For the links with source on PasteBin, use this video (Thx @ChrisMoody) for importing the indicators:
blog.tradingview.com
Another walk-through on how to import / use indicators with sources posted on Pastebin (PDF):
drive.google.com
-------------------------------------------------------------------------------------------------------------------------------

with or withoutI like my Indicators, but only use indicators when you can make good trades without indicators... might sound strange but that is what i found out.
Also trading performance gets better when you can create you own indicators.

Bullish Gold: Recent Signals Point to Upward Momentum** Bullish Gold: Recent Signals Point to Upward Momentum **
Gold has been displaying strong bullish tendencies lately, and our latest analysis suggests that the price may continue its upward trajectory toward the next resistance level. After carefully analyzing the charts across multiple timeframes, from 1-minute to 45-minute intervals, we’ve identified compelling signals that favor a continuation of this upward movement.
**Key Observations**
1. **Technical Indicators:**
Recent price action shows a series of higher lows and consistent testing of key resistance zones. This structure aligns with a bullish trend, signaling strong buying pressure in the market.
2. **Momentum Analysis:**
Momentum indicators, such as the Relative Strength Index (RSI) and Moving Averages, confirm a positive trajectory. On smaller timeframes like 1-minute and 5-minute charts, gold has shown consistent breakouts during intraday trading, indicating sustained interest from buyers.
3. **Volume Support:**
Volume spikes during upward moves suggest institutional activity, further supporting the bullish case. Price movements are backed by strong participation, which enhances the reliability of the trend.
4. **Resistance and Next Targets:**
If gold maintains its current pace, the next key resistance level lies at . Breaking through this zone could open the door to higher price levels in the short term.
**Fundamental Context**
The recent strength in gold prices is supported by market uncertainty, with investors seeking safe-haven assets amidst global economic concerns. Additionally, a weaker USD or dovish signals from central banks can further fuel gold’s rally.
**What’s Next?**
We’ll continue to monitor the charts and provide updates as the situation evolves. The current bullish sentiment aligns with both technical and fundamental factors, suggesting that gold’s rally still has room to grow. However, traders should watch for any signs of reversal near key resistance levels and manage their risk accordingly.
Stay tuned for more updates as we track this movement closely!

Weekly Leading Indicators: BEARISHManaged to streamline down to these couple of charts for a set of leading indicators. Simple trend analysis and techincals are being used here for Weekly charts and so weekly analysis is appropriate to set the stage for a top down view.
First up (on the top right corner) is the Combined US equities chart that shows a strong marubozu the previous week (from elections outcome). However, the following week was not a confirmation, but instead casts doubt on the sustainability of the spike to rally on.
Point being, the massive breakout is met with a Dark Cloud Cover that breaks back into the Decision Box (purple box) which was previously marked out for the consolidation range boundaries. Typically when a breakout is followed by a breakin, it tends to follow through to the other end... a break down from the box support. Yellow circle is where it should go through or bounce at.
What gives on this is that the following Leading indicators are eluding to...
SG10Y Govt Bond Yields
The uncanny correlation of this to the US Equities Indexes is remarkable and have been a hallmark of my recent posts and analyses. Here we have a breakout of the trendline resistance. Means equity markets are going Bear.
RED Flag
High Yield Bonds ETF (JNK)
JNK looks to break the uptrend trailstop line, with a lower high that now has a Dark Cloud Cover as well.
AMBER Flag
TIPS and TLT
Both have broken uptrend trailstops and are downtrending with a recent low. These are well known market leading indicators.
RED Flags
Semiconductor ETF (SOXL)
Noted, and personal favourite, SOXL is clearly bearish from simple candlestick patterns.
RED Flag
So, overall, we have Leads telling us it is BEARISH again.
Heads up!

TV 4 - 3 indicatorsTV 4 TV 4 - 3 indicatorsTV 4 - 3 indicatorsTV 4 - 3 indicatorsTV 4 - 3 indicators

BTCUSD 4HR Indicator SetIndicators: 4hr time frame analysis
EMAs:
High Time Frame
-71 day EMA (426 point) blue thin 1
-81 day EMA (486) blue thin 2
-100 day EMA (600 point) blue thick
-150 day EMA (900 point) red thin
-200 day EMA (1200) red thick
Medium Time Frame
-14 day/2 week EMA (84 point) white dotted
-21 day/3 week EMA (126 point) yellow dotted
-28 day/4 week EMA (168 point) grey dotted
-50 day EMA (300 point) yellow thick
-64 day EMA (384 point) yellow thin
Low Time Frame
-1 day EMA (6 point) grey step line
-3 day EMA (18 point) light grey thin
-5 day EMA (30 point) light grey thin
-7 day/1 week EMA (42 point) grey thin
-10 day EMA (60 point) grey thin
Sigma Trend Bot Analysis (HullMA, close, 0, 21, 1, 0.7, 1D, HullMA, open, 0, 21, 1, 0.5)
-Deviation and Trend Tolerance Bands (Turquoise Bands, Turquoise Dots, White Step Line)
-buy/sell signal scalps to basis line (white step line)
-trend direction (bullish/bearish) with trend strength and weakness
-blue = strong bullish PA, light blue = weak bullish PA, red = strong bearish PA, pink = weak bearish PA)
-Heikin Ashi candle outline to show normal candle color(green(bullish), red(bearish))
-confirm on candle close (every 4hrs)
Ichimoku Cloud (20/60/120/30)
Kijun Sen- Dark Red
Tenken Sen- Light Blue
Lead Strand A
Lead Strand B
MA Duplicates (with color change)
red and green dots help to show low time frame support and resistance
red and green color change line is the high time frame momentum tracker (sometimes can be used as support and resistance)
Gainzy DIvs
low and normal time frame strength
red/green gainzy divs weak/low time frame
yellow/blue gainzy divs strong/normal time frame
SAR
white dots above and below price action to show overall current trend direction
enjoy.

(MRK) - Navigating Through Market Signals and IndicatorsAbstract:
We perform a comprehensive technical analysis of Merck & Co., Inc. (NYSE: MRK) by dissecting its latest price movements, chart patterns, and technical indicators. This analysis is aimed at shedding light on the potential future price trajectory for MRK, integrating both traditional technical analysis tools and advanced indicators to inform speculative positions.
Price Action and Chart Patterns:
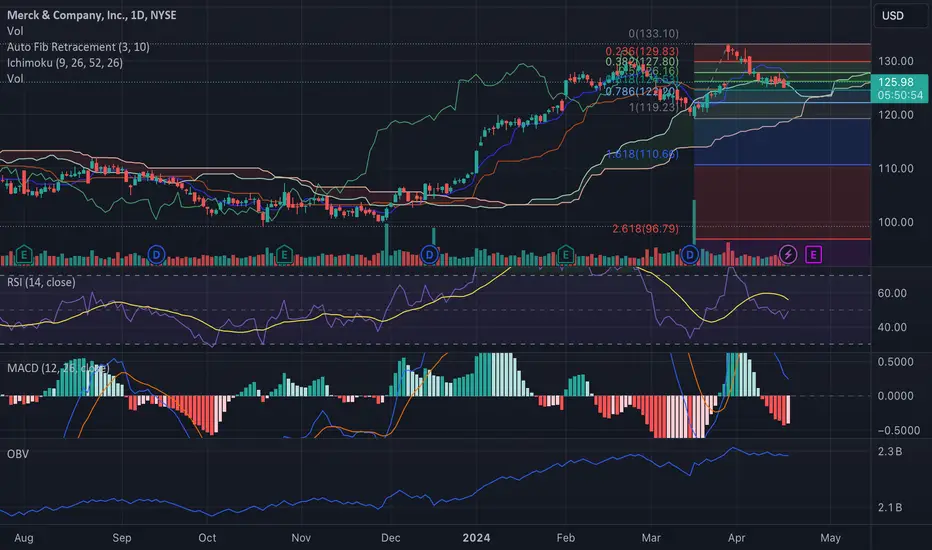
The recent price activity of MRK demonstrates a consolidation phase with a slight bearish inclination. The stock has been traversing within a narrow range following a significant uptrend, as evidenced by the series of higher highs and higher lows from November 2023 to February 2024. The latest candles are positioned within the Ichimoku cloud on the daily chart, which hints at a potential trend ambiguity in the short term. However, the presence of a 'doji' candle followed by a minor bullish candle may suggest an indecision in the market sentiment that precedes a possible trend reversal.
Ichimoku Cloud:
The Ichimoku Kinko Hyo, a pivotal component in our analysis, indicates a transition phase. With the price oscillating within the cloud (known as 'Kumo'), we are in a state of equilibrium, where the bullish and bearish forces are balanced. A decisive breakout above the cloud could signal a bullish continuation, while a drop below the cloud would align with a bearish forecast.
Fibonacci Retracement Levels:
Using the swing high at $133.10 and swing low at $110.65, we observe that the price recently retraced to and slightly surpassed the 0.236 level at $129.83 before recoiling. This behavior showcases the market's respect for Fibonacci retracement levels, often viewed as potential reversal zones.
Moving Averages:
The 50-day and 200-day Moving Averages (MAs) are trending upwards, confirming the general bullish bias in the medium to long term. The recent price action around the 50-day MA suggests this level as a dynamic support.
Volume and Volume-Based Indicators:
The On-Balance Volume (OBV) shows a steady rise, which typically indicates accumulative behavior and can be a precursor to a positive price breakout. This is in congruence with the increasing volume bars seen in recent trading sessions.
Relative Strength Index (RSI) and Moving Average Convergence Divergence (MACD):
The RSI hovers around the 50 mark, which is considered neutral territory, although it has descended from overbought conditions. The MACD line is about to cross above the signal line, and the histogram is moving upwards towards the zero line, both suggesting that upward momentum may be gaining traction.
Price Target Speculation:
Assuming the bullish scenario where the price breaks above the Ichimoku cloud, our speculative price targets are set at the Fibonacci levels of $133.10 (0 level) as the first target, and a breach above this level could lead the stock towards the all-time high at $139.00. Alternatively, a bearish downturn would initially aim for the support around the $122 level, coinciding with the 0.786 Fibonacci retracement and the top boundary of the cloud.
Earnings Report:
With the next earnings report due in 8 days, market participants should exercise caution as the release could significantly impact the stock's volatility.
Market Sentiment and Conclusion:
MRK's stock performance is at a crossroads, with technical indicators providing mixed signals. Investors should monitor the key levels indicated by the Ichimoku Cloud and Fibonacci retracements. While the upward momentum could be resurfacing, as suggested by the MACD and OBV, the forthcoming earnings report may serve as a catalyst for a definitive price direction. Prudent traders may consider setting tight stop-loss orders to mitigate risk in the face of potential earnings-induced volatility.
M15 Comparative Analysis : US Oil ↔ UK Oil (with 4 indicators)Here, a comparative analysis of US Oil (West Texas Intermediate)
and UK Oil (Brent) on a 15-minute chart (M15).
US Oil on the left and UK Oil on the right.
The four indicators are the main indicators used at ADX-BRIEFING.
- Top indicator (directly below price window): modified MACD
- 2nd indicator: modified ADX
- 3rd and 4th indicators: modified momentum indicators.
The modified MACD indicator (on both markets) has been in the BUY zone
since November 16, 2020 and is still in the BUY zone as of now.
The modified ADX indicator is in a downtrend and this means that right now,
we have a consolidation.
We are waiting for a turn-around on this indicator which would indicate
that we have a new significant move on the way.
As of now, this is a waiting period, when considering this higher 15-min time-frame.
Indicator #3 on both markets, is still in the BUY zone
and now is a risky time for a long-term short trade.
Indicator #4 is in the neutral zone between the BUY zone and the SELL zone.
Conclusion:
On the 15-minute time-frame, there is no clear signal for either a BUY trade or a SELL trade.
I will add, in the comments section, more detailed analysis, related to the time-frame we are actually using for trades.
François Normandeau
Institutional Research Director
ADX-BRIEFING
This post can also be found on:
www.adx-briefing.com

Potential bottom formation with bullish indicators.Order Type: Buy Stop
Entry Price: 0.8840 (to confirm breakout beyond immediate resistance and capture potential upwards momentum)
Take Profit: 0.8900
Stop Loss: 0.8800
Confidence Level: 74%
Justification:
Price Action: Potential bottom formation with bullish indicators.
Volume: Increased volume at lows suggesting accumulation.
Indicators: Bullish crossover on MACD and widening Bollinger Bands suggesting an impending bullish movement.
Support and Resistance: Entry above resistance ensures capturing upward breakout, with stop loss below immediate support for risk management.

Example of how to effectively use auxiliary indicatorsHello, traders.
If you "Follow", you can always get new information quickly.
Please also click "Boost".
Have a nice day today.
-------------------------------------
The StochRSI < 80, StochRSI > 20, OBV, -100, +100, RSI < 70, RSI > 30 indicators included in the HA-MS indicator are indicators that express the formulas of each basic indicator by modifying them.
These indicators can be intuitively confirmed by expressing each indicator on a price candle, and can be used as support and resistance points for detailed trading strategies.
-
(1M chart)
The most frequently referenced RSI indicators have been added to be drawn on price candles as RSI < 70, RSI > 30 indicators.
Therefore, if the price is maintained above the 3014.05 point, it can be interpreted that the RSI indicator is in the overbought zone.
Therefore, the 3014.05 point corresponds to the support and resistance zone.
-
The +100, -100 indicators are indicators that express the CCI indicator.
The CCI indicator interprets the -100 to +100 range as a sideways range based on the 0 point.
If it rises above +100, it is interpreted that it has escaped the sideways range and formed an upward trend.
If it falls below -100, it is interpreted that it has formed a downward trend.
Therefore, if it rises above the 3762.29 point, it should be interpreted that it is highly likely to form an upward trend.
Therefore, if it rises above the +100 indicator point, you can conduct a breakout trade.
-
If you understand the concept of the above indicators, I think you can create a trading strategy with just these indicators.
-
The HA-High indicator is formed at the 3321.30 point, so the most basic standard is the 3321.30 point.
Therefore, you should set the 3321.30 point as the standard and use the support and resistance points of the above indicators to create a trading strategy that suits you.
The trading strategy may vary depending on your investment period, investment amount, average purchase price, etc.
Even so, the HA-High and HA-Low indicators can be the standard for the chart, so you should consider the location of these indicators.
-
(1W chart)
It is currently continuing to rise within the rising channel.
Therefore, the key is whether it can rise along the rising channel.
-
The 3265.0 point and the 3321.30 point are the HA-High indicator points of the 1W and 1M charts.
Therefore, the area around the 3265.0-3321.30 section can be seen as the standard for trading.
Therefore, if it falls below the 3265.0-3321.30 section, it is highly likely that it will fall further.
However, the 3014.05 point is the RSI < 70 indicator point of the 1M chart, so if the price is maintained above 3014.05, it is likely that it will continue to rise in the long term.
Therefore, if it falls below the 3265.0-3321.30 section, it is necessary to check whether there is support in the 3014.05-3136.41 section.
-
(1D chart)
Currently, the HA-High indicator of the 1D chart is formed at 3787.59.
Therefore, in order for a full-scale uptrend to begin, the price must be maintained above 3787.59.
-
The +100 indicator is formed at 3523.09.
Therefore, in the short term, it is highly likely that an uptrend will be formed if it rises above 3523.09.
If not, the movement is likely to continue in the sideways section of the CCI indicator.
-
As above, you should look at the charts in order of 1M, 1W, and 1D charts, interpret them comprehensively, and create and modify your trading strategy by considering your average purchase price or investment period.
Again, among the indicators on this chart, the most basic indicators for trading are the HA-High and HA-Low indicators.
To find out the basic trend, you can check the movement of the MS-Signal indicator.
-
Have a good time.
Thank you.
--------------------------------------------------
- Big picture
The real uptrend is expected to start after rising above 29K.
The area expected to be touched in the next bull market is 81K-95K.
#BTCUSD 12M
1st: 44234.54
2nd: 61383.23
3rd: 89126.41
101875.70-106275.10 (overshooting)
4th: 13401.28
151166.97-157451.83 (overshooting)
5th: 178910.15
These are points where resistance is likely to occur in the future.
We need to check if these points can be broken upward.
We need to check the movement when this section is touched because I think a new trend can be created in the overshooting section.
#BTCUSD 1M
If the major uptrend continues until 2025, it is expected to start forming a pull back pattern after rising to around 57014.33.
1st: 43833.05
2nd: 32992.55
-----------------
