IOTA 1D BUYIOTA 1D support is at ~$1.35
Enter 50% here
and try to set some buy orders near the support zone
If IOTA holds above the trendline,
the Take-Profit target would be $1.48, $1.62, and $1.89
Cheers
Search in ideas for "IOTA"

IOTA/USDT Ready for $5 ( 240% ) from here.?#IOTA/USDT TA Update:-
$IOTA currently trading at $1.34
If #IOTA breaks $1.60 then we can sew $IOTA Target $5 (240% )
Entry..?
I am buying some $IOTA here and if break down Support 1 then next Wntry will be $0.8-$0.9
Targets:- $2/$2.5/$4/$5
Stop Loss:- Will update

IOTAUSDT (4h Chart) - Trend Breakout!IOTAUSDT (4h Chart) Technical analysis
IOTA/USDT (4h Chart) Currently trading at $1.59
Buy level :Abow $1.57
Stop loss: Below $1.42
TP1: $1.77
TP2: $1.92
TP3: $2.12
Max Leverage 3x
Always keep Stop loss
Follow Our Tradingview Account for More Technical Analysis Updates, | Like, Share and Comment Your thoughts.

IOTA looking weak - slowly climbing to 0.3IOTA looking weak - slowly climbing to €0.3
The former top 10 player (end 2017/18) looks like a failing project by it's chart.
Unable to show signs of strength in a market that is clearly on an all out bulls race IOTA is even failing to break out the Keltner Channel or break the Ichimoku cloud conversion line.
I would argue the market is clearly showing they are not that interesting the IOTA and letting it simmer at around #35 in terms of market cap.
Looking at the market cap from a historic perspective IOTA's weakness becomes even more evident:
Clearly the project is failing for investors to back the crypto coin and it remains a niche player.
To be fair I have not read up on all of IOTA's news (IOTA year in review article translation below), but from what I gather it was a tumultuous 2020.
Maybe the project has potential. For now it appears unattractive.
--- IOATA's year in review
From the involuntary Coordicide to the Trinity Hack, international cooperations, to developer disputes and the approaching 2.0 upgrade: IOTA has an exciting year in its bones. In the big review of the year, we take a look back and review the most important stopovers on the long way to IOTA 2.0.
IOTA started the new decade a little badly. The Internet of Things project had problems with the coordinator again between 2019/20. The bad news: The central instance in the IOTA network suddenly couldn't create new milestones, transactions were waiting for their final confirmation. The developers got the problem under control quickly, but the start of the new year could have gone more smoothly for the Tangle network.
IOTA with starting difficulties
Shaken off the legacy of the brief Tangle standstill, IOTA headed straight for a new conflict, this time not of a technical, but of a personal nature. There was a crash between developers Sergey Ivancheglo and David Sønstebø, where everyone could hear it: on Twitter. It concerned the outstanding MIOTA amounts that Sønstebø owed the former developer. Actually not a message that directly affects the development of the Tangle network. But the external impact of publicly fought mud battles always falls back on the projects behind them, especially since this should not be the last dispute with Sønstebø, the developer with the distinctive facial hair. But more on that later.
Apart from these frills and furbelows, there were also some success reports at IOTA. Together with the Eclipse Foundation, the IOTA Foundation set up the Tangle EE working group in February. The aim of Tangle EE is the development and industrial adaptation of Tangle-based applications. The working group forms an interface between research and industry and thus accelerates the constant commercialization of IOTA technology.
Trinity Hack puts Coordinator in a coma
But then the next setback: On February 12th, the Trinity Wallet, managed by the IOTA Foundation, fell victim to a hack. The loot: MIOTA tokens worth around 2.3 million US dollars. The attackers used a security breach in the connection to the payment service provider MoonPay to gain access to 50 seeds. The Foundation responded by disabling the coordinator (again) - The Tangle was silent. IOTA investors were able to secure their deposits using a seed migration tool, but the project was still subject to damage to its image, and IOTA was stuck in a crisis of meaning.
The resuscitation of the coordinator took almost four weeks. No value transactions were possible during the period. The IOTA Foundation not only struggled with technical problems, but above all with a loss of confidence in the Tangle project, but tried to limit the damage. David Elseebø jumped in and compensated all cheated investors out of pocket.
MIOTA course crashes
The first quarter of 2020 was therefore more of one that fell under the “wipe your mouth, carry on” category. While the IOTA Foundation was slowly able to concentrate on its core business, the development of the coordinator-free Tangle architecture, the MIOTA course gradually went downhill. Triggered by the Trinity hack and fueled by the corona-related wave of sales at the Krypto-Mart, the digital currency went straight on a dive and lost two thirds of its value in just one month. From $ 0.33 on February 12, MIOTA fell to $ 0.11 by March 13.
With new strength
After a turbulent first quarter, IOTA remained relatively quiet in Q2. In the second half of the year, however, the project should pick up speed again. Hornet, the new software for network nodes, mastered the stress test in the Comnet test network at the beginning of June brilliantly. Hornet replaces the previous node software IRI and thus forms a further component in the Coo-free Tangle network. However, since it is easy to lose track in the tangle of tangles, the Foundation introduced a new nomenclature in July for the sake of simplicity. The register of terms serves as a guide and assigns the respective milestones on the way to the coordicide to different phases, from pollen to nectar to honey.
With the TM forum, the Foundation announced a cooperation with the powerful alliance of over 850 companies just a few days later. The TM forum represents communication service providers, telephone companies, network operators, cloud providers, software developers and management consultancies worldwide with an annual turnover of more than 2 trillion US dollars. IOTA contributes the infrastructure for data exchange.
On the way to IOTA 2.0
The EU has also recognized the potential of Tangle technology in the expansion of e-mobility and decentralized energy supply and named IOTA as the “Key Innovator” for participating in the CityxChange project in August as part of “EU Horizon 2020”. With the implementation of Chrysalis Phase 1, IOTA also passed another milestone towards IOTA 2.0 a few days later. In this regard, IOTA Streams, a framework for sending and receiving messages and data streams, was also able to look forward to a new update. With the integration of important beta functions, the processing time could be increased by 100 times.
The pre-alpha version for the IOTA Smart Contract Protocol (ISCP) presented in October, with which IOTA could gradually compete with Ethereum for the implementation of smart contract-based applications, is also to be rated as a success. With the latest node software for pollen, which was integrated in October, the project has taken a big step towards 2.0. But despite the subsequent alpha release of IOTA Identity, a framework for decentralized identities, the introduction of the new wallet Firefly and the announcement of a number of partnerships, including With the Vienna University of Technology, ClimateCHECK and the Japanese organization NEDO, another message should burn itself into my mind: the separation from IOTA co-founder David Sønstebø. Differences of opinion and “significantly different interests” in relation to IOTA would ultimately have led to the amicable expulsion of the former chief developer. The decision was partly welcomed by the loyal IOTA following, as dealing with Sønstebø was considered rather difficult.
Big goals
It remains to be seen to what extent the separation from Sønstebø falls back on the schedule of the Coordicides, i.e. the final shutdown of the coordinator. IOTA took a big step towards 2.0 in 2020, the network has never been so close to its decentralization. We can therefore look forward to all kinds of developments and products in the New Year that will make the vision of a Tangle-based Internet of Things more and more a reality. The biggest chunk on the way there, the coordinator, should become history in the coming year. By then at the latest, IOTA will be able to demonstrate its undisputed great potential for applications in industry, science and research.

IOTA/BTC (Back at Key Support, Will Start new trend?)IOTA/BTC
-the is price back at the previous resistance zone
-and has the potential to flip new support
-it has also broken the downward trendline
-but there is a minor resistance at 2400s level
-I recommend buying only if we can break/close above 2400
-your target is the recent top at the 2700s or higher
-stop loss is placed under the 2300s

IOTA - Hopium, Hopium, and Hopium...IOTA is looking slightly bullish on the daily timeframe as it is about to break out of the triangle. Not to mention, bulls did an amazing job defending the daily MACD cross right at the zero mark.
On the weekly timeframe, we can see the RSI making a potential inverse head and shoulders pattern. Similar to every inverse head and shoulders pattern, we must wait for the break of neckline resistance as confirmation.
Using a variety of synthetic currency pairs, we can compare the strength/weakness between IOTA and other cryptocurrencies. In this example, we will use synthetic pair IOTUSD/NEOUSD which simplifies into IOT/NEO.
There's a very visible bearish divergence in MACD, RSI, and Stochastic. There's a possibility that money from algo traders that are trading synthetic currency pairs may go into IOTA due to its temporary weakness against other cryptocurrencies. But keep in mind, this is simply a method to compare the strength/weakness between two highly correlated asset. USD value of IOTA does not necessarily have to go up in order for IOT/NEO to go down.
Using IOT/ETH pairing, we could see that we're approaching a long term support trendline with a double bottom starting to form. This further supports my point in IOT/NEO: IOTA should theoretically gain strength compared to other cryptocurrencies in the coming days or weeks.
Just like every single double bottom, a retest of the neckline is necessary. The neckline support must hold or else it would indicate that IOTA is still too weak.
Feel free to share your long-term bearish ideas, it's always good to know both sides.

IOTA correction down to 1.5$ rangeIOTA had a massive move up due to the recent new.
Like they say buy the rumour and sell the news
IOTA is doing ABC zigzag now. Wave A is almost finished, expecting a bounce soon to complete wave B and then a final 5 waves down to finish off C leg.

IOTA Sell the breakdown.IOTA - Intraday - We look to Sell a break of 0.7744 (stop at 0.7922)
Short term momentum is bearish.
Pivot support is at 0.7745. A break of 0.7745 is needed to confirm follow through negative momentum.
There is no indication that the selloff is coming to an end.
Our profit targets will be 0.7232 and 0.7132
Resistance: 0.8000 / 0.8300 / 0.8500
Support: 0.7800 / 0.7500 / 0.7300

IOTA - Bullish Neckline Breakout, 25% Gain IncomingIOTA has completed an inverse head and shoulders pattern on its daily chart and is on its way upward. Bullish daily MACD and RSI, I'll be looking around the .00004-42 level as my target. Price is finding some resistance, so we may have a minor pullback before moving higher.

IOTA showing signs of life! IOTA might be ready to make a run for it here with volume showing up past few days
We would need for it to closed above resistance and retest it as support before entering
Only then can we target local highs, which is a strong possibility if BTC starts to pullback and money flows into alts

IOTA READY TO BREAK OUT OF THIS PATTERN? - CryptoManiac101IOTA is a great coin with new partnerships, however pattern we are working has is not an easy one in current market. According to this particular pattern we have over 60% probability to see upward break, however if Bitcoin remains under $6,500 we will see a possible downward break.
Recommendation
Investors looking for safe entry, wait for firm break, then do tight Stop Loss.
Current investors should set SL at rising line with rebuy order at demand zone thereafter.
Please remember that only firm break counts. We have many false breakout this year, so don't do automatic SL.
We are neutral on this trade until Bitcoin goes into recovery.
Enjoy this trade my Crypto Maniacs, but remember to invest only what you can afford to lose or you're going right back to poverty on drop. We are not your financial advisors.

IOTA: LongggIOTA has formed a symmetrical triangle that will most likely break out on the 5th touch (purple rectangle ). Based on that makes IOTA a great buy position.

IOTA: Under Water 🤿IOTA has jumped off the cliff at $0.9810 and dived into the green thicket of sea weed between $0.8968 and $0.7442. Here, it has been swimming along for a while now, watching the wildlife of the underwater world. We expect IOTA to go a bit deeper still and to finish wave c in orange just below the green thicket. Then, the dive should be over and IOTA should resurface above $0.9810. From there, long-term rise is possible again.
As they are still uncharted, though, IOTA could find something interesting in the depths below the green sea weed thicket and dive below $0.5736 to examine it. The results could then even lead to a continuation of the dive further down. This alternative scenario is rated with a probability of 45%, after all.

IOTA/BTC TA Update (Big Bounce at key support?)IOTA/BTC
IOTA price has now reached the 0.618 Fib support and an area of confluence plus descending trend-line support.
There is a high probable chance of bounce will happen in this area especially when RSI is approaching oversold condition.
We could expect some price action to happen within a week.

IOTA: From Bear To BullIOTA Has finished wave 1 according to my elliot wave count.
A falling wedge has formed which is a bullish fractal and can confirm the trend reversal once a breakout happends.
We can expect an impulsive wave 3 these coming months.

IOTABTC Making Bullish MovesIOTABTC which is up around 30% so far in January has broken above the 200 day moving average for the first time in 10 months.
The idea of Coordicide is starting to be positively received by the crypto community as more people are understanding the plan and implications.
Has the year of accumulation for Iota come to an end? Maybe..

#IOTAUSD will break $2 soonIOTA seems to be bullish and is riding on Elliot wave 1.
It will break $2 and reach target of 2.1 soon in next few hours.

IOTA, IOTABTC - Looking Quite BullishIOTA, IOTABTC a popular top 10 coin and has had a huge run-up last year so let's see how it's doing at the moment.
Analyses
- After a good consolidation and retracing all the way back to the .618 - .65 fib area. This is a good area for support and some buying action.
- IOTABTC did manage to break out of the fallen wedge pattern rather forcefully.
The spike was not only lead by the overall market sentiment but also due to some great partnerships announcements such as with the United Nations, Richard Soley and DNB ASA in Norway. This could drive the price up more in the coming days/weeks.
- A big and forceful spike is very indicative for a wave 3 so if that's the case then we're in an (impulsive) wave 3 of a bigger degree wave 5 at the moment as outlined in the chart.
- And if we look at the bigger picture, IOTABTC is looking to make a (big) cup & handle pattern so look for a break out of this pattern as well.
So there you have it, a brief perspective for IOTABTC. Leave a comment if you have any questions.
Like the post, if you liked it and share it if you loved it. This is for good karma.
And until next time, good luck with your trading!
Disclaimer
This information is not a recommendation to buy or sell. It is to be used for educational purposes only.

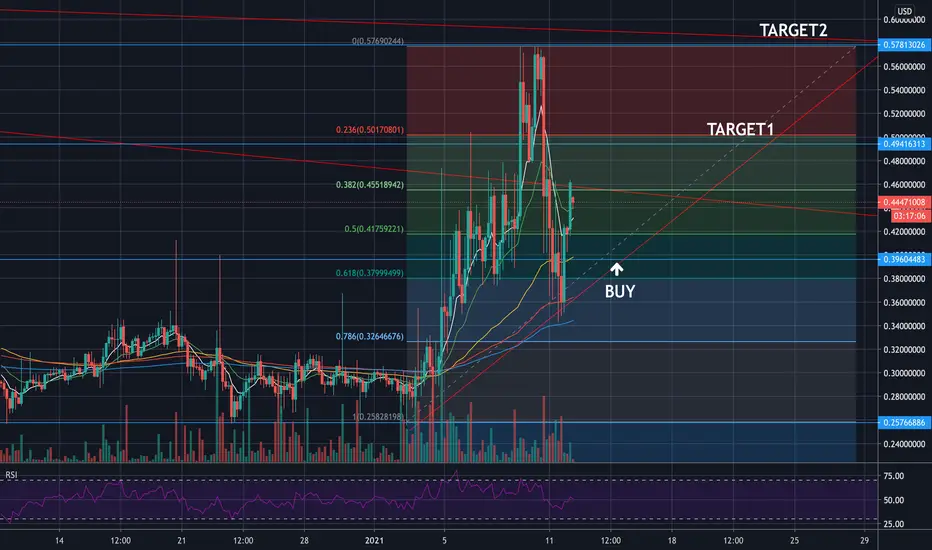
IOTA - entry levels LONG and TP targetsIOTA went down after the big sellout on cryptomarkets, so I had an opportunity to BUY IOTA cheaper. Here you have entry-level for those who did not catch the bottom. You can jump in at $0.397659832.

IOTA long downtrend on the verge of breaking upward.IOTA is reversing after years of downtrend, even though many old alt coins are pretty much higher then their lowest point (still long way till ATH), but IOTA just started to breakout.
*** Do your own research.
*** This is just my own analysis, not an investment advice.

IOTA When I see you like this, Its all coming back to me Now! Iota has broken out and has retested the trendline, Its take Profit time. What does this mean Padawan
Hand me my Lightsaber
Leverage 20x
Entry- 0.6525-0.6623
Stop 0.6365

IOTA rising slowly with no signs of exhaustionIOTA has had the classic full cycle pattern in USD terms and extreme capitulation in BTC terms. The IOTABTC chart is telling us much more than the one on the USD chart, and currently seems like accumulation ending with a wyckoff wick & spring, ready to blast above this triple top from the accumulation.
IOTA overall is a project I wouldn't trust and I'd put it in the league of XRP and some others. I don't think it is functional, but somehow it also has a following behind it and its development team is very active. Anyways, price says up, so up!
