NIFTY 50 -Head and Shoulder Nifty 50 forming Head and shoulder pattern in daily time frame.
today nifty may gap down due to global market negative sentiment. and it is forming H&S in daily time frame which also add the fuel to downfall. This is my personal view that i am analyzing done for my self and not intended to motivate to do trade on my analysis basis.
please feel free to share your comments aswell.
Disclaimer:
The information and publications are not meant to be, And do not constitute, investment, financial, trading, or other types of advice or recommendations supplied or endorsed. it is purely education purpose only.
Search in ideas for "NIFTY 50"

Nifty 50Nifty 50 Chart Analysis........16/08/23
Nifty Sell 19250 lvl.
Sl - 19325,
Target - 18950
==========================
Trend reversal above 19650 lvl.
Enjoy !

Nifty 50 trend forecast,big bubble to bursts... Nifty 50 trend forecast,big bubble to bursts...
Nifty trend gonna divert it's direction from North to South. Let's see if support works or not. Looking strong bearish reversal.
My tgt will be 19280-19000-18680.

NIFTY 50 ChartNifty 50 chart
where we can clear seee that it falls down and now it is going straight in upside if once it get reject and make a big selling candle or red candle then I am expecting again a big fall in down side. Bulls trying hard to go up but Bear waiting for a good chance and they will blow in down side like BOOOM BOOOM>
all will happen below 19470

Nifty 50 trade set-up for tomorrow Nifty 50 trade set-up for tomorrow.
1. Nifty is going towards dynamic Trending resistance.
2. Head and shoulder pattern.
3. Harmonic abcd pattern activation above B point.

NIFTY 50 Forming Acending triagle NIFTY 50 Forming Acending triagle
If Nifty will open below 19588 then we will expect target is 19500. Must put proper Stop Loss and trade

Nifty 50 Pre Market Level's Nifty 50 Chart Analysis Pre Market Level's. Nifty Perfection Level's Market

Nifty 50 hourly sideways trend analysisNifty 50 hourly trend analysis
nifty hourly trading in a very small non tradable range
so waiting for break either side for fresh trade
currently absolutely no volatility in to the price
only 100- 125 range is absolutely no tradable
so sitting sideline and waiting for break either side
specially in a down word is a good trade from here

NIfty 50Nifty 50 gave a breakout from the trendline and a reversal is forming wait for the right entry

NIFTY 50NIFTY 50 overview
Double bottom formation in NIFTY .
Anyone can go for long with a stop-loss 17750 for next week .

NIFTY 50 trading ideasNIFTY 50 very very strong resistance 🔥18141 and 18000 key resistance if comes below 17800 definitely sell as per my view it can open gap down this week or later this week target will be 17200+++ yes I see somewhat descending triangle pattern which indicates big fall in this type of situation index opens gap down and go down more. If it able to hold above 18141 there's might be a chance to go up but chances are very low. Dear traders and followers after long time I'm again posting my intensive ideas if you find it helpful do like, comment and share thanks you.
INTENSIVE TRADING IDEAS

Nifty 50 will be up trend soonNifty 50 will be up trend soon
expected to cross 18200 in this week
if it break 17950 level.

Nifty 50 at the Monthly SR RANGE.Nifty 50 at the Monthly SR RANGE.
If it breaks the 18100 range then we may see a downfall for some time.

NIFTY 50 - Took the perfect fib range for support and resistanceNIFTY 50 : Took the perfect fib range for the support and resistance very beautifully.
Looking forward to see if it can maintain and get back to the parallel trending zone.

NIFTY 50 - Ready for direction switch?NIFTY 50 30mins Chart. Seems to be maintaining the trend very well. If its true, may be a time to switch direction?

NIFTY 50 - 30min - Follow the trendNIFTY 50 pretty much stuck in parallel trend line.
I have 2 parallel trend lines that just summarise the so far the trend in the past few days. Waiting to see if it can break and sustain.
Trade accordingly.

Nifty 50 Nifty 50 exact retraced to golden ratio of Fibonacci levels that is 0.618
Now will only look for long side
And for short in intraday only
It may go range then upside depends on market situation
Can go long from here by keeping sl below the ratio
ask your financial advisor before buying
Only for educational purposes

NIFTY 50 Weekly Forecast Analysis 28 Nov-2 Dec 2022 NIFTY 50 Weekly Forecast Analysis 28 Nov-2 Dec 2022
We can see that this week, the current implied volatility is around 1.85% , same as last week.
According to ATR calculations, we are currently on the 51th percentile, while with INDIA VIX we are on 12th percentile.
Based on this data, we can expect on average, the movement from open to close of the weekly candle to be :
In case of bullish - 1.82%
In case of bearish - 1.55%
With the current IV calculation, we have currently 24.3% that the close of the weekly candle is going to finish either above
or below the next channel:
TOP: 18771
BOT: 18090
At the same time, taking into consideration the high/low touch calculation from the previous values, we can expect for this week:
26% chance that we are going to touch the previous low of the weekly candle of 18125
78% chance that we are going to touch the previous high of the weekly candle of 18535(already hit)
Lastly from a technical analysis point of view, currently 80% of the moving averages rating, are insinuating we are in a BULLISH trend.

Nifty 50 Price prediction monthly trade target area Nifty 50 Price prediction monthly trade target area.
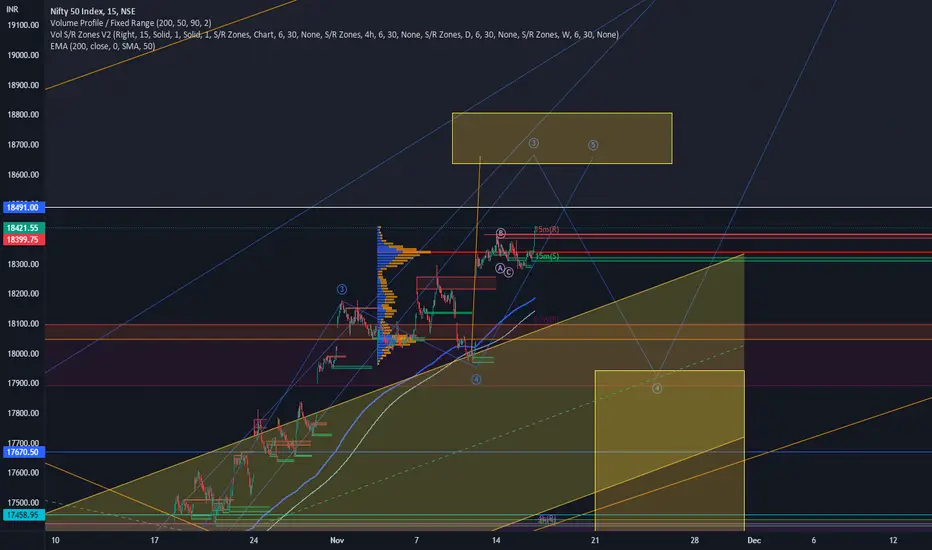
NIFTY 50 Monthly Forecast Movements 1-30 November 2022 NIFTY 50 Monthly Forecast Movements 1-30 November 2022
We can see that for this month, the implied volatility is around 4.56%, similar to last month.
This is currently placing us in the 0th percentile according to ATR and 50th according to INDIA VIX
Based on this percentile calculation, on average the monthly movement for the candle(from open of the candle to the close of the candle) is:
BEARISH Candle : 2.4%
BULLISH Candle : 5.7%
With this in mind we can expect with a close to 27.4% probability that our close of the monthly candle is going to close either above or below the next channel:
BOT: 17303
TOP: 18957
Lastly, based on the calculations that we had for touching the previous candle high and low values, we can estimate that there is a :
80% chance that we are going to touch the previous monthly high of 18020 (already happened yesterday)
26% chance that we are going to touch the previous monthly low of 16864

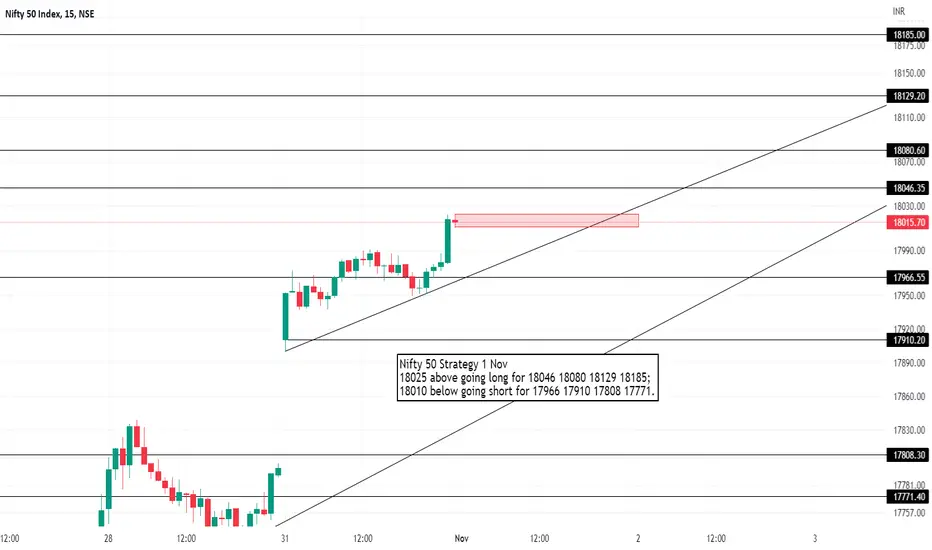
Nifty 50 Strategy 1 NovNifty 50 Strategy 1 Nov
18025 above going long for 18046 18080 18129 18185;
18010 below going short for 17966 17910 17808 17771.

Nifty 50 Strategy for 21 OctNifty 50 Strategy for 21 Oct
17575 above going long 17600 17700 17766;
17560 below going short 17430 17379 17322.
