LSCC looking to go again from my viewLiking a swing opportunity in LSCC here. It's got that look to it!
Semiconductors

Semiconductor strength will continue, target 208SOXL attempted a breakout above its channel and above April's highs, but got rejected and dropped back down to support at the 50-hour moving average. Here it's showing renewed strength, with volume turning green and candlesticks looking bullish. I think it will make another run at 202, this time pushing through to previous highs around 208.
SOXL has strong upward catalysts in the form of strong earnings and guidance this quarter. MU got an earnings beat earlier this quarter, and its recent ascending triangle break suggests it may rise to 51.50, for $4 per share upside. (However, MU is 5% overvalued compared to its average analyst price target of $45 per share.) We've just had earnings beats from Taiwan Semiconductor, Texas Instruments, and Intel that imply the sector is recovering in the second half of the year. TSM has 17.5% upside to the average analyst price target! Intel-- SOXL's largest holding-- can still gain $2.50 per share before it reaches the average analyst price target. QCOM, another large holding, has 12.5% upside to the average analyst price target, with earnings coming up tomorrow. A beat by QCOM could trigger the run up through the 202 resistance level.
As always, this is just an idea about how the market will move, not investment advice.

Micron upgrade, call activity, and ascending triangle breakMicron (MU) got an upgrade to "strong buy" over the weekend from Zack's, the best-performing analytics firm. It also got some huge options volume today, targeting $49 and $55 per share. That's probably on the strength of both the Zack's upgrade and the stock's ascending triangle break. The triangle break implies an upside of about $6 per share from the current level.


Semiconductors need ascending triangle break to continueThe ascending triangle is one of my favorite chart patterns. To confirm a breakout, we need to enter the corner of the triangle and then break above the previous high that forms the top of the triangle. A confirmed breakout usually results in a move about half the height of the triangle, or about $9 per share in this case. One nice thing about this chart pattern is that it allows for a fairly tight stop loss. If we breach that lower trendline, the pattern is broken and we can exit quickly.

Semiconductors entering risky resistance zoneSOXL has good buying volume today, but it looks a little risky moving forward. It's entering a resistance zone from previous highs, and it's got some bearish divergences on the hourly MACD.
Daily RSI is nearing overbought, and daily MACD is nearing resistance at 9. SOXL is still bullish within the channel, but look for a good entry and keep stop losses in place to guard against channel exit.

Sell Broadcom on this Symantec Acquisition, $20B Down The TubesBloomberg broke the news on Wednesday July 3rd, 2019 that Broadcom is in talks to buy struggling Symantec. This is a terrible idea on many fronts and $AVGO closed down 3% on the news. I believe that investors do not want this semiconductor company to waste $20 billion on a cybersecurity company (and why pick the one that seems to be struggling the most?). Certainly makes sense that we head lower over the next few days/weeks.
A few references:
AbbVie buying Allergan - stock closed down 15%
Salesforce buying Tableau - stock closed down 3% (but it hasn't dropped further)

Intel above trendlineIntel leape above its trendline earlier today, but then bounced hard off channel top and back below the trendline. However, it's now peeking above the trendline again, which bodes well for tomorrow.
Trump's announcement over the weekend that trade talks are resuming is good for Intel not only because it offers the promise of resolving the trade war, but also because Trump immediately lifted the Huawei ban. Intel has lots of exposure to Huawei, and Broadcom recently revised its guidance downward because of the ban. With the ban lifted, we shouldn't have to worry about Intel doing the same.
Unfortunately, tomorrow is a "bear" day according to the Stock Traders' Almanac-- a day when the major market indices have declined in value more than 60% of the time. So based on those historical seasonal patterns, this is a risky trade.

Trade-war relief - July 2019Trump and Xi Ping have come to a tariff truce at G-20 this weekend.
Trump is now using Huawei (previously blacklisted, banned, etc.) as a bargaining chip, allowing TEMPORARILY, U.S. companies to continue doing business with China's Huawei.
Here is a list of Top 20 U.S. based Huawei suppliers . I believe most of them will rally this month (July 2019).
- Percentage number next to stock symbol is the revenue exposure to Huawei
Intel (INTC) - 1%
Advanced Micro Device (AMD) - 2%
Broadcom (AVGO) - 6%
Qualcomm (QCOM) - 5%
Microsoft (MSFT)
Nvidia (NVDA)
CommScope (COMM) - 2%
Texas Instruments (TXN)
Seagate Technology (STX) - 4%
Micron Technology (MU) - 2%
Qorvo (QRVO) - 11%
Flex (FLEX) - 5%
Skyworks (SWKS) - 6%
Corning (GLW) - 2%
Analog Devices (ADI) - 3%
NeoPhotonics (NPTN) - 47%
Western Digital (WDC)
Lumentum (LITE) - 11%
II-VI (IIVI) - 8%
Finisar (FNSR) - 8%
Maxim Integrated (MXIM) - 4%
Keysight Technology (KEYS) - 2%
Marvell Technology (MRVL) - 1%
Note: Trump can go back on the Huawei deal at any time.

MU - LONG - Double bottom to 52.50- Double bottom at support. Micron is ready to fly, but I will wait a lite pullback at 35.00-35.50
- Strong stock on strong indusrty (Semiconductor). MU as been upgraded by Needham, from hold to buy at 50.00 as target.
- Very trong fundamental :
> P/E 3.57
> EPS : 157.6% this year
Waiting for a lite pullback to buy and fly to 52.50 as potential and at is all time high at 64.50.
I will update it regularly. Follow MU for development.
I wish you a great trading day!
Waz-

AMD Bullish, Long, Fib+EW PredictionsrThis is not financial advise. For entertainment purposes only. MY OPINION
AMD has had some good news, and solid growth despite the trade war between US and China. Finding support at the .618 Fib retracement at the end of a rising wedge, especially to end the week or month, could spark a full breakout to the ATH of $47.50. However, when adjusted for inflation, that is $70.64 in today's USD. I'm setting next targets to watch between $36 and $42 if resistance is successfully broken here. Of course, this is all bearing that AMD continues to have few issues and the company stays profitable. Anything can happen over the course of a few years.

Upside breakout AMDAMD broke out of its downward channel today on the strength of a supposed earnings beat by MU. This may portend further moves upward by AMD.

Micron pops on non-GAAP earnings report gimmickMicron has been looking bearish in what appeared to be an emerging downward channel. However, after hours today it popped two and a half dollars per share on the basis of a supposed earnings beat. News outlets are reporting that earnings "crushed" estimates. The problem is that the analyst estimates are for GAAP earnings, and Micron's GAAP earnings missed by several cents per share. By disclosing non-GAAP earnings, Micron used a common gimmick to appear to have beaten estimates that doesn't reflect actual strength in the company's fundamentals. Whether investors will notice this is another matter, however. The stock may stay up tomorrow regardless. But I personally wouldn't invest in it.
To Micron's credit, it did slightly beat estimates of GAAP revenue even though it missed on earnings.

AMD downward channel breakAMD has been trying to turn negative for a few days, and it just got there. Likely to fall from here. It's got poor analyst ratings, so there's reason for the channel break.


NVDA in Upward Trending ChannelI think NVDA will likely step higher through resistance tomorrow, with more upside ahead. Pullback to the bottom of the channel offers a buying opportunity.

$SOXX - Head & Shoulders Setting UpFirst Fib - December 26, 2018 Lows to April 24, 2019 Highs
Second Fib - April 24, 2019 Highs to May 29, 2919 Lows
We can see a very clear neckline @ approx. $174.94. Assuming the width of the shoulders are perfectly symmetrical, we could see a break of the neckline within 28 days, however, Powell's rate cut decision will either accelerate/nullify this process..

Why I'm ignoring technical chart and buying SOXL after hoursTrading View's technical chart is flashing a sell signal for SOXL, but my proprietary algorithm is saying buy.
These indicators are flashing strong buy:
Slope of the Hull moving average
Previous day's change
Difference between 20-day exponential moving average and 20-day simple moving average
These indicators are flashing a weak sell:
20-day simple moving average slope
Distance from Hull moving average
This indicator is flashing a fairly strong sell:
*Distance from 20-day exponential moving average
My proprietary algorithm aside, there's also seasonality to consider. Today is a "bear day" according to the Stock Trader's Almanac, meaning that on this date the market historically has fallen more than 60% of the time. However, the next week and a half have historically been bullish. So historical patterns suggest that today's decline was an anomaly and that the market will rally tomorrow or Friday.
As always, this is just an idea about how the market may move, not investment advice.

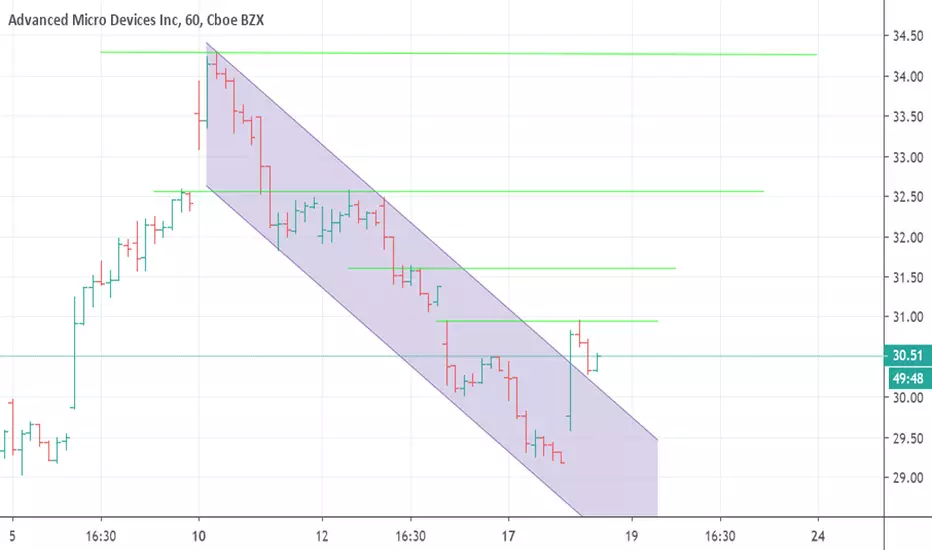
AMD Short setup $32 to ~$29ish, ~$34 stoplossThe text is on the chart, AMD Short setup $32 to ~$29ish, ~$33 stoploss and reevaluating. I'll still be watching to get back in around 33-34$, and I'm dead wrong if this thing hits $35 which I find unlikely. Whole play should take about 1-2 weeks max.

AMD Short setup $29.8 to $26ish. Fib/Horiz resistanceSide note, The magnitude of the bounce the US economy has had since the bottom in DEcember has been insane and unprecidented. I've never seen a bottom not get tested and just fly up vertically. Especially with poor GDP estimates and economic outlook data. I was pretty heavily short back in Feb, so that hurt a bit, but all you can do is learn from your mistakes and keep moving.
This is a self explanatory chart again. We're at the 0.786 fib retracement, and we're at a previous point of resistance from September 05 2018 at $29.94. We just went up almost 12% today, and it looks like a good time to pullback a bit in the next week. My stoploss is $31.

$SMH Short 112.70 to 110, 109, 108. [5.65x Risk/reward]ATH is 114. I'm not expecting us to go there. AMD had it's run up already, SPX is looking slow (and like a Head and shoulder on the weekly). I'm better as a bearish trader which sucks in the kind of rally we've had from the bottom, but I've adapted by being more patient and precise with my entries and stop losses.
Short entry 112.70
Stoploss 113.15
Take profit:
Conservative 110
Target 109
Pushing it 108.

Swing trade YANGAfter Trumps tweet of raising tariffs, China's market is temporarily crashing.
YANG is a China Direxion Bear X3 ETF. The index is having great gains.
I expect it to reverse on Friday 10th / Monday 13th. Analysts still expect the trade to happen between China and USA.
At this point consider buying YINN (China Bull X3 ETF).
Other X3 ETF's to consider:
SOXS (Semiconductors Direxion Bear) is on the same path.
---------------------------------------------------------------------
Information
An exchange-traded fund, or ETF, is an investment product representing a basket of securities that track an index such as the Standard & Poor's 500 Index. ETFs, which are available to individual investors only through brokers and advisers, trade like stocks on an exchange.
Direxion Shares and Ultra ProShares are leveraged Exchange-Traded Funds (ETFs) designed to seek daily investment results, before fees and expenses, of 300% / 3x of the performance (or 300% / 3x of the inverse of the performance, in the case of a bear fund), of the benchmark index that they track. There is no guarantee that the funds will achieve their objective.
---------------------------------------------------------------------
Caution
There can be A LOT of volatility trading these Indexes. ALWAYS use stop-loss orders, as well as price target sell-offs.
Happy trading!
PS:
For a list of all 3X ETF's. Go to: 3XETF dot-com

Intel - Oversold! PT $ 56 - $ 59I think Intel is way oversold. Solid company with a nice dividend.
Price target: $ 56 - $ 59
