EURNZD H4 POTENTIAL SHARK OR CYPHER PATTERNHello traders. I see potential SHARK or CYPHER pattern on EURNZD H4 chart. Good luck everybody.
Shark

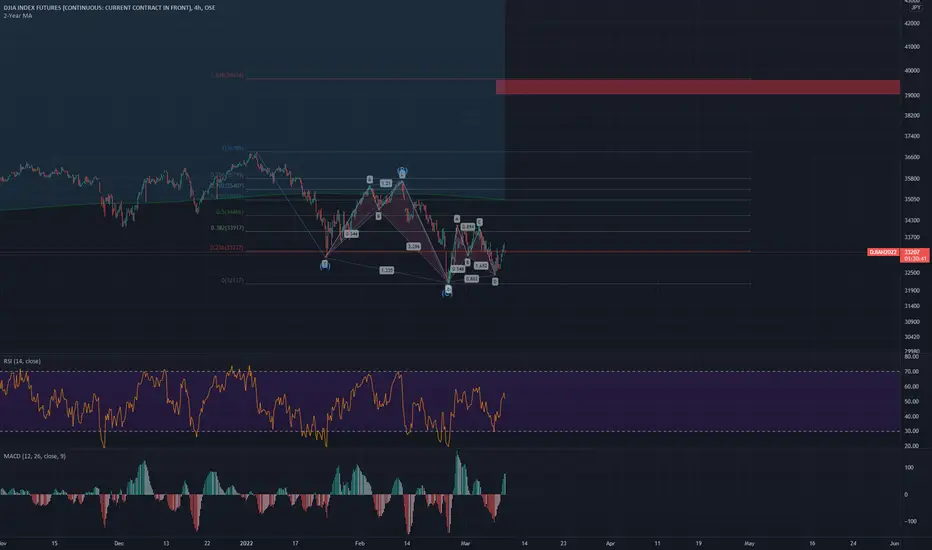
GBPJPY H4 SHARK PATTERN AND RSI DIVERGENCEHello traders. I see SHARK pattern and RSI divergence on GBPJPY H4 chart. Good luck everybody.

GBPUSD-Weekly Market Analysis-Mar22,Wk4Don't feel bad if you have missed the Bearish Shark Pattern movement, especially if you have deliberately avoided it.
I believe you would have regretted if you had long instead of shorting the Shark Pattern because you saw the news that the Bank of England had planned to increase the bank interest rate.
It is important that you know to stay out of news trading, and now you have seen why.
It's indeed a pity that by avoiding the news, we had missed 84pips of market movement. But, I actually feel good about it.
Trading doesn't require us to take unnecessary risks, remember that.
Because we are patient, there is a Bearish Deep Gartley Pattern complete at 1.3206 for us to consider to short the GBPUSD on this setup.
How have you managed the BOE rate released? Comment down below and share it with us.


GBPUSD - Bearish SharkIt is important to wait for Candle Confirmation even on the most familiar currency pair and most familiar setup.
The close of the current candle will determine if the Shark Pattern is valid. The Bearish Shark Pattern formed at 1.3177 and was confirmed once the candle closed at 1.3173.
As this is a 1-hourly chart setup at 1700(GMT +8) or latest by 1900, it will give us a clear picture if the trade is valid.

$PRE Bullish Shark Harmonic$PRE Bullish Shark harmonic pattern. Triple Bullish Divergence on the MACD histogram, with positive momentum building. Falling Wedge reaching it's apex. Dipped just below critical support, but recovered with a nice reaction, now consolidating. IMO looks very similar to the Wycoff Re-Accumulation Schematic. Waiting for a breakout, and back-test to confirm bottom is in. Do not want to see price below ~$0.17. BTC dumps and all bets are off.

GBPJPY DROP ??!Risk : Reward
1:100
Use Proper Risk management.
Move SL to breakeven if price goes to 145.44
Trading Success = Edge + Probability + Risk Management.
Trade Safe ✅

PENNLONG-TERM: Major bullish shark with a double bottom at the PCZ , which lines up with pre-covid highs flipping into support, hidden bullish divergence on the daily, classic bullish divergence on the weekly, close to a falling wedge breakout. (not financial advice)

CADJPY - Bearish SharkThis is the trade I'm talking about, check the link at the bottom if you have no idea what I'm talking about.
The Shark Pattern at the Weekly Chart Resistance. It is a trade that I'm going to follow closely.

CADJPY - Bearish SharkThis is a very bold trade; chances of it hitting stop are high. That's why I'm not putting it out as an Official Trade-Ideas.
On the Range Bar chart, the Bearish Shark Pattern has confirmed and I'm in the trade. Once the market has reached its target 1, I will be shifting my stop to my entry price and pertain to a Risk-Free Trade.
This is when I will be using my trade management - Upsize and stretch both target based on Daily Chart Shark Pattern, link of the analysis could be checked at the bottom.
The Big Question will be, what if I got stop out, then I will wait for the next trading ideas to engage the trade again.

ANKR formed big bullish Shark for upto 208% moveHi dear friends, hope you are well and welcome to the new trade setup of ANKR token.
On a weekly time frame chart, ANKR has formed bullish Shark.

EURUSD-Weekly Market Analysis-Mar22,Wk3Traders need to plan their trade; even there wasn't any trading setup, this happened to us last week(check last week's related ideas within TradingView).
This week, we have upgraded from a Zero trading setup to a VIP trading setup. We have a Bullish Shark Pattern complete within the Buy Zone on the 1hourly chart.
What makes this trade special is that we could use the Trade Management system to stretch our final target to the Bearish Deep Gartley Pattern on the 4-hourly chart.

CADJPY - Bearish SharkCADJPY has been giving us an amazing trading experience. Once again, another Bearish Shark Pattern has formed up. What's different from this setup is that the 4-hourly candle has broken and closed above X. This is something that you shouldn't treat lightly.
You can head to the lower timeframe and wait for a Double Top setup with RSI Divergence on the 1hourly chart. That should significantly reduce your initial stop-loss providing and reward of up to 5x.


KSM/USDT-1D-BINANCE (Bullish Shark)This is not a financial advice. Always do your own research and always put stoploss in your trade (SL) :) If you want more detailed info
how to study and read charts or just need help with some coin, just write to me here a comment, i will try to answer to everybody...
i can help you :) all for free, don't worry, BE HAPPY!

AUDUSD - Shark pattern Entry Buy
-Cypher pattern fail
-Shark pattern
-Minor structure
-TP
-XC 38.2 , 61.8

GBPUSD-Weekly Market Analysis-Mar22,Wk3GBPUSD is on a Bearish Trend, if you are waiting for a shorting opportunity, you can wait for the market retest back to 1.3192 and engage through the Bearish Shark Pattern setup.
What's nice about this setup is that the Shark Pattern form within the Sell Zone and it was the level of the previous Shark Pattern as well.


CADJPY Short OppurtunityPrice has hit the supply zone while forming a bearish shark and looks like a rejection for a short back down to around 90.00. Wait for a possible retest in the supply zone.

Bullish Shark PCZ at Bottom Half of Broadening WedgeWe have Two Instances of Bullish Divergence on the 4 Hour MACD at the Demand-line of a Descending Broadening Wedge and PCZ of Bullish Shark and if it plays out we could very well see the top half of the Channel from here.

ABC Correction with Bullish Shark & Bat Type 1 Return Target 39KUptrend ABC Correction with Bullish Shark Retrace to .786 & Bullish Bat Type 1 Return Confirmation Higher Low. Full Fib Extension Target Top 39,000-39,600.
CADJPY - Bearish SharkBearish Shark Pattern has reversed on the dot of its completion. What's even better is that the completion of the pattern has respected the Supply Zone(mark as the red box).
Traders can wait for the retest of the Shark Pattern to engage on a shorting opportunity.

BTC making Bearish Shark on hourly!!!BTC / USDT (Interval 1H)
We have a bearish shark pattern on hourly chart, Everything is self-explanatory, Invalidation of this harmonic will be $43,392. We are still biased bearish till $45k is not fully reclaimed on weekly chart. BTC will continue to range between $37k to $44k till we have a breakdown or breakout on either side. Right now on higher time frame we are getting buy signals but on lower time frame we are getting mixed signals. Again $45k level needs to break out or else we will continue to range for some time.
