shib fall hardPrice peaked at around 0.00009$ (new ATH) now I expect hard fall to strong support zones mentioned on the chart.
Targets and supports ahead:
A. 0.00005475
B. 0.00004604
DISCLAIMER: trade based on your own decision
press 👍 if you enjoy💚
Shibusdtshort

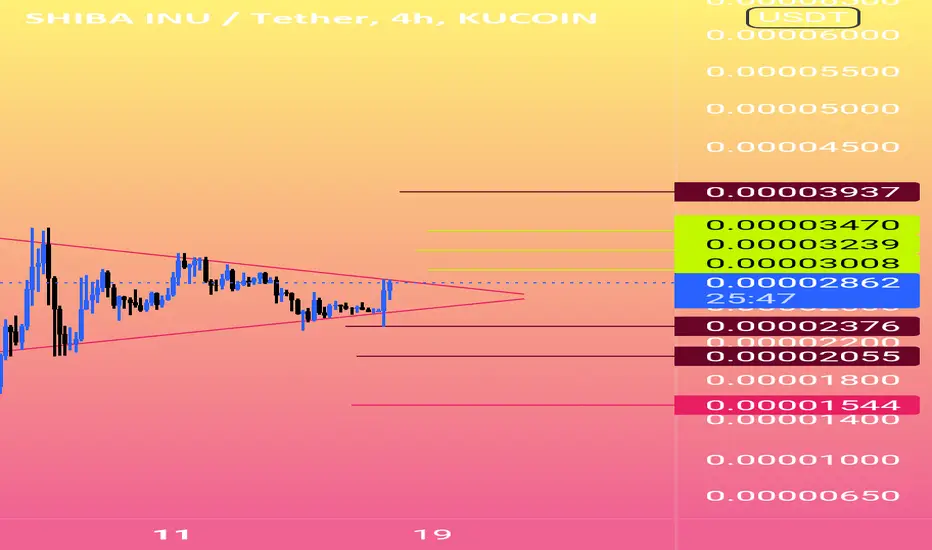
shibusdt ll break the crucial support of Descending triangleSturucture posiblity
shibusdt ll break the crucial support of Descending triangle
SHIBAUSDT structure is look like bearish

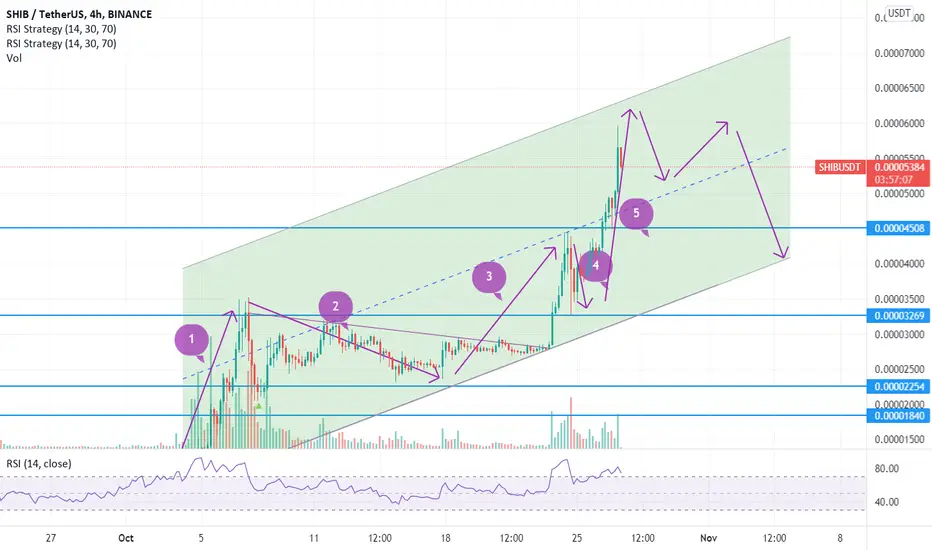
Shiba end of uptrend - bears start soon?I think shiba Ascending trend can end soon after 5th wave. RSI in glut condition - price touch top of the channel & I think The conditions are right for a price correction to begin. That's Just My idea. maybe it will be true or false
Sell: around 0.000059 - 0.000061
TP: 1: 0.00005200 - 2: 0.000044 - 3: 0.000040
SL: Daily candle close above 0.000065
NeutralHi guys, we use the pattern from each side of the break from the same side, if from the top of the break we also use the long position and if from the bottom of the break we use the short position.
SHIBUSDTHey traders
what u think about shiba ?
there is 4 idea about SHIB that u can check ( ill share them in the comment for easier and faster access )
what u think about this One ?
Share ur chart and leave a comment

SHIBUSDT: The BEST Scénario For Short PositionAs we can see, we're now in the Big "B" Wave and after the appearence of the Market Maker Candle we're targeting now C wave as shown.
PLEASE LIKE & FOLLOW FOR MORE ANALYSIS.

SHIB back to baseafter shib massive pump, now a dumb is gradually incoming.....
$shib
Trade safe....

SHIBUSDThey traders
as u can see. Bulls have the full control of SHIB
what u think ?
Bears comming out ?
i think so
Share your Chart and Leave a comment
