SPY Trading Opportunity! SELL!
My dear subscribers,
My technical analysis for SPY is below:
The price is coiling around a solid key level - 594.29
Bias - Bearish
Technical Indicators: Pivot Points Low anticipates a potential price reversal.
Super trend shows a clear sell, giving a perfect indicators' convergence.
Goal - 563.56
My Stop Loss - 611.99
About Used Indicators:
By the very nature of the supertrend indicator, it offers firm support and resistance levels for traders to enter and exit trades. Additionally, it also provides signals for setting stop losses
Disclosure: I am part of Trade Nation's Influencer program and receive a monthly fee for using their TradingView charts in my analysis.
———————————
WISH YOU ALL LUCK
Signal

USDCAD What Next? BUY!
My dear friends,
My technical analysis for USDCAD is below:
The market is trading on 1.3934 pivot level.
Bias - Bullish
Technical Indicators: Both Super Trend & Pivot HL indicate a highly probable Bullish continuation.
Target - 1.3958
About Used Indicators:
A pivot point is a technical analysis indicator, or calculations, used to determine the overall trend of the market over different time frames.
Disclosure: I am part of Trade Nation's Influencer program and receive a monthly fee for using their TradingView charts in my analysis.
———————————
WISH YOU ALL LUCK

NZDJPY On The Rise! BUY!
My dear subscribers,
This is my opinion on the NZDJPY next move:
The instrument tests an important psychological level 85.502
Bias - Bullish
Technical Indicators: Supper Trend gives a precise Bullish signal, while Pivot Point HL predicts price changes and potential reversals in the market.
Target - 85.708
About Used Indicators:
On the subsequent day, trading above the pivot point is thought to indicate ongoing bullish sentiment, while trading below the pivot point indicates bearish sentiment.
Disclosure: I am part of Trade Nation's Influencer program and receive a monthly fee for using their TradingView charts in my analysis.
———————————
WISH YOU ALL LUCK

Bitcoin - Do Or DieThis is the spot where things either get spicy or go limp. If we see weakness here — same old chop, same range, nothing to see.
But if Bitcoin punches through this zone with conviction, we’re looking at some serious upside. Targets are mapped, and the path is clear if bulls step up.
No breakout? Don’t expect fireworks.
Breakout? Strap in.
This is a decisive moment

GOLD: Short Trade Explained
GOLD
- Classic bearish formation
- Our team expects pullback
SUGGESTED TRADE:
Swing Trade
Short GOLD
Entry - 3234.0
Sl - 3241.7
Tp - 3216.0
Our Risk - 1%
Start protection of your profits from lower levels
Disclosure: I am part of Trade Nation's Influencer program and receive a monthly fee for using their TradingView charts in my analysis.
❤️ Please, support our work with like & comment! ❤️

EURNZD: Free Trading Signal
EURNZD
- Classic bearish setup
- Our team expects bearish continuation
SUGGESTED TRADE:
Swing Trade
Short EURNZD
Entry Point - 1.9062
Stop Loss - 1.9116
Take Profit - 1.8970
Our Risk - 1%
Start protection of your profits from lower levels
Disclosure: I am part of Trade Nation's Influencer program and receive a monthly fee for using their TradingView charts in my analysis.
❤️ Please, support our work with like & comment! ❤️

GBPUSD My Opinion! SELL!
My dear followers,
I analysed this chart on GBPUSD and concluded the following:
The market is trading on 1.3427 pivot level.
Bias - Bearish
Technical Indicators: Both Super Trend & Pivot HL indicate a highly probable Bearish continuation.
Target - 1.3356
Safe Stop Loss - 1.3467
About Used Indicators:
A super-trend indicator is plotted on either above or below the closing price to signal a buy or sell. The indicator changes color, based on whether or not you should be buying. If the super-trend indicator moves below the closing price, the indicator turns green, and it signals an entry point or points to buy.
Disclosure: I am part of Trade Nation's Influencer program and receive a monthly fee for using their TradingView charts in my analysis.
———————————
WISH YOU ALL LUCK

AUDJPY Massive Long! BUY!
My dear friends,
AUDJPY looks like it will make a good move, and here are the details:
The market is trading on 92.666 pivot level.
Bias - Bullish
Technical Indicators: Supper Trend generates a clear long signal while Pivot Point HL is currently determining the overall Bullish trend of the market.
Goal - 93.784
Recommended Stop Loss - 92.004
About Used Indicators:
Pivot points are a great way to identify areas of support and resistance, but they work best when combined with other kinds of technical analysis
Disclosure: I am part of Trade Nation's Influencer program and receive a monthly fee for using their TradingView charts in my analysis.
———————————
WISH YOU ALL LUCK

GOLD: Long Trading Opportunity
GOLD
- Classic bullish pattern
- Our team expects retracement
SUGGESTED TRADE:
Swing Trade
Buy GOLD
Entry - 3301.5
Stop - 3295.3
Take - 3312.0
Our Risk - 1%
Start protection of your profits from lower levels
Disclosure: I am part of Trade Nation's Influencer program and receive a monthly fee for using their TradingView charts in my analysis.
❤️ Please, support our work with like & comment! ❤️

GOLD - Trio Retest!Hello TradingView Family / Fellow Traders. This is Richard, also known as theSignalyst.
📈After rejecting the $3,500 round number and upper bound of the wedge, XAUUSD has been in a correction phase trading within the falling red channel.
📚 As Gold approaches the $3,100 - $3,150 support zone, I will be looking for buy setups on lower timeframes as it is the intersection of three rejections:
1- The lower bound of the falling red channel
2- The lower bound of the rising orange wedge
3- $3,100 - $3,150 support zone
📚 Always follow your trading plan regarding entry, risk management, and trade management.
Good luck!
All Strategies Are Good; If Managed Properly!
~Rich
Disclosure: I am part of Trade Nation's Influencer program and receive a monthly fee for using their TradingView charts in my analysis.

XAUUSD Chart 4H Analysis BUY GoldXAUUSD Chart 4H Analysis BUY Gold Doesn't Have To Be Hard Profit Surging!
The provided XAUUSD (Gold Spot/U.S. Dollar) 4-hour chart outlines a structured technical setup with clearly defined entry points, retracement zone, and multiple take-profit (TP) targets.
The current price at the time of analysis is **$3,198.67**, with the potential for a bullish continuation upon confirmation within the valid setup zone. Let’s break this down in detail:
**Current Price and Entry Strategy**
* **Current Price:** $3,198.67
* **Recommendation:** Look for better entry around or near the green support zone. The setup is bullish-biased, suggesting a buy-on-dip opportunity.
* **Support/Invalidation Zone:** If the price **closes below the green zone**, the setup will be **invalidated**. Hence, risk management and confirmation are crucial before taking any position.
**Target Levels Identified**
Three Take-Profit (TP) levels are established in the chart, each indicating potential upward momentum if the price respects the support and begins to rise again:
* **TP1: $3,220.67**
✔️ Gain of **22 USD (220 pips)** from current price
✔️ Represents an initial move post-entry confirmation
✔️ Ideal for short-term scalpers or conservative traders
* **TP2: $3,252.67**
✔️ Gain of **54 USD (540 pips)** from current price
✔️ Mid-level target indicating strong bullish continuation
✔️ Can be a good point for partial profit booking
* **TP3: $3,284.67**
✔️ Gain of **86 USD (860 pips)** from current price
✔️ Long-term or full swing trade target
✔️ Represents full bullish momentum with higher reward-to-risk ratio

USDJPY - New Impulse Soon!Hello TradingView Family / Fellow Traders. This is Richard, also known as theSignalyst.
📈USDJPY has been overall bullish trading within the rising broadening wedge pattern marked in blue and it is currently hovering around the lower bound of it.
Moreover, the orange zone is a strong structure and support.
🏹 Thus, the highlighted blue circle is a strong area to look for buy setups as it is the intersection of structure and lower blue trendline acting as a non-horizontal support.
📚 As per my trading style:
As #USDJPY is around the blue circle zone, I will be looking for bullish reversal setups (like a double bottom pattern, trendline break , and so on...)
📈The bullish impulse will begin after a break above the last minor high and upper red trendline.
📚 Always follow your trading plan regarding entry, risk management, and trade management.
Good luck!
All Strategies Are Good; If Managed Properly!
~Rich
Disclosure: I am part of Trade Nation's Influencer program and receive a monthly fee for using their TradingView charts in my analysis.

USDJPY - Long Done, Soon Short!Hello TradingView Family / Fellow Traders. This is Richard, also known as theSignalyst.
📈As per our last USDJPY analysis, it rejected the orange support zone and has been trading higher.
What's next? As USDJPY approaches the upper blue trendline, we will be looking for shorts.
🏹 The highlighted red circle is a strong area to look for sell setups as it is the intersection of the upper blue trendline and green supply zone.
📚 As per my trading style:
As #USDJPY retests the red circle zone, I will be looking for bearish reversal setups (like a double top pattern, trendline break , and so on...)
Meanwhile, USDJPY would remain bullish medium-term and a bullish continuation towards the red circle is expected.
📚 Always follow your trading plan regarding entry, risk management, and trade management.
Good luck!
All Strategies Are Good; If Managed Properly!
~Rich
Disclosure: I am part of Trade Nation's Influencer program and receive a monthly fee for using their TradingView charts in my analysis.

NZDJPY - Off We Go... Again!Hello TradingView Family / Fellow Traders. This is Richard, also known as theSignalyst.
📈NZDJPY has been overall bullish trading within the rising channel marked in red.
Moreover, the green zone is a strong demand!
🏹 Thus, the highlighted blue circle is a strong area to look for buy setups as it is the intersection of demand and lower red trendline acting as a non-horizontal support.
📚 As per my trading style:
As #NZDJPY approaches the blue circle zone, I will be looking for bullish reversal setups (like a double bottom pattern, trendline break , and so on...)
📚 Always follow your trading plan regarding entry, risk management, and trade management.
Good luck!
All Strategies Are Good; If Managed Properly!
~Rich
Disclosure: I am part of Trade Nation's Influencer program and receive a monthly fee for using their TradingView charts in my analysis.

CHFJPY: Long Trade Explained
CHFJPY
- Classic bullish setup
- Our team expects bullish continuation
SUGGESTED TRADE:
Swing Trade
Long CHFJPY
Entry Point - 173.57
Stop Loss - 173.03
Take Profit - 174.53
Our Risk - 1%
Start protection of your profits from lower levels
Disclosure: I am part of Trade Nation's Influencer program and receive a monthly fee for using their TradingView charts in my analysis.
❤️ Please, support our work with like & comment! ❤️

CADJPY: Long Trade with Entry/SL/TP
CADJPY
- Classic bullish formation
- Our team expects growth
SUGGESTED TRADE:
Swing Trade
Buy CADJPY
Entry Level - 103.60
Sl - 103.05
Tp - 104.64
Our Risk - 1%
Start protection of your profits from lower levels
Disclosure: I am part of Trade Nation's Influencer program and receive a monthly fee for using their TradingView charts in my analysis.
❤️ Please, support our work with like & comment! ❤️

GBPAUD Will Collapse! SELL!
My dear subscribers,
This is my opinion on the GBPAUD next move:
The instrument tests an important psychological level 2.0828
Bias - Bearish
Technical Indicators: Supper Trend gives a precise Bearish signal, while Pivot Point HL predicts price changes and potential reversals in the market.
Target - 2.0715
My Stop Loss - 2.0895
About Used Indicators:
On the subsequent day, trading above the pivot point is thought to indicate ongoing bullish sentiment, while trading below the pivot point indicates bearish sentiment.
Disclosure: I am part of Trade Nation's Influencer program and receive a monthly fee for using their TradingView charts in my analysis.
———————————
WISH YOU ALL LUCK

USDJPY Expected Growth! BUY!
My dear friends,
USDJPY looks like it will make a good move, and here are the details:
The market is trading on 144.56 pivot level.
Bias - Bearish
Technical Indicators: Supper Trend generates a clear short signal while Pivot Point HL is currently determining the overall Bearish trend of the market.
Goal - 145.11
About Used Indicators:
Pivot points are a great way to identify areas of support and resistance, but they work best when combined with other kinds of technical analysis
Disclosure: I am part of Trade Nation's Influencer program and receive a monthly fee for using their TradingView charts in my analysis.
———————————
WISH YOU ALL LUCK

GOLD The Target Is DOWN! SELL!
My dear friends,
Please, find my technical outlook for GOLD below:
The price is coiling around a solid key level - 3236.0
Bias - Bearish
Technical Indicators: Pivot Points Low anticipates a potential price reversal.
Super trend shows a clear sell, giving a perfect indicators' convergence.
Goal - 3224.9
Safe Stop Loss - 3240.9
About Used Indicators:
The pivot point itself is simply the average of the high, low and closing prices from the previous trading day.
Disclosure: I am part of Trade Nation's Influencer program and receive a monthly fee for using their TradingView charts in my analysis.
———————————
WISH YOU ALL LUCK

SILVER My Opinion! BUY!
My dear friends,
Please, find my technical outlook for SILVER below:
The instrument tests an important psychological level 32.284
Bias - Bullish
Technical Indicators: Supper Trend gives a precise Bullish signal, while Pivot Point HL predicts price changes and potential reversals in the market.
Target - 32.607
Recommended Stop Loss - 32.097
About Used Indicators:
Super-trend indicator is more useful in trending markets where there are clear uptrends and downtrends in price.
Disclosure: I am part of Trade Nation's Influencer program and receive a monthly fee for using their TradingView charts in my analysis.
———————————
WISH YOU ALL LUCK

TESLA Under Pressure! SELL!
My dear followers,
This is my opinion on the TESLA next move:
The asset is approaching an important pivot point 349.84
Bias - Bearish
Safe Stop Loss - 369.27
Technical Indicators: Supper Trend generates a clear short signal while Pivot Point HL is currently determining the overall Bearish trend of the market.
Goal - 312.75
About Used Indicators:
For more efficient signals, super-trend is used in combination with other indicators like Pivot Points.
Disclosure: I am part of Trade Nation's Influencer program and receive a monthly fee for using their TradingView charts in my analysis.
———————————
WISH YOU ALL LUCK

GBPNZD: Bears Will Push Lower
GBPNZD
- Classic bearish formation
- Our team expects fall
SUGGESTED TRADE:
Swing Trade
Sell GBPNZD
Entry Level - 2.2555
Sl - 2.2624
Tp - 2.2425
Our Risk - 1%
Start protection of your profits from lower levels
Disclosure: I am part of Trade Nation's Influencer program and receive a monthly fee for using their TradingView charts in my analysis.
❤️ Please, support our work with like & comment! ❤️

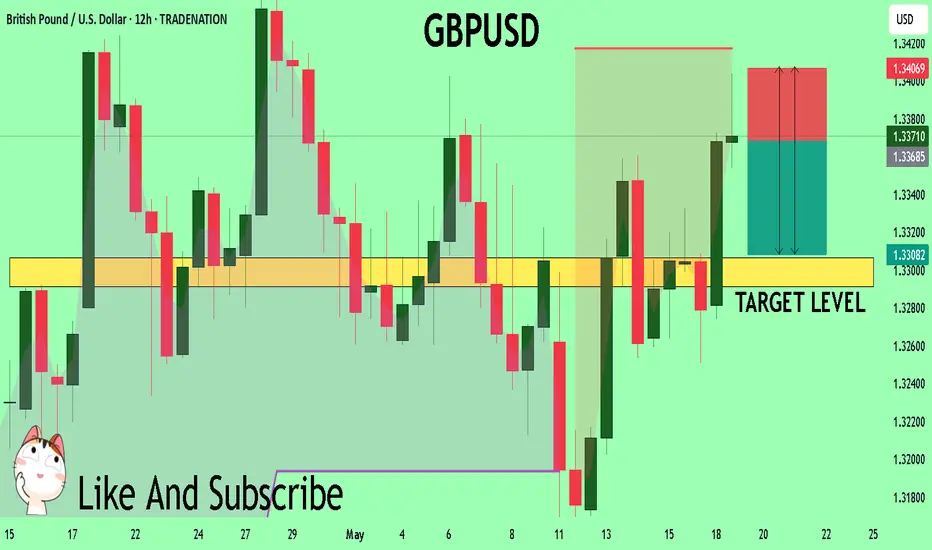
GBPUSD Buyers In Panic! SELL!
My dear friends,
My technical analysis for GBPUSD is below:
The market is trading on 1.3368 pivot level.
Bias - Bearish
Technical Indicators: Both Super Trend & Pivot HL indicate a highly probable Bearish continuation.
Target - 1.3306
Recommended Stop Loss - 1.3406
About Used Indicators:
A pivot point is a technical analysis indicator, or calculations, used to determine the overall trend of the market over different time frames.
Disclosure: I am part of Trade Nation's Influencer program and receive a monthly fee for using their TradingView charts in my analysis.
———————————
WISH YOU ALL LUCK
CHFJPY Trading Opportunity! BUY!
My dear subscribers,
CHFJPY looks like it will make a good move, and here are the details:
The market is trading on 173.90 pivot level.
Bias - Bullish
My Stop Loss - 173.48
Technical Indicators: Both Super Trend & Pivot HL indicate a highly probable Bullish continuation.
Target - 174.66
About Used Indicators:
The average true range (ATR) plays an important role in 'Supertrend' as the indicator uses ATR to calculate its value. The ATR indicator signals the degree of price volatility.
Disclosure: I am part of Trade Nation's Influencer program and receive a monthly fee for using their TradingView charts in my analysis.
———————————
WISH YOU ALL LUCK
