AR/USDT : FREE SIGNALHello friends✌
You see that after the price growth we had, we entered a correction, which provided us with a good opportunity to buy📈
We have identified the buying levels and targets for you to buy...
Don't forget capital management, friends.
*Trade safely with us*
Signals

EURUSD: Local Bearish Bias! Short!
My dear friends,
Today we will analyse EURUSD together☺️
The in-trend continuation seems likely as the current long-term trend appears to be strong, and price is holding below a key level of 1.13761 So a bearish continuation seems plausible, targeting the next low. We should enter on confirmation, and place a stop-loss beyond the recent swing level.
❤️Sending you lots of Love and Hugs❤️

GOLD falls more than 40 Dollars, widening correction rangeSpot OANDA:XAUUSD unexpectedly accelerated its decline during the Asian trading session on Monday (April 28). The current price of gold is around 3,280 USD/ounce, down more than 40 USD on the day. The price of gold has gradually decreased compared to the intraday high of 3,336.98 USD/ounce reached at the beginning of the trading session.
The easing of trade tensions between China and the United States has weakened gold’s appeal as a safe haven. Gold prices have fallen more than 5% since breaking above $3,500 an ounce last Wednesday.
The latest developments around US-China trade relations and the release of key US macroeconomic data will trigger gold’s near-term price action. Market participants will be closely watching US economic growth and employment data this week.
The latest data from the US Commodity Futures Trading Commission (CFTC) showed that hedge fund managers cut their net long positions in gold futures and options to a 14-month low.
Technical Outlook Analysis OANDA:XAUUSD
On the daily chart, gold has dropped below the raw price of $3,300 and at its current position it could continue to decline further with a short-term target of around $3,245 where the price confluences with the upper edge of the price channel.
Although gold has fallen significantly from $3,500, looking at the overall chart, gold still has bullish conditions with support from EMA21 and the rising price channel as the long-term trend. On the other hand, the down trending RSI is also approaching the 50 level, in this case the 50 level is the closest support at present, indicating that there may not be much room for decline in the short term.
Once gold is back in action above the 0.382% Fibonacci retracement level, it will be in position to rebound with a target of around $3,371 in the short term.
During the day, the bearish correction could continue but will be limited by the EMA21 and the price channel. Along with that, the bearish correction along with the main uptrend will be noticed by the following technical positions.
Support: $3,245 – $3,228 – $3,200
Resistance: $3,292 – $3,371
SELL XAUUSD PRICE 3328 - 3326⚡️
↠↠ Stop Loss 3332
→Take Profit 1 3320
↨
→Take Profit 2 3314
BUY XAUUSD PRICE 3226 - 3228⚡️
↠↠ Stop Loss 3222
→Take Profit 1 3234
↨
→Take Profit 2 3240

Gold falls below $3,300International gold prices are currently trading around $3,290/ounce, down $40 from last week and far from the record high of $3,500. The bearish structure still prevails as gold is below the EMA34 and EMA89, while failing many times to regain the $3,300 mark.
Strong profit-taking pressure, a recovering USD and rising bond yields are dragging gold prices down, despite the previous optimistic expectations from the Kitco survey. If gold continues to weaken below $3,300, it could head towards $3,250, deeper into the $3,200–$3,220 range. Conversely, only when it surpasses $3,320 will the downtrend be challenged.
Short-term strategy: Prioritize selling when gold recovers weakly.

S&P500: Rebound or Bull Trap?Over the past week, the S&P500 weekly chart showed a key technical signal: the formation of a bullish engulfing.
This pattern emerged after several weeks of strong monthly bearish pressure, suggesting a potential reversal attempt or, at the very least, a technical rebound.
Analyzing the key levels, the price reacted inside a major demand area (visible on the monthly timeframe), positioned between 5,450 and 5,500 points.
The reaction from this zone reinforces the validity of the engulfing and suggests the market could now aim for the first resistance targets around 5,600 - 5,650.
Further upside targets are located at 5,837 and 6,023, previously marked as high-confluence zones.
From an institutional positioning perspective, the latest COT Report (April 22, 2025) reveals interesting developments:
Commercials (big players) increased their long contracts by +22,226 units, showing strong interest in upside protection.
Non-Commercials (speculators) also increased their longs (+8,754), but added even more to their shorts (+20,667).
The Net Positioning for Non-Commercials remains negative but has stabilized at less extreme levels compared to March, suggesting a possible phase of accumulation or preparation for a sentiment shift.
📊 The Net Positions chart shows a reduction in net short pressure — a warning sign for those still heavily short.
Summary:
The weekly engulfing is a technical signal not to underestimate.
We are trading within a strong monthly demand zone.
COT data suggests a decrease in bearish pressure, although not yet a full sentiment reversal.
However, caution is necessary: a firm break below 5,450 would invalidate the bullish signal and reopen the path toward corrections at 5,200 and 5,000.
Current Strategy:
Slight bullish bias above 5,500.
Short-term target: 5,600 → 5,650.
Next targets: 5,837 and 6,023.
Invalidation level: weekly close below 5,450.
Watching the price action around key resistance levels will be crucial: the market will decide whether this rebound consolidates or becomes just a trap for new buyers.

JP MORGAN's long-term bullish trend restored above the 1D MA50.JP Morgan Chase (JPM) broke above its 1D MA50 (red trend-line) last week for the first time since the first week of March and technically put an official end to the 3-month 'Trade War' correction.
This correction has technically been the Bearish Leg of the 2.5-year Channel Up. Every time the 1D MA50 broke and closed a 1W candle above it, the stock started the new Bullish Leg of the pattern. The last Bullish Leg was +6% (+48% against +42%) stronger than the previous one before the first pull-back to the 1D MA50 again.
As a result, we expect to see $310 (+54%) before this year is over.
-------------------------------------------------------------------------------
** Please LIKE 👍, FOLLOW ✅, SHARE 🙌 and COMMENT ✍ if you enjoy this idea! Also share your ideas and charts in the comments section below! This is best way to keep it relevant, support us, keep the content here free and allow the idea to reach as many people as possible. **
-------------------------------------------------------------------------------
💸💸💸💸💸💸
👇 👇 👇 👇 👇 👇

GBPNZD Will Go Higher From Support! Buy!
Here is our detailed technical review for GBPNZD.
Time Frame: 1D
Current Trend: Bullish
Sentiment: Oversold (based on 7-period RSI)
Forecast: Bullish
The market is approaching a significant support area 2.241.
The underlined horizontal cluster clearly indicates a highly probable bullish movement with target 2.283 level.
P.S
The term oversold refers to a condition where an asset has traded lower in price and has the potential for a price bounce.
Overbought refers to market scenarios where the instrument is traded considerably higher than its fair value. Overvaluation is caused by market sentiments when there is positive news.
Disclosure: I am part of Trade Nation's Influencer program and receive a monthly fee for using their TradingView charts in my analysis.
Like and subscribe and comment my ideas if you enjoy them!

Stromm | S&P 500 & NASDAQ a RESISTANCE is NearThe S&P 500 and the Nasdaq are basically moving in lockstep right now — their structures look almost identical.
Starting with the S&P 500:
We’re currently trading into a 4-hour Fair Value Gap between $5,546 and $5,634, Sitting just under a 4-hour Order Block that could trigger a short-term reaction.
At the moment, though, it doesn’t really look like we’re going to flush all the way back down toward the $5,000 level (2-hour Order Block sitting much lower).
More likely?
This 4h Order Block just gives us a brief pullback, a minor reaction — and then price pushes higher again.
This would line up perfectly with my original scenario of Wave A completing around $4,805.
Personally, I’m already positioned around $4,800, so obviously, I'd love to see that level hold and price continue moving higher — ideally heading toward $6,000.
That would be the perfect extension — but nothing is guaranteed yet.
Still, structure right now leans bullish unless we see a sudden breakdown.
Now, for the Nasdaq CME_MINI:NQ1! :
Almost the same setup —
We have a 2-hour Order Block just above the current price, acting as short-term resistance,
And another 2-hour Order Block way lower, which now seems less likely to be tested unless something drastic happens.
So for the Nasdaq, the most realistic short-term scenario:
Hit resistance at the current 2h Order Block,
Maybe a small pullback toward 18,900–19,000,
Then continuation higher toward 20,000 or even 21,000 over the next few weeks.

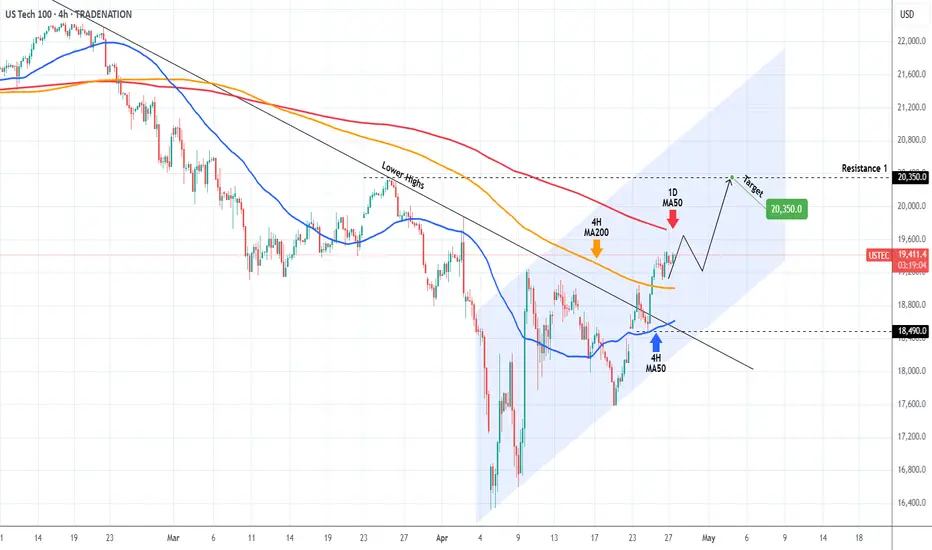
NASDAQ ahead of the most critical Resistance test.Nasdaq (NDX) not only broke above the Lower Highs trend-line of its All Time High (ATH) last week but managed to break and turn the 4H MA200 (orange trend-line) into Support.
It is now aiming for the 1D MA50 (red trend-line), which is the most crucial Resistance level of this recovery attempt and is what technically turns bearish trends into bullish if it turns into Support.
We expect a short-term rejection there, which should give a buy opportunity near the 4H MA200. Our Target for this is 20350 (Resistance 1).
-------------------------------------------------------------------------------
** Please LIKE 👍, FOLLOW ✅, SHARE 🙌 and COMMENT ✍ if you enjoy this idea! Also share your ideas and charts in the comments section below! This is best way to keep it relevant, support us, keep the content here free and allow the idea to reach as many people as possible. **
-------------------------------------------------------------------------------
Disclosure: I am part of Trade Nation's Influencer program and receive a monthly fee for using their TradingView charts in my analysis.
💸💸💸💸💸💸
👇 👇 👇 👇 👇 👇
Stromm | SOLANA Key Zones for Next MovesWe've seen a very solid reaction here — similar to Bitcoin, but still with its own flavor.
The Previous Monthly Low was swept and then reclaimed, which is always a strong bullish signal.
On top of that, the Monthly Open was reclaimed and successfully retested, flipping market structure back to bullish.
No doubt: the trend right now leans upward.
The big question is: where do we go from here?
When you look left on the chart, you see two massive candles:
One day, +30% straight up,
Followed by -22% the very next day.
Pure chaos.
Now, price is pushing back into that zone — and we need to watch how it reacts inside those previous candles.
For targets:
The Weekly Fair Value Gap near the Previous Monthly High is a major zone to watch.
After that, there’s the 2h Fair Value Gap around the Yearly Open — the next big magnet for price.
And it’s worth noting:
Compared to Ethereum, Solana’s Yearly Open is way closer and much more realistically within reach. Another subtle hint that SOL is showing way better relative strength.

Stromm | ETHEREUM No Life Signal YETCompared to Bitcoin, Ethereum is honestly still moving at a snail’s pace — and the performance is almost embarrassing at this point.
There’s still barely any strength showing on the CRYPTOCAP:ETH chart.
Yes, ETH has finally reclaimed the Previous Monthly Low, and it’s holding it — which is a positive step.
But let’s be real:
We’re still 83% below the Yearly Open — a mind-blowing distance when you consider how BTC is behaving right now.
I'm currently risk-free on my trade here, which is a nice position to be in.
If we get another drop, I plan to add at the next Monthly Order Block.
But something serious needs to happen at the Ethereum Foundation level — real fundamental shifts — if ETH is going to deliver the kind of rally people keep hoping for.
Otherwise?
Everything else in the market is outperforming ETH by a mile — and that’s the worst-case scenario for Ethereum:
It doesn't die,
It just gets left behind.
For now, at least I’m sitting in profit, and that's a good start.
Everything beyond this will need careful watching — no blind assumptions, no blind faith.
ETH needs to prove itself — and fast.

Stromm | BITCOIN Are You BULLISH Enough? When you zoom out to the 12-hour chart , Bitcoin actually looks really clean right now. Since my entry at $75,800, we’ve seen a solid 25% rally that’s clearly shifted the momentum back to bullish. -
But even with that move, I’m not fully convinced yet that we’re on our way straight to a new all-time high.
There’s still a lot of work to be done before that happens.
Right now, I’m watching the zone between $96,400 and $102,300 as a potential reaction area — basically a spot where we could see Wave B complete.
We’re hovering around the Yearly Open, which historically acts as both strong support and resistance, and we’re also right at the Previous Monthly High.
If BTC can hold this zone, we absolutely could push higher toward $102K.
However, I don’t think it’s realistic yet to expect a clean shot to $110K without a deeper pullback first.
Most likely, we’ll need another flush lower to reset before any major breakout.
That said, I’m still long and staying patient.
If we do somehow rip toward $120K, I’m already well-positioned.
And if we get another sell-off?
I’ll be adding even more — no hesitation there.
Of course, a lot of this depends on how the political and macro situation evolves.
There’s definitely a world where the perfect narrative gets laid down, and we rocket to $120K.
But there’s also a world where that doesn't happen — and it’s important to stay mentally flexible between "must happen," "could happen," and "might not happen at all."

XAUUSD correcting to its 4H MA200.Gold (XAUUSD) has been trading within a Bullish Megaphone pattern since the start of the year. Last week's rejection on its top (Higher Highs trend-line) has resulted into a break below the 4H MA50 (blue trend-line).
This has technically been the signal that started the previous 2 Bearish Legs, which both bottomed upon touching the 4H MA200 (orange trend-line) and once the 4H RSI got oversold below 30.00.
As a result, we expect more downside, targeting 3160.
-------------------------------------------------------------------------------
** Please LIKE 👍, FOLLOW ✅, SHARE 🙌 and COMMENT ✍ if you enjoy this idea! Also share your ideas and charts in the comments section below! This is best way to keep it relevant, support us, keep the content here free and allow the idea to reach as many people as possible. **
-------------------------------------------------------------------------------
💸💸💸💸💸💸
👇 👇 👇 👇 👇 👇

GBPUSD BULLISH OR BEARISH DETAILED ANALYSIS ??GBPUSD is looking extremely bullish on the daily timeframe, showing strong signs of continuation after a healthy pullback. Currently trading around 1.33000, the pair has respected key Fibonacci levels and is now building momentum to target 1.37000. The structure remains intact with higher highs and higher lows, indicating strong buyer control and potential for further upside movement.
From a fundamental perspective, the British pound continues to outperform as the Bank of England maintains a relatively hawkish tone amid sticky inflation pressures, while the US dollar shows signs of weakening with softer economic data and growing expectations of Fed rate cuts later this year. This divergence between the monetary policies is creating a favorable environment for GBPUSD buyers to dominate.
Technical analysis also supports the bullish bias as price action remains well above the 0.786 Fibonacci retracement level, holding strong support near 1.31650. If price maintains above this zone and breaks past minor resistance near 1.33500, it could ignite a fresh bullish rally toward the psychological level of 1.37000, offering excellent risk-reward opportunities for trend-following traders.
Overall, GBPUSD is positioned perfectly for a strong bullish wave. Traders should stay focused on potential breakout confirmations and capitalize on the momentum, as current market conditions and fundamentals are aligned with a profitable bullish move. This setup remains one of the most attractive trending opportunities on the board right now.

AUDNZD - BEARISH MOVEHello Traders !
After a huge bearish move, The AUDNZD broke the support level (1.07312 - 1.07522).
This key level becomes new resistance!
So, I predict a bearish move📉
_______________
TARGET: 1.06100🎯

Lingrid | GOLD Weekly Analysis: CORRECTIVE Phase after the SurgeOANDA:XAUUSD market initially rallied during the week, reaching the key 3500 level. However, we have a corrective move, showing a bit of profit taking as traders are looking to the tariff noise for direction. The market made a sharp decline resulting in a long-tailed bearish bar on the weekly timeframe, suggesting the price may continue pushing lower toward the 3150 support levels. The price shows similar price action to what we saw at the beginning of this month when a market decline was followed by a week of sideways movement, which then led to continuation of the bullish trend.
I think we might see 2 scenarios to identify the potential endpoint of this corrective move. On the daily timeframe, the price is near the 50% retracement of the bullish swing move, which may be a potential level for continuation. The second scenario is an ABCD pullback where price dips below the 3200 level to find support. In any case, we should react to the price action and how it develops. If the Monday candle gaps up, this potentially indicates that price may move higher. And if we get a gap down, then we can expect a deeper pullback in the market.
Traders, if you liked this idea or if you have your own opinion about it, write in the comments. I will be glad 👩💻

EURUSD below its 4H MA50 signals more selling.The EURUSD pair broke last Wednesday below its 4H MA50 for the first time since the start of April and is now consolidating under it. Within its 3-month Channel Up, this has always been a signal of more downtrend to come as it was technically halfway through the Bearish Legs of the pattern.
Given that the 4H MA200 (orange trend-line) is the medium-term Support, our Target is at 1.12500, just above the Internal Higher Lows trend-line. Check also the 4H RSI sequences between these 3 Bearish Legs. It is exactly ranging between the levels it did half-way through those Legs.
-------------------------------------------------------------------------------
** Please LIKE 👍, FOLLOW ✅, SHARE 🙌 and COMMENT ✍ if you enjoy this idea! Also share your ideas and charts in the comments section below! This is best way to keep it relevant, support us, keep the content here free and allow the idea to reach as many people as possible. **
-------------------------------------------------------------------------------
💸💸💸💸💸💸
👇 👇 👇 👇 👇 👇

EurUsd- Pay attention to 1.1310Recap:
As discussed in last week's update, EURUSD bulls started losing momentum, and a correction became likely.
Current situation:
• The move from 1.1400 to 1.1577 appears to have been a blow-off top.
• Price is now stuck in the middle of the range, showing signs of weakness.
Key level to watch:
• 1.1310 is critical support.
• A confirmed break below could open the path toward the 1.1100 area.
Trading plan:
➡️ I am closely monitoring the 1.1310 zone for a potential breakdown and continuation lower.
Disclosure: I am part of Trade Nation's Influencer program and receive a monthly fee for using their TradingView charts in my analyses and educational articles.

BITCOIN's Trump effect: The 2025 PARABOLIC FINALE is coming!Bitcoin (BTCUSD) has completed 3 straight green 1W candles, making an impressive start into Q2 2025. But is it a coincidence or systemic behavior of technical trends?
It certainly is no coincidence the structure that the market has with Trump under President. Q1 has been undoubtedly disastrous due to the Trade War fueled by back and forth tariffs. But this is a pattern we've seen before and more specifically in Trump's 1st Term during Q1 2017.
As you can see, BTC was again under heavy volatility during Trump's 1st Term Q1, even though the correction wasn't as hard initially. What's more interesting however, is that in both Terms, the U.S. Dollar Index (DXY, blue trend-line) topped in Q1 and started collapsing. In 2017 that was the catalyst that fueled BTC's insane Parabolic Rally for the rest of the year.
Can the current Dollar collapse kick-start a rally for the rest of 2025? If the Trade War stabilizes, it certainly looks so. It is no coincidence that in 2017 Trump came out storming that the Dollar was too high just like he states now that the Interest Rates are too high, pressuring the Fed to cut.
So what do you think? Is the rest of 2025 destined to be as strong as 2017? Feel free to let us know in the comments section below!
-------------------------------------------------------------------------------
** Please LIKE 👍, FOLLOW ✅, SHARE 🙌 and COMMENT ✍ if you enjoy this idea! Also share your ideas and charts in the comments section below! This is best way to keep it relevant, support us, keep the content here free and allow the idea to reach as many people as possible. **
-------------------------------------------------------------------------------
💸💸💸💸💸💸
👇 👇 👇 👇 👇 👇

Lingrid | EURUSD possible REVERSAL from Critical RESISTANCE FX:EURUSD is currently testing a significant upward trendline while consolidating in a narrow sideways range just above this crucial support. Notable bearish signals have emerged, including a clear divergence pattern and a false breakout attempt above the previous higher high level – a classic trap for bullish traders. Adding weight to the bearish case, price action has formed a long-tailed rejection bar on the daily timeframe precisely at the key resistance zone that corresponds with the 2022 high level. This powerful rejection at historical resistance shouldn't be overlooked. I anticipate a meaningful pullback once price decisively breaks below the upward trendline support. This corrective move appears increasingly probable given that price has now completed a textbook ABC pattern on the daily timeframe. The completion of this pattern, combined with the other technical signals, suggests we're likely at an inflection point where momentum could shift significantly to the downside. My goal is supprot zone around 1.11550
Traders, if you liked this idea or if you have your own opinion about it, write in the comments. I will be glad 👩💻

97K and 88KMorning folks,
So picture almost has not changed since our last talk. Now we get great setup on monthly chart with upside potential starting from 110K and up to 127K. And our task now is to join this coming action.
It would be great to get a pullback, but the shape of intraday market has changed slightly and it seems that BTC is forming 3-Drive "Sell" with target around 97K. Hopefully this pattern will trigger the pullback that we need.
If it happens, then the next area that we will be watching is around 88-90K, which is nice support area .
That's being said, our strategy for now is action to ~97-97.3K first and pullback to 88-90K second.
I mark this update as "bullish" due to our first point, but you've got the idea.

Lingrid | BTCUSD weekly BULLISH Closure Above KEY LevelsThe price perfectly fulfilled my last idea . It reached the target level. Last weekly candle closed bullish showing bulls stepped in, and previous week BINANCE:BTCUSDT closed above the last 6 week highs. The market completed the ABC movement, therefore the market is moving sideways around the 95,000 level. At this point we can see the pullback in the market since it's testing the previous week high and ABC completion. This pullback would give us the opportunity to go long from the support zone in expectation of continuation. Looking left on the daily chart, we can see the price kept rebounding from the support level around 90,000 from November and February, which shows the importance of this zone. If the price pulls back toward this key level, the chance of bouncing off is pretty high. This historical support combined with the recent bullish momentum creates a compelling case for potential upside continuation after the current retracement completes. My mid-term goal is resistance zone around 99600
Traders, if you liked this idea or if you have your own opinion about it, write in the comments. I will be glad 👩💻

AVAX Analysis: Building Up for a Potential Breakout🔹 Since mid-December, AVAX dropped hard, losing more than 70% from the highs.
🔹 Recently, the coin found strong support around the $15 zone, testing it twice — possibly forming a double bottom pattern.
🔹 At the time of writing, price is consolidating right under the neckline and seems to be building momentum for a move.
Key technical points:
• Massive drop from $55 opens room for a stronger relief rally.
• A breakout above the $23 resistance would confirm bullish continuation.
• $18 is now the new support zone — as long as it holds, the bias remains bullish.
• Major target for bulls: $30–31 area.
🚀 Plan: Watching for a confirmed breakout above $23 for potential continuation higher. As long as $18 support holds, dips could be seen as opportunities.

Bitcoin: Short-Term Bullish, but Herd Mentality ReturnsAfter reaching my 75K target, Bitcoin started to recover nicely. In its comeback, it delivered two important bullish confirmations:
➔ First, it broke above the descending trendline around 84K.
➔ Then, it made a small consolidation, followed by a new leg up that pushed the price above the critical 92K technical zone — also reclaiming the psychological 90K mark.
At the time of writing, the price holds well above horizontal support. From a technical perspective, as long as the 90-91K area remains intact, we can expect higher prices. The next big resistance is around 100K, and if support holds, we might see Bitcoin testing that zone again in the coming days.
Speculators could look to buy dips as long as the structure stays healthy.
My take:
Even though the setup looks technically decent, I'm personally staying out for now. Once again, the crowd is shouting that "the correction is over" and "it's time to buy" — a classic red flag in market psychology.
