Lingrid | TONUSDT price Deceleration at RESISTANCE ZoneOKX:TONUSDT market surged by 20% following the surprising news that Telegram founder Pavel Durov had regained his passport, allowing him to travel freely. Consequently, the market bounced off the support level and nearly reached the 4.00 resistance zone. However, as it approached this resistance zone, signs indicated a potential pullback; the price has been decelerating and a bearish divergence is evident. Additionally, on the daily timeframe, we observe candles with wicks indicating rejection. Therefore, I expect the market may form a short corrective move toward the support level. My goal is support zone around 3.330
Traders, If you liked this educational post🎓, give it a boost 🚀 and drop a comment 📣
Signalservice

PDAUSDT(PlayDapp) Updated till 21-03-25PDAUSDT(PlayDapp) Daily timeframe range. PA is in its lowest low zone. if PA dont have devs backup it solely depends on market maker thats just sad. thats how it creates new low. recent resistance at 0.02288 if there is a retest it will happen above it.

Lingrid | BTCUSDT price Compression FIRST, Expansion NEXTThe price perfectly fulfilled my last idea . It hit the target level. BINANCE:BTCUSDT market is consolidating above the 80,000 level after breaking below the February low. Recently, a large weekly doji candle has formed, indicating a sideways movement. Currently, the price is trading within this week's range. Looking at the broader picture, we can see that the price action is narrow, and the market is creating a falling wedge pattern. Since the market is consolidating below the downward trendline, I anticipate a breakout above it, which would likely lead to further extension. If the price closes above the last week's high, we could see the formation of a solid inverse head and shoulders pattern in the market. My goal is resistance zone around 88,000
Traders, If you liked this educational post🎓, give it a boost 🚀 and drop a comment 📣

Lingrid | AUDUSD breaks the UPWARD channel. Potential ShortFX:AUDUSD market broke and closed below the upward channel following a bullish momentum, and the price has also fallen below the swap zone where it previously bounced twice. On the daily timeframe, the market appears bearish, indicating potential further declines due to prevailing bearish dominance. A shift in market structure is evident, with price making lower lows and breaking below previous higher low. Unless upcoming news positively influences the market, I think the price will likely continue to move lower. My goal is support zone around 0.62910
Traders, If you liked this educational post🎓, give it a boost 🚀 and drop a comment 📣


Lingrid | AVAXUSDT reached WEEKLY high. ShortThe price perfectly fulfilled my previous idea . It hit the target level. BINANCE:AVAXUSDT has gradually climbed higher after bouncing off a key support level and is currently testing the previous week's high, which has been respected multiple times. Furthermore, it continues to respect the upward trendline. However, on higher timeframes, the market remains heavily bearish, with prices dipping below the August low of 2024. Following such a significant bearish movement, the price will likely consolidate for a period. I expect a rebound from the psychological level at 20, followed by a retest of the support level. My goal is support zonearound 17.05
Traders, If you liked this educational post🎓, give it a boost 🚀 and drop a comment 📣

Gold- I'm looking to sell for 500+ pips targetAs I explained before, when I trade TRADENATION:XAUUSD , I aim for targets of 400-500 pips , sometimes even more. That’s why I always try to determine where "the BIG move" is. In Gold’s current situation, I believe this move is down, not up (though, of course, I don’t have a crystal ball).
Let me explain...
Since the beginning of March, Gold has surged by more than 2000 pips. While we need to adjust our pip calculations given Gold’s current price levels , this is still an enormous rise. More importantly, out of these 2000 pips, 1700 were gained just since last Wednesday. This makes a correction highly likely, especially considering that if we look at the chart, we see almost no pullbacks in the past week—only a consolidation in a rectangle.
From a technical standpoint, the trend is undoubtedly up. However, even if Gold drops to 2990, the overall uptrend would still remain intact. Additionally, looking at the chart, we can spot a rising wedge—typically a reversal pattern.
My Take:
Currently, I’m out of the market, but I expect a strong correction of 500+ pips. I’m looking to sell if there’s an upward spike followed by signs of exhaustion.
Conclusion:
In my opinion, "the big move" is down, not up. I expect Gold to drop below 3000 and at least test the 2990 zone.
Disclosure: I am part of Trade Nation's Influencer program and receive a monthly fee for using their TradingView charts in my analyses and educational articles.

LINAUSDT(LinearFinance) Updated till 20-03-25LINAUSDT(LinearFinance) Daily timeframe range. PA is in trouble zone it did build a recent support at 0.001601. but it needs to stay above 0.002296 to get out of trouble zone and for pullback. above 0.002296 you got safer and rewarding setups.

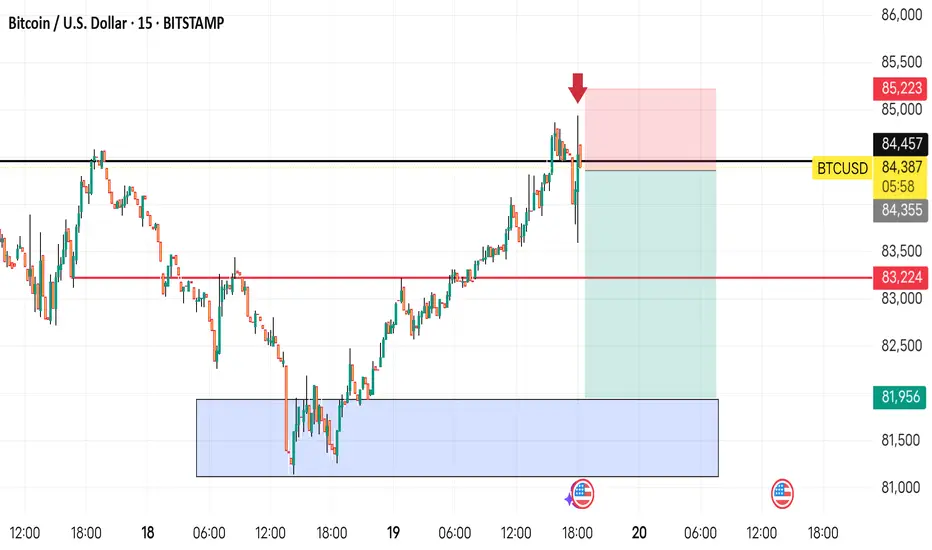
BTCUSD 15MINUTES. SHORT TRADE SETUP, CHECK CAPTAIN..This is a Bitcoin (BTC/USD) 15-minute chart from TradingView, showing a trade setup. Here’s what it means:
1. Resistance Level (Black Line at $84,355-$84,457): Price tested this zone but failed to break above it.
2. Short Trade Setup:
The red arrow indicates a sell entry at the resistance level.
The red box above represents the stop-loss area ($85,223), meaning if the price moves above this, the trade would be invalidated.
The green box below is the take-profit area, with a target around $81,956.
3. Price Rejection: BTC/USD attempted to break resistance but was rejected, suggesting a potential move lower.
4. Liquidity Zone (Blue Box): A previous demand zone where buyers stepped in, indicating a possible support level.
Overall, this chart suggests a bearish trade setup, where the trader expects Bitcoin to decline from the resistance zone.
XRP’s Bullish Setup: Why I’m Targeting $3 with a 1:4 Risk-RewardAfter its recent impressive rally to $3, XRP has shown remarkable resilience during the correction, establishing a strong support level around the $2 mark.
Despite the broader downturn in the crypto market, XRP has held up well, demonstrating significant strength.
Last week, XRP tested this $2 support level once again and rebounded, reinforcing its stability. The current price action is shaping a bullish flag pattern, which suggests that a new upward move could be on the horizon.
With this in mind, I am looking to buy XRP, anticipating a potential breakout.
Given my target of around $3, I am aiming for a 1:4 risk-reward ratio for this trade

After an 80% Drop, Is FET Finally Ready to Reverse?Exactly one year ago, FET reached its all-time high of $3.5, but since then, it has experienced a steep decline of over 80%.
However, the coin has recently found strong technical support around the $0.45 zone, which, in my view, signals a potential rebound on the horizon.
Currently, FET is trading near $0.52, and from a psychological standpoint, being around a key round number and its Binance listing price, we could see a bounce from these levels.
With this in mind, I anticipate a trend reversal, with an initial target of $1 in the near future. Additionally, $0.80 stands as a significant resistance level and could serve as an interim target before further upside movement.
From a risk-reward perspective, this setup offers an attractive 1:5 ratio

Lingrid | GOLD bulls Maintain MARKET DominanceThe price perfectly fulfilled my last idea . It hit the target zone. OANDA:XAUUSD market continues to climb, having broken and closed above the psychological 3000 level. Previously, the price struggled to break through, creating a range before this upward movement. I think the ideal buy price could be just below the previous day's low and the psychological level. At this stage, the market may form a corrective move toward the support level and the upward trendline then rebound. I expect the range zone around 2980 to act as a solid support area in anticipation of the bullish trend's continuation. My goal is resistance zone around 3055
Traders, If you liked this educational post🎓, give it a boost 🚀 and drop a comment 📣

Lingrid | NZDJPY Monthly-Level Shorting OpportunityThe price perfectly fulfilled my last idea . It hit the TP level. For the past two weeks, FX:NZDJPY price has been in a bullish trend; however, it has hit the resistance zone and is currently moving sideways around this level. On the daily timeframe, a rejection candle has formed, but the price has yet to retest the February high where liquidity is resting above. I expect the price may aim to grab that liquidity before moving lower while forming a bearish divergence. If we see a rejection at the resistance around 87.500, there is a good possibility that the price will create a corrective leg. My goal is support zone around 85.800
Traders, If you liked this educational post🎓, give it a boost 🚀 and drop a comment 📣

Lingrid | DOTUSDT capitalizing on PULLBACK in a BEARISH TrendThe price perfectly fulfilled my last idea . It hit the target zone. BINANCE:DOTUSDT market bounced off a level that was previously tested in November. Following this bounce, the price appears to be forming an ABC pullback and is moving towards the channel boundary. Examining the chart, we can see that the price has respected the resistance zone multiple times. Given the current bearish trend, the market may enter a consolidation phase, and therefore I expect that the price to consoldiate and stabilizing between 4.88 and 4.00. My goal is support zone around 4.100
Traders, If you liked this educational post🎓, give it a boost 🚀 and drop a comment 📣

Hellena | GOLD (4H): LONG to 161.8% Fibo lvl area at 3038.Dear colleagues, I believe that the upward movement is not over yet. The bulls have gained strength and the upward five-wave movement is not over yet!
I expect that the wave “3” of senior and middle order is not yet complete. Possible correction to the area of 2955.837, then I expect an upward movement to the area of 161.8% Fibonacci extension 3038.730.
As usual - the upward movement is in priority, so I do not recommend short positions, but I recommend long limit pending orders.
Manage your capital correctly and competently! Only enter trades based on reliable patterns!

Hellena | Oil (4H): SHORT to the area of 64.00 (Wave C).Colleagues, at the moment we see a situation where it is difficult to determine the end of the movement. Wave “C” is not completed and I believe that we should expect the continuation of the downward movement. I do not set distant targets, so I expect the price to reach the area of 64.00.
A correction to the area of 67.884 shift is possible.
Manage your capital correctly and competently! Only enter trades based on reliable patterns!

Gold is on Fire—But Can Bulls Hold the Line?Gold has been surging, and while I expected it to hit $3,000 this year, I definitely didn’t anticipate it happening in the first semester...
So, let’s address the big question: Can the bulls maintain this level?
Looking at the chart, since early March, TRADENATION:XAUUSD has climbed 2,000 pips (around 7%), but what stands out is that 1,500 of those pips (5%) came in just one week.
No matter how strong the bullish momentum and fundamentals are, I believe this kind of rally is unsustainable.
Technical Outlook
After pulling back from its all-time high of 2,950, gold made a false breakout, followed by an almost vertical move upward, briefly interrupted by two consolidation phases.
Fundamental Factors
The FOMC meeting is today, and while rates are expected to remain unchanged, the real market mover will be Jerome Powell’s press conference. His comments could trigger significant price action.
My Take
I expect gold to start correcting after the press conference, regardless of what Powell says. However, this is a highly risky trade, so I’ll stay on the sidelines until I see a clear reversal signal.
Final Thoughts
At the time of writing, gold is consolidating within another rectangular range, with resistance at 3,040. If we see a spike above and then a drop back to around 3,030, that would signal ( for me ) that gold has topped—at least for now. In that case, I’ll be looking to short with a target of at least 500 pips. Until then, my approach is simple: wait and see.
Disclosure: I am part of Trade Nation's Influencer program and receive a monthly fee for using their TradingView charts in my analyses and educational articles.

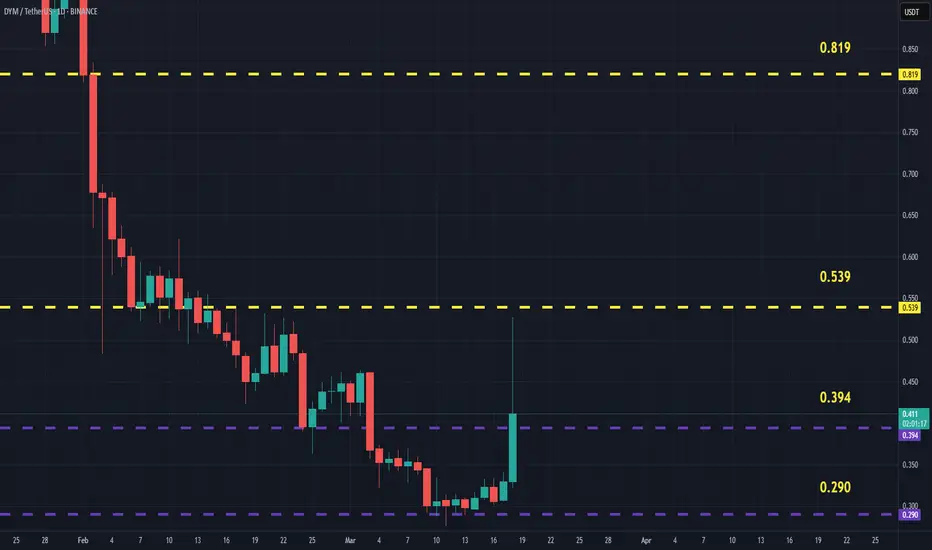
DYMUSDT(dymension) Updated till 18-03-25DYMUSDT(dymension) Daily timeframe range. PA is very close to its price discovery level its better if it can stay above it. range level gap for lack of data its huge here. for that if pullback happens it will be hard. if cant stay above 0.394 back to its low.
Lingrid | AUDCHF short OPPORTUNITY at Top of the MARKET RangeThe price perfectly fulfilled my last idea . It hit the target zone. As we can see, FX:AUDCHF is oscillating between the 0.56550 and 0.55000 levels, having recently reached the top of this range. After bouncing off the support level, the price began to form an ABC move, which typically precedes a pullback. Additionally, the price has reached the upper border of the channel and trendline, where it has previously dropped twice. Given that the price is currently consolidating, I think it may bounce off the resistance again, leading to a move lower as we anticipate a continuation of the sideways trend. My goal is support zone around 0.55835
Traders, If you liked this educational post🎓, give it a boost 🚀 and drop a comment 📣

Historic Milestone for Gold: My Outlook and Key Support LevelsLast Friday, for the first time in history, Gold printed a "3" handle, and since the beginning of the year, it has already climbed an impressive 4,000 pips.
However, what matters most now is what Gold will do next.
As we can see on the chart, after reaching a new all-time high (ATH) at 3005, Gold has started to pull back slightly and has recently formed a support level around 2980.
As I also mentioned in my Friday analysis, although I expect a correction, I don’t see Gold dropping all the way back to test the previous ATH zone at 2950 , which should now act as a strong support. Instead, even if Gold breaks below the newly formed 2980 support, I will be watching for reversal signs between 2965 and 2970, and from there, I expect a new bullish wave and a fresh all-time high.
In conclusion, my strategy remains unchanged: buy the dips.
Disclosure: I am part of Trade Nation's Influencer program and receive a monthly fee for using their TradingView charts in my analyses and educational articles.

Lingrid | ETHUSDT October 2023 LEVELS ReachedBINANCE:ETHUSDT price continues to push lower, reaching the support level that was last tested in October 2023. Historically, we can observe similar price action from 2021, when the price fell from the 4300 level and subsequently bounced off the 1700 support zone, leading to all-time highs. On the current chart, we see that the price has broken above the downward trendline that has acted as a resistance zone for the month. I think the price will continue to move sideways for the next couple of weeks, potentially pushing higher if we see buying pressure from the support level. My goal is resistance zone around 2190
Traders, If you liked this educational post🎓, give it a boost 🚀 and drop a comment 📣

USD/JPY Eyes 151 Resistance After Bullish BreakoutLast week, USD/JPY reached my target at the 146 zone. After testing this support level, the pair began to reverse upward and broke above the falling wedge pattern, signaling a potential trend change.
On Friday, the pair formed a higher low, followed by another one today.
As of now, USD/JPY is trading at 147.75, just below a key horizontal resistance level. A breakout above this level could lead to further upside, with the next target around the 151 resistance zone.
Disclosure: I am part of Trade Nation's Influencer program and receive a monthly fee for using their TradingView charts in my analyses and educational articles.

Resistance at 1.3T: Is a Deeper Crypto Correction Coming?The long-awaited Trump inauguration, which was expected to trigger an altcoin season, had the exact opposite effect. This once again proves that when the majority of market participants expect one outcome, the market often does the opposite.
After several days of testing support, the "tax policy" announcement triggered a breakdown below the 1.3T level, causing Total 3 to drop around 30% to 1T.
The market is now experiencing a normal rebound, but I am not very optimistic in the medium term.
Technically, 1.3T has now turned into strong resistance. In my opinion, after this rebound, a new leg down is likely.
I expect a drop below 1T, potentially reaching around 900B in the near future.

US100 / NASDAQ TodayNASDAQ for me is still sell as long is below 19750
I wait for pattern on H1 for entry sell with TP new low
