Lingrid | XRPUSDT Head and Shoulders Pattern: Bearish Signal?BINANCE:XRPUSDT is currently making lower lows and lower closes. The market took liquidity above the 2.80 level before pulling back to the support level at 2.00. This movement essentially created a false breakout, suggesting that buyers are hesitant to enter the market at those price levels. Taking a broader view, we can observe that the price action is forming a head-and-shoulders pattern, which is typically indicative of a reversal. Given that the previous weekly candle was a significant bearish candle, it suggests that the price may retest the 1.50 level. Therefore, I anticipate XRP to retest the resistance followed by moving lower. My goal is support zone around 1.63
Traders, if you liked this idea or if you have your own opinion about it, write in the comments. I will be glad 👩💻
Signalservice

Choppy Gold Price Action: Bearish Bias, But With CautionIn my post yesterday, I mentioned that Gold would likely break below the 2900 support zone.
Indeed, after multiple tests and annoying price action, the price finally dropped below this level, reaching an intraday low of 2880. However, it quickly reversed and is now trading back around the same level.
To be honest, while my outlook remains slightly bearish, this kind of choppy movement is not ideal.
In conclusion, my strategy remains to sell on rallies—but with caution and lower volumes.
Disclosure: I am part of Trade Nation's Influencer program and receive a monthly fee for using their TradingView charts in my analyses and educational articles.

Lingrid | AUDCAD potential BREAKOUT of Weekly HighFX:AUDCAD market is currently testing the previous weekly high, and there is a possibility that the price may move higher from this area. It has been making higher highs and higher lows, and it recently broke above the trendline, signaling a shift in market. The price took out liquidity below the psychological level at 0.9000. While it may attempt to move directly toward the resistance zone, I think that is unlikely. Instead, the price may pull back to retest Tuesday's high, creating a short-term pullback before continuing bullish move. I expect that market will move higher toward the next key level to test a channel border. My goal is resistance zone around 0.91500
Traders, if you liked this idea or if you have your own opinion about it, write in the comments. I will be glad 👩💻

Lingrid | BTCUSDT falls to NEW Lower LOWS. Potential Short BINANCE:BTCUSDT price dropped below the 90,000 level. The previous weekly candle was a big bearish one, indicating a decline of 15%. Recently, the price broke below the upward trendline and closed below the higher low indicating potential trend continuation. I think the market will continue to push lower to test the liquidity below February's low. I anticipate that the price may find support around the October highs, between 74,000 and 76,000. Overall, I expect the price to bounce off the resistance and the upward trendline. My goal is support zone around 76700.00
Traders, if you liked this idea or if you have your own opinion about it, write in the comments. I will be glad 👩💻

Lingrid | GOLD Weekly Market OUTLOOK: Sideways MOVE After 2900 This trading week the OANDA:XAUUSD market went through a three-day sideways movement following two trending days. After breaking through the 2900 level, the price is now stuck in the range zone. Notably, the price failed to reach last week's high or low, forming an inside bar pattern on the weekly timeframe. This suggests that a false breakout of last week's highs or lows could determine the next move in the market in the near term.
Interestingly, gold struggled to rally further upward despite the sharp drop in TVC:DXY amid escalating trade tensions. This may indicate that prices may continue to move sideways between 2940 and 2870. Zooming out, we can expect that price action appears to be forming a triangle pattern, which is a typical consolidation pattern. I think there is a possibility that the market could form a second corrective leg down or retest the weekly opening levels. Some oscillators are showing a hidden bearish divergence, which supports the idea of another corrective leg down. Overall, I expect the market to continue to fluctuate until price breaks above or below last week's high or low.
Traders, if you liked this idea or if you have your own opinion about it, write in the comments. I will be glad 👩💻

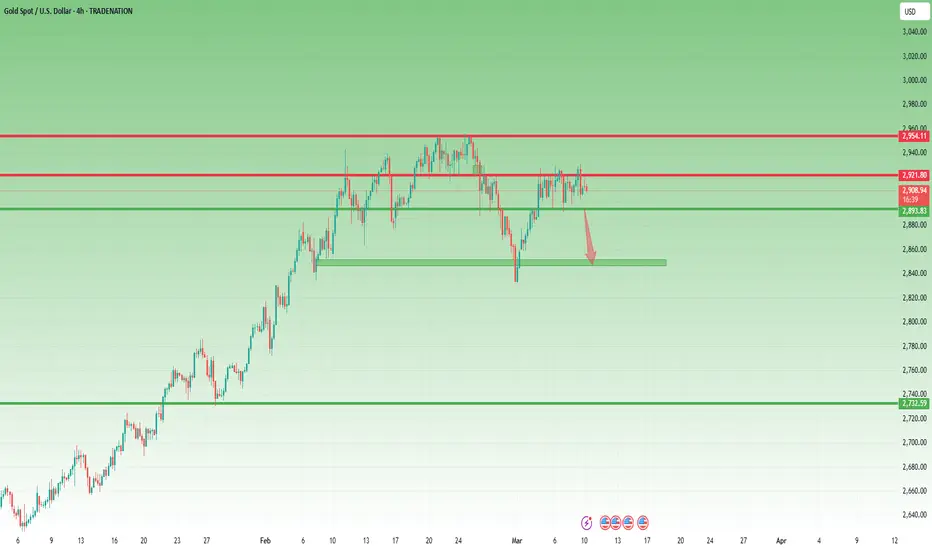
Gold Outlook Unchanged: Waiting for a Break Below SupportFriday's NFP turned out to be a non-event, with gold prices remaining stuck in their familiar range between 2,895 and 2,930.
Following the announcement, prices initially spiked to resistance but quickly retreated to the middle of the range by the weekly close.
Looking ahead, my outlook remains unchanged—I expect a break below the 2,895 support level. If this happens, we could see accelerated downside momentum, potentially testing recent lows in the 2,830–2,840 zone.
My strategy also remains the same: selling rallies against the range’s resistance.
Disclosure: I am part of Trade Nation's Influencer program and receive a monthly fee for using their TradingView charts in my analyses and educational articles.
Lingrid | EURUSD pullback After an IMPULSIVE SurgeFX:EURUSD market reached the November high area and is currently testing last week's high as well. On the weekly timeframe, the price has formed a large bullish candle, indicating an impulse leg. Typically, after such a move, prices tend to make a sharp drop. Given the presence of both the weekly and November highs above, I think the market may struggle to move higher. I expect a more oscillating phase below the resistance. On the 4H timeframe, the price has formed a higher high; however, there is a bearish divergence that supports the idea of a corrective move in the market. I expect a short-term pullback from the resistance zone. My goal is support zone around 1.07000
Traders, if you liked this idea or if you have your own opinion about it, write in the comments. I will be glad 👩💻

Hellena | GOLD (4H): LONG to resistance area 2955 (Wave 3).Dear Colleagues, after Trump's statements and the general political situation, the price went sharply into a downward movement, but this does not mean that I give up the upward movement.
At the moment I think that wave “2” is completing the correction and soon we will see the long-awaited upward movement.
I think that the price can still update the minimum of wave “2” in the area of 2833, then (or immediately) will start an upward movement in wave “3” at least to the area of the maximum of 2955 of wave “1”.
Manage your capital correctly and competently! Only enter trades based on reliable patterns!

Fatigue in EUR/USD: Time to Sell the Rallies?Last week, EUR/USD saw an explosive rise, breaking above my 1.06 target and even surpassing the next resistance at 1.08.
However, signs of fatigue are emerging, and there appears to be significant selling liquidity around the 1.09 level.
With the DXY currently in a support zone and potentially set for an upward reversal, I expect EUR/USD to decline and correct its 500-pip rally.
A break back below 1.08 would confirm this scenario, potentially leading to a test of the 1.06 zone.
Selling rallies near 1.09 could offer a favorable risk-reward opportunity.
Disclosure: I am part of Trade Nation's Influencer program and receive a monthly fee for using their TradingView charts in my analyses and educational articles.

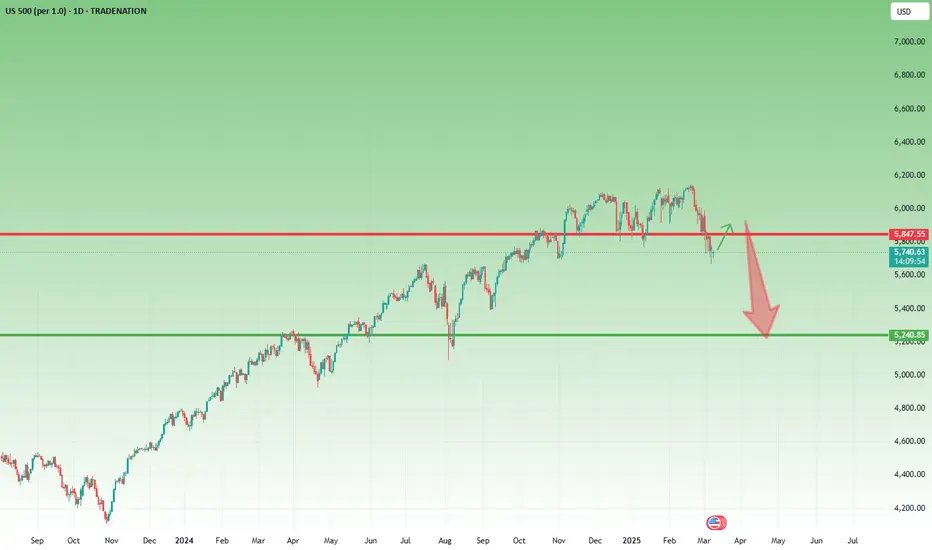
Bearish Outlook for US500: Watching 5,200 SupportAfter testing support at the end of February, the US500 fell below this key level at the start of March, signaling the potential for a deeper correction.
In my view, this scenario is likely, and any rebound this week could present a good selling opportunity for speculators.
My target for this correction is the 5,200 support zone. A stabilization above 6,000 would invalidate this outlook.
Disclosure: I am part of Trade Nation's Influencer program and receive a monthly fee for using their TradingView charts in my analyses and educational articles.
DGBUSDT(DigiByte) Updated till 08-03-25DGBUSDT(DigiByte) Daily timeframe range. we can see a steady move from its local low till now. trying to stay above 0.01028 as volume is decent here if it can than it can push further levels. if 0.01028 fails than back to local low.

Lingrid | SUIUSDT continued DOWNTREND with NEW Lower LowsBINANCE:SUIUSDT is currently showing lower lows, indicating a selling trend in the market. Although it seems to have stabilized around the 2.50 level, a closer look at the price action reveals the formation of bearish long-tailed bars, suggesting potential for further declines. Given the prevailing bearish dominance, I think there is a possibility that the price may retest the support area above 2.00. I expect it to be a critical point for the market in the near future. The bearish sentiment suggests that we may look for opportunities to short the asset as it approaches this support level. My goal is support zone around 2.18
Traders, if you liked this idea or if you have your own opinion about it, write in the comments. I will be glad 👩💻

PROSUSDT(Prosper) Updated till 07-03-25PROSUSDT(Prosper) Daily timeframe range. while many alts getting cucked right now this thing outperforming today. it got volume if it can get a valid close above 0.5528 that can push it to 0.8380. and that is close to its all time high range.

Lingrid | GOLD coiled UP for a BREAKOUT Ahead of NFPOANDA:XAUUSD has nicely bounced off the support level and is currently testing the previous day’s high. With the market trading within the range of the previous day, it seems to be in anticipation of the upcoming NFP data. There are two daily highs above the current price, which may create some resistance for further upward movement. However, considering the bullish momentum since the start of the week, it appears that the price might be forming an ABC move suggest that the market may reach 2985 level. I think price may retest the zone above last week's high then pulling back closing below it. Overall I expect upward spike, if the upcoming news doesn't negatively impact the price. My goal is resistance zone around 2945
Traders, if you liked this idea or if you have your own opinion about it, write in the comments. I will be glad 👩💻

Lingrid | USDCHF pullback Trade as BEARISH Momentum ContinuesThe price perfectly fulfills my previous idea . It reached the target. The FX:USDCHF is making lower lows and lower closes, indicating bearish momentum in the market. Recently, it broke through the downward trendline and the significant level of 0.89000. On the weekly timeframe, the price is currently trading within a big range between 0.84000 and 0.92000. Given that the price has recently bounced off resistance and is heading toward the lower end of this range, I expect a shorting opportunity. If the price pulls back to the resistance around the downward trendline zone, I expect it to continue moving lower toward the December low level. My goal is to support zone around 0.86800
Traders, if you liked this idea or if you have your own opinion about it, write in the comments. I will be glad 👩💻

Lingrid | TONUSDT short-Term BULLISH Momentum on the HorizonOKX:TONUSDT market reached the 3.00 support level, as I predicted in my previous forecast . Currently, the price is fluctuating around this psychological level, squeezed between the support level and a downward trendline. This situation is likely to result in a breakout, and I think the market may push higher, given that the price continues to bounce off the support level. Notably, it reached the March high of 2024. Thus the price may oscillate around the 3.00 level, moving up and down. However, I expect an upward movement if the unexpected news does not have a negative impact on the cryptocurrency market. My goal is resistance zone around 3.250
Traders, if you liked this idea or if you have your own opinion about it, write in the comments. I will be glad 👩💻

Hellena | EUR/USD (4H): LONG to the area of 1.08878 (Wave C).Well, colleagues, it happens, wave “3” continued its rapid development. Wave “3” is usually the longest and it happens that it becomes too long on the news background, which we saw.
At the moment, I assume that the correction in wave “4” will still take place in the area of 1.06966, to then complete wave “5” at least in the area of 1.08878.
But there is another option - wave “3” is still not over. This happens often in wave analysis, so use limit orders.
Manage your capital correctly and competently! Only enter trades based on reliable patterns!

Why I shorted BTC?In last weekend’s crypto analyses, I mentioned that many altcoins were in a support zone, with a strong chance of a reversal from that level.
Shortly after I published my analyses, the announcement regarding the federal crypto reserve was released, triggering a massive pump.
However, this surge was short-lived, and prices quickly retraced back to their initial levels. For me, this is not a good sign—when major positive news fails to sustain gains, it often signals weakness in the market.
Now, regarding Bitcoin: although its price remains above the announcement level, it has struggled to hold gains above the 91K support level and continues to break below it.
I don’t believe prices are dropping just to set up a massive bull run for everyone to buy in—this looks like a bearish signal to me.
As a result, I have shorted BTC and expect a decline to 75K. That said, with my stop-loss placed above the initial pump’s high, I’m currently running a 1:3 risk-reward ratio, which—regardless of the outcome—is ideal in my book.

Will the NFP report act as a catalyst for a downside breakout?In my post yesterday, I argued that multiple resistance levels exist above 2925, which could lead to a market decline.
Indeed, throughout the day, gold dipped below 2900 once again, but support held, keeping the price stuck in a range.
Looking ahead, today’s NFP data could act as a catalyst for a breakout from this range.
My bias remains bearish, and I expect a break of the support level, followed by a continuation downward toward last week's lows.
However, a breakout and sustained buying above 2925 would shift my outlook.
Disclosure: I am part of Trade Nation's Influencer program and receive a monthly fee for using their TradingView charts in my analyses and educational articles.

HARDUSDT(KavaLend) Updated till 06-03-25HARDUSDT(KavaLend) Daily timeframe range. hard going hard for a while now, defended its local low instead of creating new low and today trying to get a valid close above 0.1484. which can lead it to 0.2183 if retail interest keeps up.

Lingrid | GOLD possible CONSOLIDATION phase in the MARKETOANDA:XAUUSD market is currently trading sideways. A look at the daily chart reveals that the price has printed a doji candle, indicating indecision. Price action has created a range around the 2910 level, and it is now pushing lower after failing to break above. There is a potential for the price to retest the support zone between 2870 and 2880, which has been respected multiple times in the past. On the weekly chart, we can see the formation of an inside bar pattern, and the current weekly candle may end up doji bar. Since we high-impact news, we can expect increased volatility in the market. My goal is resistance zone around 2920
Traders, if you liked this idea or if you have your own opinion about it, write in the comments. I will be glad 👩💻

A free signal for $GVVisionary NASDAQ:GV has secured a $1 billion financing consent letter with Qatar’s Alfardan Group to fuel R&D and global expansion of its PEGASUS new energy vehicles. This major funding will boost innovation, production, and market presence, positioning Visionary as a key player in the rapidly growing new energy vehicle industry. Stay tuned for more updates as Visionary accelerates its journey toward international success!

Gold Price Action: Why I Took Profits EarlyYesterday, gold initially dropped below 2900, briefly testing the 2895 zone as support before reversing sharply to the upside.
Although I had a sniper entry with a 500-pip profit target, I chose to close my trade with a 250-pip profit instead.
The reason for this decision is the strong resistance between 2920 and 2930, along with multiple barriers extending toward 2940.
Looking ahead, a breakdown below 2910 would confirm my slightly bearish bias and could trigger a new leg downward.
For now, I’m staying out of the market, waiting for confirmation of my bearish outlook before initiating sell positions.
Disclosure: I am part of Trade Nation's Influencer program and receive a monthly fee for using their TradingView charts in my analyses and educational articles.

XAUUSD: Riding the Trade War Wave: Will We See New Highs?Hey Realistic Traders, Will OANDA:XAUUSD See New All-Time High Soon? Let's dive into the analysis...
Analyzing XAUUSD price movements using Elliott Wave Theory suggests a possible significant upside in Wave 5. Wave 3 previously didn't go beyond the 1.618 Fibonacci extension, classifying it as a normal wave. Wave 4 then retraced to around the 0.618 Fibonacci level, forming a bullish descending broadening wedge pattern.
The breakout from this descending broadening wedge on the 1-hour chart, combined with a golden cross in the MACD indicator, indicates the potential start of Wave 5. Since Wave 5 is expected to be extended, its movement might be greater than Wave 3. However, we conservatively expect the extended Wave 5 to reach a maximum of the 0.786 Fibonacci level.
Based on these technical indicators, the price is projected to rise towards the target of 2950, and possibly the second target at 2969, as long as it stays above the critical stop loss level of 2900.
Support the channel by engaging with the content, using the rocket button, and sharing your opinions in the comments below.
"Disclaimer: "Please note that this analysis is solely for educational purposes and should not be considered a recommendation to take a long or short position on Gold".
