$SMH: First the generals then the index NASDAQ:SMH with closing @ 180 $ on 04 April 2025 is equivalent to drawdown we saw during COVID crash. During the covid crash the semiconductor ETF lost 37% and this tariff crash we also saw 36% drawdown. If this tariff war on goes then we might see some more weakness. With this drawdown the NASDAQ:SMH is below its 200 Day SMA. ‘Nothing good happens below 200 Day SMA’ and the ETF is below the upward sloping channel. The RSI is also touching the lows the lows we saw during the COVID time reaching the oversold mark of 30.
This weakness can be attributed to heavy weights like NASDAQ:NVDA and NASDAQ:AVGO which have been down more than 40% form their ATH. But the question remains will the drawdown stop here or there is some more pain. But we should not forget the 3-day rule in the markets. Where the sell off peaks off in the 3rd Day. 07 April will be the 3rd Day after the tariff selloff.
Should we call the bottom here? Unless we think that there will be a recession then these are good levels to buy. But if the tariff negotiations go on for longer period, then there will be chop around for a longer period and instead of a V shaped recovery we might see a U-shaped recovery in SMH.
Verdict: Accumulate some NASDAQ:SMH here and go extra-long @ 170-180 $
SMH


SMH | SHORTNASDAQ:SMH
VanEck Semiconductor ETF (SMH) Weekly Analysis:
Current Price Action:
SMH is trading at $218.43, down 9.10% for the week.
Price has breached the upward trendline support, indicating potential further downside.
Key Levels:
Bearish Line: $214.18
Target Price 1: $199.15
Target Price 2: $172.35
Target Price 3: $155.65
Target Price 4: $136.10
Support Zones:
Immediate support is expected around $199.15.
Further support levels are $172.35, $155.65, and $136.10.
Resistance Levels:
Resistance is at the broken trendline near $240, followed by the recent high around $300.
Relative Strength Index (RSI):
RSI is at 53.98, trending downwards, suggesting weakening momentum.
Volume:
Volume is significant at 75.462M, indicating strong selling pressure.
Conclusion:
SMH's breakdown below key support levels and significant bearish momentum suggest further downside potential. Watch for reactions around $199.15 and $172.35 for potential entry points or further declines.

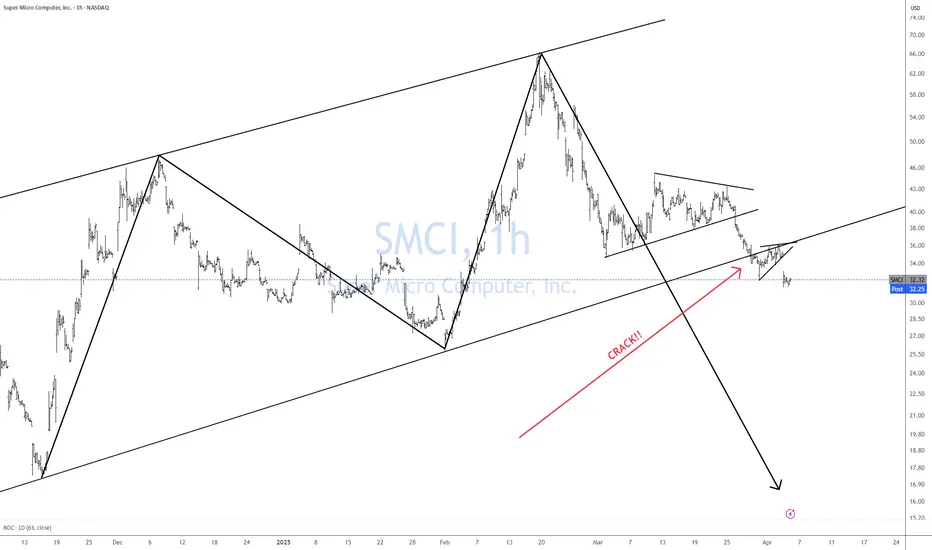
SMCI CRACK!!I called the absolute top in SMCI back on April 4th, 2024.
see chart below.
This year I am once again calling a CRACK!! lower. No, it is not seasonal it is just happenstance. ))
This is a very simple trade as most of my trades are.
Bulls take your money and GO!!
NVDA Rounding Topping Pattern!I started warning about NASDAQ:NVDA back on Nov. 4th, 2024, and we all saw a healthy -30% decline since then.
Updating that chart reveals a rounding topping pattern in place. Despite the 30% collapse, the pattern remains as bearish as ever.
CAUTION is in order!

MAG7 MODEL Rally is going to be in the form of ABC up The chart posted is the Mag 7 .I feel strong that the super cycle Top in the mag 7 was seen like January 2000 in the internet Bubble . I am counting a clean 5 waves down and see a strong ABC rally phase like that in 2000 then we dropped about 30% in the first leg down followed by a huge Bearish rally back up first leg up moved to the 50% retracement and then had a abc down for wave b of B to be followed up to .618 of the decline to form THE B Wave TOP . I am looking forward in my work and my models to see a near prefect rematch in the formation . I stated in my dec 8th forecast How the market will unfold based on the Wave structure and cycles and the DATA . We are now set for that abc rally . next turn date in spirals in 3/28 best of trades WAVETIMER

$SMH/$NAS100 is clearly in a bearish patternThe semiconductor sector was the poster child of the 2023 & 2024 bull market. The cap weighted index is a momentum play with heavy weights like NASDAQ:NVDA and NASDAQ:AVGO outperforming and hence the ETF gives more than 100% return in 2 years.
NASDAQ100 index is also cap weighted and momentum oriented. But the index provides diversification to a certain extent. NASDAQ:SMH hit an ATH in June 2024. In this chart we are plotting the ratio of NASDAQ:SMH vs $NAS100. The ratio peaked in June 2024. The ratio is making new lower lows and lower highs.
If we plot the inverse head and shoulder, we see that the ratio can probably hit the neckline which lies at 0.01. This will indicate a 10% more downside in NASDAQ:SMH compared to $NAS100. Currently NASDAQ:SMH is at 226 $. This will indicate a low of 200 $ and then it might indicate a bounce back from those levels.
Consolidation of NASDAQ:SMH around 220 $ - 200 $.

$AVGO almost down 30% Since the AI trade took hold of the S&P and NASDAQ the 2 stocks which we poster child in the AI trade were NASDAQ:NVDA and $AVGO. Out of the 100% of the real AI revenue done by Semis almost 15-20% is attributed to Broadcom $AVGO.
After the last quarter results the stock gapped up more than 20% and reached an ATH of 250 $ from the lows of 170 $. This week the stock almost touched 170 $. The Gap got filled as they usually do. So as usual in the technical patterns world the previous tops become support. The 200 Day SMA is at 178 $. I think between 170 $ and 180 $ is the accumulation zone for $AVGO. Tomorrow, being the earnings date of NASDAQ:AVGO we should watch out for volatility after the earnings. An implied move of +/- 10% in the price of NASDAQ:AVGO can happen after the earnings.
All in all, buy NASDAQ:AVGO between 170 $ - 180 $.

NVDA Earnings - Must Watch EarningsNVDA Earnings Wednesday after market
This is crazy that 1 stock may be the pain or gain for the markets in 2025
Glass Half Full
-NVDA is a revenue monster
-Earnings trend continues to point higher
-Demand for chips remains high (minus DeepSeek scare and uncertainty)
-19% weight on SMH
-7% weight on SPY
-8% weight on QQQ
-NVDA bullish can single handedly lift the markets and renew optimism and risk appetite
Glass Half Empty
-NVDA is overvalued
-NVDA hasn't hit all-time highs since Nov 2024 (with fakeout in Jan 2025)
-NVDA's reign is over and competition is heating up in the chips space and AI arms race
-NVDA bearish can be the wave of risk off that confirms current market concerns and fears
It's a big deal - plan and trade accordingly. Thanks for watching!!!

$INTC Nice Long Base – Ready to Breakout?NASDAQ:INTC oh how the mighty fall from grace. But so much for nostalgia. INTC has been basing since August 2024 for over 6 months. It looks like it has support around $19. It has tried to get moving a few times but no go.
Today it has tested both the longer term and shorter-term downtrend lines (DTL). It is testing today on the news that JD VANCE said AI will be built in the US. I have tried this name before and have been stopped out for a small loss. I have an alert set on the long term DTL. Should that trigger, I will want a convincing close above it. Looks to me, risk is well defined with a stop under $19. At current price that is about an 11% Stop Loss. Too much for me, so I would go to a lower timeframe to see if there is a better Risk Reward stop. All TBD.
I am only posting this because I like the longer base and thought you might want it on your watchlist as well.
This is my idea, if you like it, make it your own to fit “your” trading plan.

Opening (IRA): SMH February 21st 195/220/270/295 Iron Condor... for a 3.91 credit.
Comments: Back into the semiconductor ETF, where I don't have a position on currently. Going comparatively low delta, with the short options camped out at the 17 delta on both sides and the wings about 1/10th the price of the underlying in width.
Metrics:
Max Profit: 3.91
Buying Power Effect: 21.09
ROC at Max: 18.54%
50% Max: 1.96
ROC at 50% Max: 9.27%
Will generally look to take profit at 50% max, roll untested side in toward current price on side test.

$CRWD closing above 20 Day SMA $ and FIB Retracement levelsThe bellwether cybersecurity cos Crowdstrike had a very bad 2024 after the disastrous failed upgrade which caused major outages globally. Yesterday the stock closed at 408 $ which is at an ATH. Today in a week market it is still above the 20 Day SMA @ 362 $ and the 1.0 Fib retracement level @ 396 $. If these key support levels hold it is good idea to go long on $CRWD. In our Daily Dose of Chart : 07 Jan 2025 we spoke about a bullish Head and shoulders pattern. But this pattern is now invalidated. So, within the tech sector we are seeing intra sector rotation with NASDAQ:NVDA @ its 200 Day SMA support and NASDAQ:CRWD @ ATH. I think this weakness in Semis vs Cybersecurity will continue for some time. Please check out my post on 27th Jan for NASDAQ:NVDA trade idea.

NVDA closes below 200 Day SMANASDAQ:NVDA had a very bad day today with more than 550 billion $ Market Cap destroyed. This is one of the worst days for NVDA since March 2020. The 200 Da SMA price was 122 $. NVDA closed @ 118 $. This makes it a daily close below the 200 Day SMA. There might be some more downside and sideways movement before it starts a bullish upward trend before its earnings release on Feb 26. 6-12 Months down the line this might be one of the best buying opportunities. Long NVDA 110 $ - 120 $.


NVDA vs SMH @ 100 Day SMAToday we are plotting the ratio chart of NVDA vs the semiconductor ETF SMH on a weekly basis. NVDY/SMH i3 at 100 Day SMA because as the rally in NDY has stalled out while other Semi stocks are having a bull run form the recent lows. The semi cap equipment companies had a bad year last year. So within semis people re going for low Market Cap stocks and the recent underperformers.
But in the last 5 years, the ratio chart always bounced back from its 100- and 200-Day SMA. Sq this might be an accumulating zone for NVDA believers.

SMH @ 200 Day SMAAs we have always said Semis are the new transports. SMH hit the 200 Day SMA on the daily chart. It has been forming a symmetrical wedge pattern. It has an equal opportunity to break out towards upside or downside. The RSI has been oscillating between 60 and 40 since Nov 2024. Watchout the SMH chart to confirm if stock market bull market is intact.

Opening (IRA): SMH February 21st 200/225/270/295 Iron Condor... for a 5.44 credit.
Comments: At 42 DTE, selling premium in the semiconductor exchange-traded fund here with a neutral assumption ... . Using wings that are 1/10th of the price of the underlying in width.
Metrics:
Max Profit: 5.44
Buying Power Effect: 19.56
ROC at Max: 27.8%
50% Max: 2.67
ROC at 50% Max: 13.9%
Will generally look to take profit at 50% max; roll in untested side on side test.

SMH - What if this Medianline-Set holds evidence?The upward momentum changed when price closed and opened below the white L-MLH.
The rules say, that when price is leaving the Fork, open and close outside, we can expect a test/retest at the L-MLH.
This is exactly what happened.
Shorts got squeezed by a GAPer of the Market Makers move. And I admit, I could imagine a further rise for a third test at the L-MLH.
However, SMH is being observed very closely from now on.

Daily dose of Chart :Intrasector rotation with Tech. SMH vs HACKEven if the XLK (Tech sector ETF) hitting all time highs. But within the sector we see major rotation from Semis to Software to Cyber security. Last 6 months the Semis underperformed the Cybersecurity sector. But this has flipped recently on the daily basis. There is a bullish head and shoulders pattern forming on the SMH / HACK.

$NVTS - A Free 140% anyone?NASDAQ:NVTS
A free H5 Trade that ran 70% on the breakout and again after the pullback to retest said breakout!
That's 140% in gains in ONE MONTH!!!! 😘
We call that a DOUBLE TROUBLE Target Smash!!!
$4.65 🎯🎯🏹🏹
Not financial advice

CHIP SECTOR TO CRASH SMH The chart posted is the SMH we are now in the final 5th wave and it is a classic 5th wave Diagonal in the 5th wave wave to form a double top into fib cycle peak .From here we should see a major break down in All chip stocks into Oct 2025 but we should see the first leg down low march 10/20th 2025 this should be a Very Bearish action world wide see spy and qqq as well . This is the warning to All traders EXIT INTO RALLIES THE BEST OF TRADES WAVETIMER

SMH / IGV : Semis vs Software on a monthly basisSeems price have memory. This 22 years chart of SMH vs IGV shows failed breakout of Semis vs IGV on a monthly basis plotted over 22 years. Will it breakout this time around after a 22 years base building ? Can NVDIA and AVGO help ?

SMH vs SPYCan S&P 500 have a bullish run with semis not participating in it ? Bullish head and shoulders on SMH vs SPY. Semis are the new Transports.

SPY vs SMHCan markets rally without Semis participating in the rally ? It is clearly forming a bullish wedge on the daily. #SEMI are the new Transports.
