Spyshort
SPX GANN Scenariosyou may heard about the hyper inflation, end of the Super elliot cycle structure that comes to end, 2022 crash, news....
well basically this analyze focus on bearish Scenario, if price exceeded the gann will invalidated.
gann is easy if we know how to use it, its easy because we dont need to do anything, magical numbers do it for us.

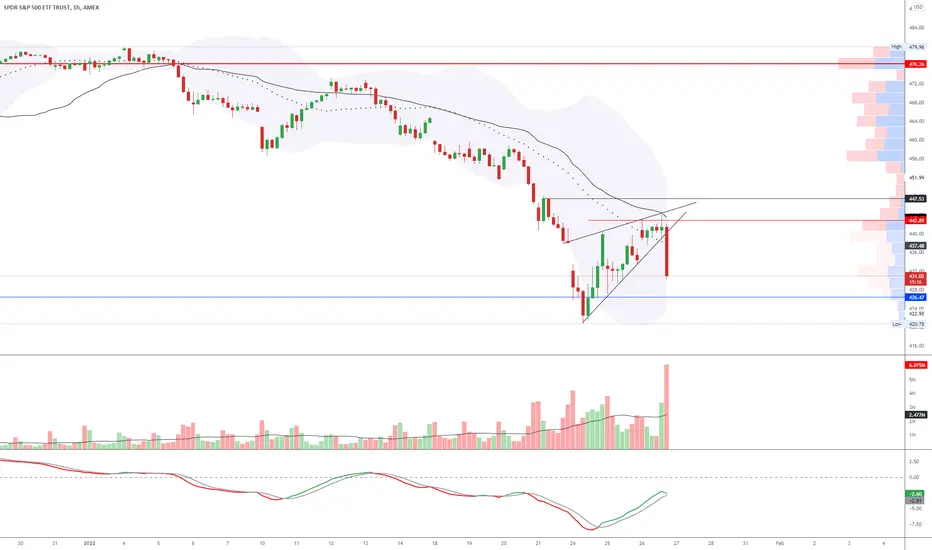
$SPY last rally of the year?$SPY continuing its last rally of the year. but starts to show its weakness in smaller time frame chart. the weakness can be visibly shows in smaller time frames showing the momentum
of SPY start to curl down and volume of buyers starts to slowdown. respectably, although the it start to show some weaknesses doesn't mean its going to pull back. the stock is still
above the ema line. once we crossed that line in 1hr and 4hr time frame. that's probably our signals for the possible pull back. as of what happened yesterday SPY is just consolidating.
day trade and scalp play target.
buy call above 478.65-479 sell at 480+
buy puts below 475.68 sell at 474.50 or below
Hello everyone,
welcome to this free technical analysis . ( mostly momentum play )
I am going to explain where I think this stock is going to go over the next day or week play and where I would look for trading opportunities
for day trades or scalp play.
If you have any questions or suggestions which stock I should analyze, please leave a comment below.
If you enjoyed this analysis, I would definitely appreciate it, if you smash that LIKE button and maybe consider following my channel.
Thank you for stopping by and stay tune for more.
My technical analysis is not to be regarded as investment advice. but for general informational proposes only.

SPY reversal areaLooking for SPY to pull back to the potential reversal area. Several big S&P stocks looking to pull back to the trendline.

SPX500 short Things are not looking very good for risk assets after the break below 200 MA.
FED interest rate increase is a headwind for stocks generally and growth stocks in particular.
It seems to us that things are going to get worse over the coming days.
Stay away from the growth stocks and darlings of low interest rate environment.
Most important -> manage your risk.

Possible SPY Outcomes - Jan/Feb 2022To create these prices and their respective labels, the following indicators were used:
Volume Price Profile
Fibonacci Retracement
Consolidation Channels
Potential MACD lengths
Outcome #1 in RED, Outcome #2 in YELLOW
Overall, I have the sentiment that it will continue lower, at some point. There are an infinite number of factors that could affect when, and how fast it does fall (-10% next week, -30% over next two months etc.) This is just to help map my personal game plan.
#1: Bull Market Reversal Price: This is the price I have decided that I personally will use as an indicator that a correction is over, and there should not be any huge crash in the near future (excluding news, events). Approaching this point, I would chart something that is more bullish to prepare for that.
#2: Support Ranges: Of course as SPY dumps (if it does) it will not be a linear path. There will be locations in every price where there is some support met. The ranges marked are locations where the support may be its strongest, and likely good areas to exit short positions.
#3: Gap to Fill: There was a 7% increase in 2.5 weeks in this area, with 2% of this happening over the weekend. Other traders/ investors could expect this gap to be filled before any major consolidation or reversal. Just something to keep in mind.
#4: The red line is where most volume by price is since Nov. 2020. If it goes this low, I'd expect some good support in this area because of it, and the simple fact that it is 400 (a big psychological support.)
Some other possible outcomes are: consolidation from SPY Support #1 and Spy Resistance #1 for as long as needed, tech earnings are crazy good and the market goes full blown bullish, or very long term consolidation in a much larger range until their is confidence in the market again or it loses steam.

Short View ES1Short view to $4274.57 with the freewill to this support. If it holds it should rebound. It is already touching the 200 day EMA with the MACD in a free fall. RSI is aligned with oversold. I'm looking for a solid bounce or stability level around $4274.57 as a prior support level. Let's see where it goes.

The U.S Bubble Pop Of 2022 - And Japan? TLDR: The market is about to likely crash, in a much needed and healthy correction of capital placement in various industries and businesses. Why? Look no further than the Japanese Stock Crash of 1989, and see its similarities.
In 1988, Japan was on the verge of becoming one of the worlds greatest economic super powers. Its monetary policy had allowed for historically low interest rates and investors had created a housing bubble caused by liquidity. Japan's economy was a prosperous tank, and nothing seemed to be slowing it down any time soon (despite cries from numerous, increasingly impatient market gurus that the opposite was true.) Companies grew, exponentially, without the innovation or competition to match such growth. Inflation was at an all time high, and the housing market was completely inaccessible to young people (sound familiar?) In fact, the economy was so well, that Japans index, Nikkei, saw gains of ~ 30% year after year -- 5 years in a row (A total of 900% in the previous 15 years!) At this point in history, Japan was the leading manufacturer for new innovations in the tech world (Walkman, VHS, CD's, DVD's, INSTANT NOODLES, all from Japan). This boom in emerging new tech was clearly reflected in the markets. In fact, at its peak in 1989, Sony casted one of the largest acquisitions ever! The company paid $3.4 Billion for Colombia Pictures, despite have little earnings. This was move was out fear and speculation, as Sony wanted an edge on its competitors in the film tech world (Comparable to the historic Microsoft/ Activision acquisition perhaps?)
History shows that inflation is great for equities, until the government is cornered and has to take it seriously!
That is exactly what happened. This story was short lived, as it all came crashing down in 1989 and 1990. In 1989, Japan had elections and switched its form of power. A new political and economic policy entered, and when this new administration began tightening its policy to a more conservative standard (to fight ever rising inflation), the markets felt it. In just two short years, Japans speculative Nikkei market came crashing down 60% (it still hasn't fully recovered at 40% from its all time high, 30 years later.) Investment firms and corporations who used their capital to speculate in investments (which the public assumed would not lose their value) were forced to exit their equity exposure and risk at much lower prices.
Simply put, shareholders and venture capitalists had too much faith in these emerging markets and newer systems. Who could blame them? The past several years, the market was outperforming any investment in recent times. However, they were so comfortable and prideful, they had forgotten the risk of high rising equities and investments (this risk was compounded by greed, causing excessive and easy margin borrowing. We'll get more into this later, in another post.)
So, what is the lesson and how can we learn from this to prepare?
Just ask the Japanese. In 1998, Japanese technology was booming so much, it caused a surge of euphoria that investors did not want to miss out on. This euphoria compounds until it can no longer be maintained, confidence dwindles, and the market is hit. They've learned the lesson that in times of high deviation from the mean, it's important to exercise a healthy level of caution. This can be done by investing in real cash-flowing investments that have stood the test of time (commodities, land, gold, to name a few) and by sitting on a nice stash of cash (although, be careful, INFLATION!) This way, you can deploy your cash when the market is at a discount and become a gazillionaire. (I'll touch base on other ways you can make outstanding profit in a potentially bearish economy, in another post.)
As always, this is just a historical example. History never repeats itself, but it often rhymes like a rapper. The conditions we are in today are different in many ways, but by finding the similarities and drawing parallels, maybe we can prevent ourselves from being turkeys. (More on turkeys in a future post)

SPY, QQQ selling toward closeI'd expect to see selling toward the close. So, be careful getting long now.

Long or short? What is coming soon?An important situation is now taking shape. The last candle as a redemption, a bullish hammer, but in any case it will be clearer how we will close on the weekly timeframe and what will happen on Monday.
On the RSI, circled where it went beyond the lower channel boundary, statistically the instrument went up. Now we have a similar situation, a bullish signal
On the MACD there will be a crossover in the near future, if the movement continues.
Then the most important thing is to break through the resistance levels. 1,2 - more serious, from it the reversal can be down again. and 3 to update the maximum.
Now there should be a break in the trend, further up. The level is strong. 200 EMA should also help. Crossing the line and the horizontal level is a very powerful defense.
If this scenario breaks down - go lower to 315 almost. Fundamental factors from the Fed could contribute to this.
❤️ If you find this helpful and want more FREE forecasts in TradingView
. . . . . Please show your support back,
. . . . . . . . Hit the 👍 LIKE button,
. . . . . . . . . . . Drop some feedback below in the comment!
❤️ Your Support is very much 🙏 appreciated!❤️
💎 Want us to help you become a better Stock trader?
Now, It's your turn!
Be sure to leave a comment let us know how do you see this opportunity and forecast.

What are condoms for?'Protection!!! PUTS, PUTS, PUTS!!!
It looks like the SPY could form an inside candle with an upper wick retest of former trend line area (see circle), also on QQQ. And that's if we don't go any lower today; but seriously doubt we go higher. You can thank PTON for crushing the market as the news they released was super bearish; shutting down production of there bike and treadmill. As it basically means, 'anybody that wanted to buy stuff over the past couple of years, has' money from stimulus funds, investment gains, etc. They are just the first to say this, and wont be the last.

IXIC NASDAQ SHORTJust simple analysis combined with the meeting on Wednesday, its looking for support lets see where we land.

SPY back into range where the VIX had previously spikedIt's interesting that the VIX hasn't really increased all that much but the SPY is back into a zone he VIX had spiked before. Could be last change to buy puts before a much bigger flush lower!!

Into the Gap Zone - Possible Outside Month? Hit our target zone today as spy continued to drop. Nice bounce from here but not much follow through. We have retraced back through 50% of last month's candle. This usually means we can print an outside month. This Puts SPY target at $448.92.

SPY closes below critical bull market trendlineSPY closed below an important trendline on the daily chart. This trendline has been supporting the bull run since March 2020.
This could of course be a fake out, but given the macro headwinds, I believe that this could be the first sign of a *potentially* major breakdown.

SPY: Bouncing between the 50 + 100D EMASPY bouncing between the 50D above and the 100D below. Will most likely stay that way this week. Safer players will wait until $460 or $64.72 trades to make a decision on what to play. Playing in the middle won't net much gain for SPY players.
If you play SPX or ES_F you can play the middle IMO.

S&P Short Position - House Of CardsThe S&P is at overextended levels, and will be unable to sustain these prices. Looking for a considerable multi month correction.

SPY going to at least 459-460 againOnce again, SPY got rejected at the critical resistance and is going down. Every time it rejected this level previously, it went down at least -0.9% and at most -4.5%. I am expecting it to go down to either 460 or even 456-458 in the next two days. Tomorrow, it might close around 460 and then it might gap down on Tuesday and then we see the recovery either that day or the next due to the earnings.
For those interested in patterns, I see a bearish BATMAN pattern (the last rejection of the resistance was retest of the right ear.
This idea gets invalidated if SPY breaks above and holds 472.

It looks like a D*ck and i might get fked...took a short position at the beginning of the week thinking that it all the news would be potentially bearish. but then the pattern did this. and silly me didnt get out until it was too late i really hope this doesn't go structure to structure. any thoughts would help. Apple also moves like the spy so. I'm scared nothing can stop spy or apple

IWM SHORTShort AMEX:IWM
Very likely we see a crash this week to the 200 level.
I am playing off of the current market conditions and rising ECONOMICS:US10Y yield, etc..

Critical levels for spyKeeping an eye to see if we bounce at the top of the red channel and retest the bottom of it, or if we we break the trend and test the next resistance levels. You can see in the green channel, bigger picture we filled the gap to the downside so I’m looking for confirmation on continuation but there is a lot of bearish divergence I’m seeing with this one. I am newb tho

SPY looks bearish If price does not hold the box then as per my analysis and calculations and on Monday if I do see my favorite candles burning then $458 coming for sure.
Not bullish as if price even holds and goes up we have magnetic resistances at $470 & $472.
BEARISH

"You cannot T.A. the VIX"Hi folks!
There is a saying that you cannot T.A. the VIX - as it is not directly tradeable and is derived from a complex computation based on short term options premiums of the S&P500.
However, the VIX also is an estimate of the expected short term volatility in the market (i.e. in the next 30 days), and by definition should be significantly correlated with realised volatility.
Thus, there are some measures you can take to try predicting market moves:
The Bollinger bands explicitly aims to model the short term realised volatility and the fact that periods of VERY low volatility often preceded periods of high volatility.
In my opinion, it makes perfect sense to analyse the VIX in terms of Bollinger Bands - on the 4h, which I usually use to trade both the VIX and the SPY in general.
I want to test a hypothesis that a very tight BB gap often leads to relatively large VIX spikes.
I also tried to combine it with the MACD indicator to see if we could find an even stronger buy signal, and here are my result based on my extremely brief study:
- A very tight BB gap "always" leads to a relatively large VIX spike.
- If you find a divergence in the MACD at the same time, the signal is even stronger (although the tight BB in itself seems to be the most important signal).
I did only include a chart since the covid-correction until now, as the findings are hard to vizualise over longer time frames.
In my humble opinion, it is absolutely time to buy the VIX now (although it may continue further down, it does not make a huge difference unless you have a tight SL/very short duration of your contracts).
DYOR.
NFA.
I wish you all well :)

