Upside vs Downside
You can see what the Nasdaq has been doing for the past few days - nothing.
There is serious overhead resistance. Unless it breaks through the easiest path is a 61% retracement and fill the gaps below and try again.
Again if the trendline get broken all bets are off.
Nasdaq is better at filling gasps better the SPX.
SQQQ

Where BTC goes, NDX followsVery basic line chart to illustrate that BTC is a leading indicator of where the NASDAQ will go. They aren't always in lockstep, but the correlation is apparent.


Bulls MIALooks at how many times we've flipped at that yellow zone.
Past price action tells us a reaction is likely there.
Looks like we're hitting a wall.
If we can break through this zone, we'll push to new highs.
BUT,
The upward price action looks corrective to me.
C wave extended 1.382 of the A wave.
Bearish Bias remains.
Buying the SQQQ. Stop loss if the NDX breaks above 13,850 or so.

Precision EngineeringSee that? Look at this with BTC overlaid.
The whole market is going down.
Freaking nailed it.
Added to my short position.

NASDAQ, Statistic, and Fibonacci...Institutional investors call themselves "Smart Money" because they have access to more data and analyze it better than us at any moment.
If you check Fibonacci time zones on NASDAQ, you will be shocked:
1- weekly chart: post-pandemic Bull market last 55 weeks. (55 is the 10th number in the Fibonacci sequence)
2- In the hourly chart, it follows the time zone and retracement levels:
The important question here is to find the next probable reversal zone:
Model A:
Model B:
Now let's review the past and see what was the most common pattern in NASDAQ weekly chart in the past 60 weeks using some statistics:
Weekly chart:
1- Between March 2020 and April 2021 (55 wks) we had 31 green and 24 red candles! Net outcome:+107% (average +1.95% weekly)
Even in the longest bullish market, 43% of weekly candles were Red!
2- The Most common pattern: 1 Geen candle followed by 1 Red. repeated 9 times!
3-For the first time in the past 60 weeks CURRENCYCOM:US100 closed in rd for 4 consecutive weeks! and this has happened after that 55 weeks!
4-During the longest Bullish market ever, we see a 5 consecutive green candle only once, 4 consecutive green twice, 3 consecutive green once, and 2 consecutive green 3 times!
How we could use this information?
Let's assume you bought TQQQ every week. Your chance of closing your trade and making profits could be 70%! This is way above the 51% success rate of the Medallion fund of Reinacence Technologies which is the most successful fund of all time.
How we should use all this information:
Scenario A: You believe we are in a Bullish market: Buy TQQQ every Friday. (This could be good after 4 consecutive weekly red candles, but not recommended)
Scenario B: You believe we are in the Bearish market: Buy SQQQ every Friday. ( IMO: This could be a better choice in a longer time frame)

SQQQ potential part 1 SQQQ is the inverse of TQQQ and follows NASDAQ 100 which are 3x leveraged ETFs.
This chart is on the Weekly timeframe... it basically shows the overextended market. I will be watching this for mean reversion toward the kijun.

SQQQ Cup and HandleLooks pretty legit so far.
Probably a few more days of chop before it will confirm or deny its existence.

SQQQ did jump one week after I predicted itSQQQ did jump one week after I predicted it
Its been a long time coming but it looks like we are going back to $13-$14 before we head lower.

Moonphases backtested QQQ NQ NASMoon phases begin 3 days after, marked by vertical lines. If the trend started the same day I gave it credit. If you could've lost considerably holding till the next moon, I put it in yellow, but still gave credit for initial trend.
Full moon (bot) was correct 9/9 1 ylw
New Moon (top) was correct 7/9 2 ylw
So it seems you can trust moon phases more than most indicators! Overall 88% accurate, with Fulls near 100%, and News @ 77% accurate.


QQQ slide SQQQ rise We are what looks like a perfect setup for an SQQQ rise which would mean a QQQ decline.
Currently it's been trading in a descending wedge and about to cross over on the daily MACD.
This is followed by low RSI and and some near term gaps that need to filled.
I think the question is how far does the NASDAQ have to decline again for these gaps to be filled?
Could have another small decline tomorrow or we could start a reversal next week... who really knows
Looks like a nice set up to possibly take advantage once there is a clear breakout.
That's all folks.


$NIO - STIL BEARISH, Rejected at top of channel $26 Price TargetMountain Top Formation, Rejection of Falling Channel, Could not pull through 0.618 Fib Retrace, Major Head and Shoulder

$PLTR - Palantir Heading Lower, BEARISH immediate and short termRejected Falling Channel for 3rth Time. Falling Channel intact.

$TSLA - TELSA Stock Pennant Setting Up - Bearish immediate termCan go either direction soon after consolidating in the pennant

HUT8 could drop lower before rising upHUT8 could drop lower before rising up
EBON tossed some water on the crypto mining stock fire today but HUT8 will be back.
Maybe this will be the moment we drop down to fill the game down in the $5.50-6.20 range. That would return some amazing gains.
With SQQQ set to jump the whole market might tank a bit on the fear of the curve...

It is an undeniable reality! Complacency phase!While newbies were hoping for markets recovery, those who have plans made themselves ready to benefited from BEAR market.
If you look at the SQQQ weekly chart you will soon notice the reversal in trend and huge increase in trading volume, almost 10 times in comparison to 6 months ago. No need to say we see huge decrees in trading volume of stocks, and EV makers as front runners of the market since February 16.
Please read my analysis on February 17, 2021, and see that I mentioned correction seems inevitable..!
That day NIO holds price tag of 56, and Tesla was 794.
I started writing bearish views from mid February 2021, and asked my followers to cut their exposure every week and use tight stop loss, 3 weeks ago I asked them to sit on their cash and just watch, no regrets so far! I started shorting the hyped and overhyped stocks and asked my followers to do that! There is a comment below my WKHS short analysis that one follower thanked me for 2000% gain shorting workhorse..! Two weeks before that people trashed me because of bearish views on workhorse. They forgot the I was putting my target on 40-42 when WKHS was 20-22. Past is Passed, let’s talk about current situation.
We are at the beginning of a new era, yet most traders/investors are in the Complacency phase. They tell each other we should cool of and wait for the next bullish rally. Most of them think 1.9 trillion stimulus package will be their savior.
Now let’s look at the reality, what happened in the market from March 2020 to mid February 2021 was the absolute definition of Melt up phenomenon.
What Is a Melt-Up?
A melt-up is a sustained and often unexpected improvement in the investment performance of an asset or asset class, driven partly by a stampede of investors who don't want to miss out on its rise, rather than by fundamental improvements in the economy. Gains that a melt-up creates are considered to be unreliable indications of the direction the market is ultimately headed. Melt ups often precede meltdowns.(investopedia)
The definition of meltdown will show up soon..!
Moshkelgosha

Possible Recovery Ahead! $SQQQ AnalysisThere might be a sign of hope in the near future!
$SQQQ has rallied hard today, showing true weakness in the overall tech market. Although this rally crushed a ton of growth equities, there are a few critical things to note here.
$SQQQ is showing signs of a bearish formation on the 1-month (triple top chart pattern), and various catalysts regarding vaccine rollout success and employment levels rising can start to show signs of true economic recovery, not just within the stock market.
Time will tell in regards to what happens in the short term, but I personally see another rally once more people receive their vaccines and we return back to the workforce as usual.
GLTA!

Bulls and BearsI recently closed out my SQQQ position. I walked away with a 12% gain in three days. Could it have been more, of course. The market started to bounce and I was giving back my gains, then I remembered...
Pigs get Slaughtered
As you can see the Nasdaq is coming into it's trend line support, I am going to sleep on this one and trade it. We could be setting up one heck of a squeeze or we could be walking off a cliff to the 12,000 area.

First time SQQQ above linear regression channel since Nov 10thJust an interesting observation. SQQQ has been in a very tight linear regression channel sine November. Today was the first time that it made a clear close above this channel. Could just be a good opportunity to buy NDX or it could be a more bearish sign for the NDX.

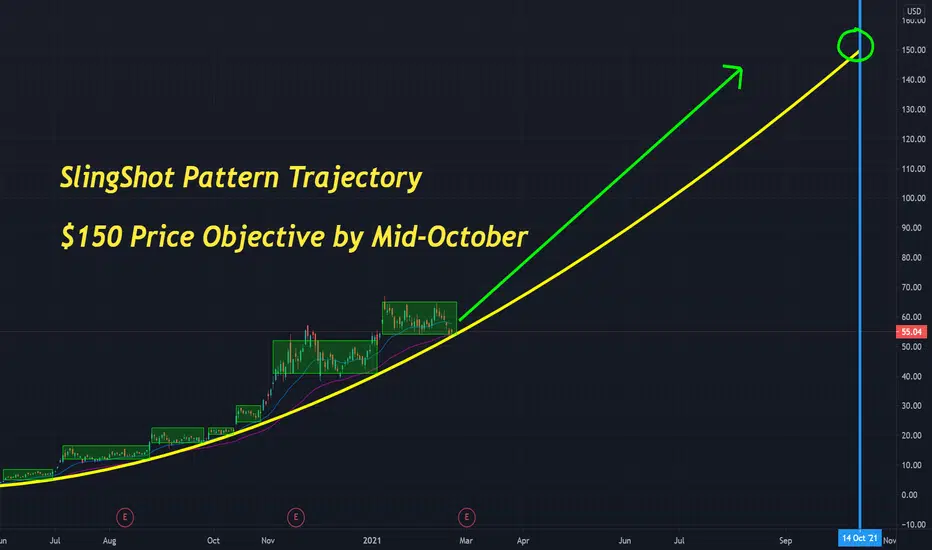
$NIO - $150 Target with SLINGSHOT trajectory Price Objective of $150 by Mid-October with SlingShot Trajectory
$TSLA - $2,100 Target with SLINGSHOT trajectoryLooking at by September, my target is upwards of $2,000
