Narrow Range for Stocks. Breakdown??Stocks are still maintaining a very narrow range at the apex of our Gartley pattern. The fact that they are not inclined to break to the upside suggests that we could be in for that selloff we've been anticipating. Watch the news and momentum in the morning. If there is not much hype backing stocks this morning, and we don't see momentum come through at open today could be the day we see our retracement. If so, watch 4188, or 4144 for support. The Kovach OBV is stagnant, and we have strong resistance from 4224 and 4245.
Stonks

Stocks Stagnant... Dump Coming??Stocks seem unable to break past 4228, the level they attained based on NFP numbers Friday. If the S&P is unable to budge from this resistance level, it most assuredly will dump, and perhaps our Gartley pattern was correct after all. We are starting to see a bit of a dip back to 4214, and if this does not hold we will see support from 4188. Stocks do appear to be a bit overweight right now, and due for a correction, which could easily take us back to our target price of 4147, based on the CD segment of the cypher. The Kovach OBV is pretty stagnant so this could easily come to fruition soon.

Bullish Setup on TLRY, we are ready to get high.Today we have a bullish setup on TLRY to share with you. We will be taking this setup using 1% of our capital, and we aim to make 4% on this setup. Of course, we can have a bad trip on this one... However, the risk-reward ratio is a key aspect of our strategy. Generally speaking, we have a win rate of 50% and an average risk-reward ratio of 2 (all you need to make money in the long term)
Let's start with the view:
-The price has been trending lower since February 2021. Now we are observing a possible change in trend, and we want to take advantage of this probable situation.
-As you can see on the chart from May, we have been observing a sequence of higher highs, and higher lows + the price broke a key resistance zone (currently, we are observing a retest of that)
-Based on all the previous items, we have defined but stop orders on the breakout of the current correction and stop orders below the structure. The target we will be aiming at is 29.5 with a protective level at 24.00 (there we will move our stop loss to break-even)
If the price doesn't execute our setup and keeps going lower, we will cancel the setup. And if the price reaches our entry-level and our stop loss is executed. That's trading; we will face a -1% loss.
Thanks for reading!

Stocks Wavering, Looking WeakStocks are forming a bear flag with a POC right at our 4188 level, which is a technical level and a Fibonacci level. We have adjusted our stop loss just above 4228, but the more conservative could adjust it to break even, or a few ticks in profit. We have one more level from below, 4165, before our target of 4147. If we are wrong and we get a burst of momentum, then 4214 will be the first level to provide resistance. The Kovach OBV is still pretty flat, suggesting life has not returned to stocks and we need more enticing prices.

Stocks Jump on NFP Numbers. What's Next??The NFP numbers Friday destroyed our short trade based on the otherwise reliable Gartley pattern. We have hit highs again at 4228, and if momentum continues we will seek 4245. Watch for momentum at open because we are at some serious levels of resistance which will take some momentum to punch through. If we do not see this momentum, we can strongly consider a short trade back down to 4188. If we see some bear momentum, our Gartley pattern has a target of 4144 or so. The Kovach OBV has jumped from the NFP momentum, but has since leveled off.

AMC, GME, and BB off to the RacesSimple little chart to track the top 3 WSB stocks. Curious to see how these perform through the year.

GME longI believe that GME will have a positive week ahead. I can say the technical aspect of this stock gives me a better perspective that it will turn to have an ideal trade with the help of a good volume.

NAKD huge bottom formation, iHnS Potential to $4Let's see if this potential plays out
1) we track to see if the Right Shoulder completes target to ~$4.60
2) lots of resistance at neckline, if price breaks neckline it will confirm the pattern and should give us a second target of 7.60 or so
From an elliot wave perspective wave 1 and wave 2 have completed and we should be on our way to wave 3 with higher highs to be made.

Stocks WaveringStocks have rejected 4228, which could be the first phase of the breakdown from our Gartley cypher pattern. A typical target for these cypher patterns is half of the height of the final segment of the pattern (CD). This puts us at 4144, which is not only a Fibonacci level but a technical level making it that much more auspicious. If we are wrong, we still have one level before highs, and it is doubtful stocks have the strength right now for it. The Kovach OBV appears to be turning over, suggesting, if anything, that will at least range. The level 4188 will provide support for now, also a technical level and a Fibonacci level.


The breakout has not happened yet on MELI. This is our plan.Let's take a look at MELI. We can see two relevant aspects on the chart.
a) The price has broken an ascending trendline that has been working since MAY 2020
b) The price has been correcting for the last 4 months almost, and the main structure we can observe is a descending Wedge.
Based on those two items on the daily chart, this is our trading plan.
-We can see a clear resistance zone at 1600 - 1650 that has been tested 3 times. Therefore we don't want to take any setup below that level. So, we will wait for the price to reach it first. IF that happens and we see a move above that level, we want to observe a clear corrective pattern. Here we have defined an ABC structure (what we are looking for is something with similar proportions as the previous corrective structure that happened at the same level we are waiting for this one.
-If all the scenarios are aligned, we plan to take a setup, as you can see on the chart. The two levels above the resistance are the broken ascending trendline (working as a dynamic resistance) and the previous ATH. We think that a setup like this one can provide us with a 1.7 risk-reward ratio and a resolution between 10 to 20 days.
Quick Questions
And what if this never happens? - We don't trade, darling
Ok, smart guy, and what if you wait for all this and suddenly you have a stop loss? - We just take it with 1% of our account with a smile on our faces. Stop losses are a fixed cost of trading; start dealing with that instead of avoiding it.
Why don't you buy it right now? - Because Momentum trading / Swing trading is about waiting for confirmations and creating scenarios with a good risk-reward ratio (which means defining stop levels) so after 40 setups, you can have an edge (or a statistical advantage)
Thanks for reading, guys! all your questions and ideas are more than welcome in the comment box! Have a great week.

Bearish Gartley Cypher Pattern in Stocks!!Stocks are staying close to highs at 4224, bounded below by 4188. We have seen a great consolidation of volatility and largely ranging behavior for the majority of last week. The Kovach OBV has been completely flat, suggesting that there is not enough momentum to break highs or even test them. Adding inflation fears might contribute to a bearish outlook for stocks. Additionally, we have a bearish Gartley cypher pattern forming, with the completion (D segment) right around current levels. If this is the case, the S&P could easily break to 4144.

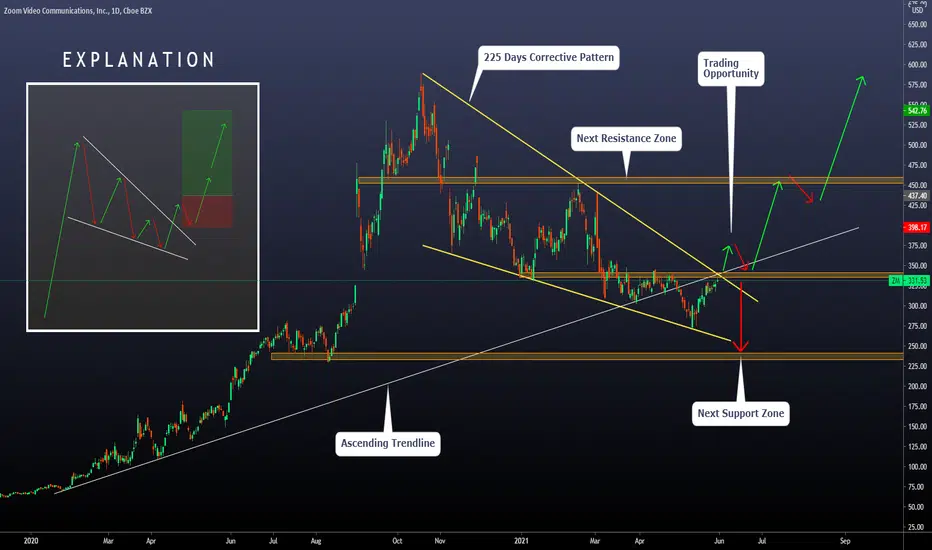
On Zoom, the Corrective Pattern is absolutely finished We have been watching closely zoom for the last weeks looking for the breakout of the massive corrective pattern we are observing right now. After 225 days, the price has tested both sides of the structure, mainly the lower zone. Based on that, we are getting ready for the breakout.
Generally speaking, it is not a good idea to trade a direct breakout of these massive structures. The main reason is that fake-outs are common, and if you are a breakout trader, one of your objectives is to avoid low-quality scenarios as much as you can. For that reason, we have defined a bullish scenario we will be waiting for.
Bullish Scenario: If we observe a breakout of the corrective pattern, we will be waiting for a retest of the broken structure or the resistance level. The formation we want to see must be formed at least for 5 daily candlesticks. Finally, we will trade, as you can see on the EXPLANATION chart. From there, we can aim at two targets, first the next resistance zone and second the previous ATH zone.
Expected Time: If everything goes as expected, we may see a 20 days movement towards the first resistance zone and 50 days towards the new ATH (take these two numbers as approximations)
Bearish Scenario: If the price cannot break the corrective pattern and the resistance zone, we may see a bearish movement towards the next support zone, around 250 - 240. We are not interested in developing any short setups here.
Thanks for reading; feel free to share your view or trading plan in the comments!
$GME GAMESTOP ELLIOTT WAVE ANALYSISJUST MY INTERPRETATION> NOT FINANCIAL ADVICE, I have a target at 566 which should be possible by the end of year in my opinion . What we saw this week is the possible first wave of the 5 wave for gme.


AbbVie Bearish Butterfly AbbVie has been on my radar now for quite a bit. It’s one of the few Pharm. companies Warren Buffet holds and even know I’m not strong in the realm of Pharm. I have seen their marketing on TV increase quite a bit. Since I am away from my computer at the moment and posting from the TradingView App. I do not know their financials right off hand. I will update this idea with that information later. However, here we have a bearish butterfly. The pattern panned out super nicely. Once the pattern completed it made a little bit of a consolidation and dropped yesterday heavily. I will be looking at buying some AbbVie once it hits the 618 of the pattern structure… if the movement looks weak (not likely based off the strong sell off with high volume) I think the 618 is likely. All the other numbers that made up the PRZ were over projections of the traditional ABCD pattern (2.0) and a 1.618 over extension. So the massive sell off with high volume is not surprising… be looking out later today for the financial report this does not mean I am saying AbbVie is going to the ground but it is a nice little correction that we long term investors can take advantage.

Stocks Looking Weak...Stocks caught a lift from 4188, testing 4214, as we said they would in the last report. The S&P appears to be making a run for highs, however these rallies are very weak with respect to what is needed to break the resistance we will see as we approach highs at 4245. If we do not see this momentum, we will likely retrace back down to 4144 or 4122 unless 4188 provides support. The Kovach OBV is completely flat, so unless we can get a burst of momentum, we should see a continuation of the range at the very best.


AMC looking extremely bullish after a perfect breakoutAMC has finally broken 14.5 for real and seems pretty strong. The more times this resistance is being tested, the more likely it is that the breakout is real. We have seen strong re-accumulation based on the volume profile in the 14$ area which just turned into support. Below I have the charts which unfortunately are in a format from tradingview that have to be clicked and they don't show up immediately (no idea why).
The point here is that AMC has a significant short interest, there is a lot of hype and many diamond hands behind it... And is a company that benefits from the re-opening. This company almost went broke but now it is looking very healthy and the capitulation and the support from WSB has actually given the company a boost. Unlike GME the January squeeze was smaller and the second pump was a little cleaner and not as extreme as GME's. The current valuation of 6B in my opinion is OK, but the interest in the company from WSB + re-opening + relatively high short interest could make the price go above the old ATHs.
For now the first target is around 17$, the second target around 21 and then we could see the ATHs at 35t$ get broken. It definitely wouldn't be that hard to test them and then break them as the stock is already only 55% below its ATHs, which were also a double top. Double tops eventually get broken except if the company goes broke, especially if they get retested after a 94% which is a great way to wipe out weak hands.
For those in Crypto that follow me, you can go long/buy AMC on some platforms like FTX and Bittrex although they have commissions and they aren't as great as the typical brokers, but it is way to stay in crypto by buying tokenized stocks. On FTX and Bittrex you own the stock and can trade it 24/7, while there is also SimpleFX where you can deposit crypto and use it as collateral (so it is like 1Broker and has risks). There you trade CFDs with and you do it based on normal trading hours.
s3.tradingview.com
s3.tradingview.com

How is life going for the big 5? FB/AAPL/AMZN/GOOGL/MSFTToday, we will look at the 5 major companies from the S&P500, and we will check how everything is going for each of them.
Our first analysis starts on Facebook. After breaking an ascending channel that comes from 2014 and a huge corrective structure on the edge of it. We observed a clear breakout, and currently, the price is very close to making a new ATH. Using Fibo extensions of the biggest corrective pattern, we can create two targets. We are getting close to the first one, and we have a long trip towards the 2nd one.
APPL time. The price has been ranging since august 2020 without providing clear signals of the future direction of the price. By the moment, we can define a clear range, a broken descending channel, and a possible bearish corrective pattern (ABC). The real direction of the stock will be defined once the support or the resistance is clearly broken with a Weekly Candlestick.
MSFT time. We are inside a clear ascending channel with multiple corrective patterns that have been broken, making new Higher highs and new higher lows. Using Fibo Extensions on the Massive corrective pattern we can define two targets. The first one has already been reached. The other one is far away yet. However, we expect a bullish movement after the breakout of the last ABC corrective pattern.
AMZN time. As well as APPL, amazon has been ranging since September 2020. A few weeks ago, we had a breakout of the massive structure. However, we dint observed a new bullish movement. So, we are in the range again. This analysis was activated for us, and we have an invalidation level below the structure. IF our view is correct and a new bullish movement comes, we should see something proportional to the current correction, which means targets on the first and second fibo extension.
Finally GOOGL. The price has broken an ascending channel and currently is above. Here we have two scenarios either the price is extremely out of boundaries which means a re-entry to the broken channel. Or we are in the middle of a new acceleration. As we can see, we had several corrective patterns, and every breakout meant a new higher high and a new higher low. Following that logic, we draw two targets using fibo extensions on the last corrective pattern. We can see a final target at 2700. If the analysis does not go as expected, we can define an invalidation level below the structure.
Thanks for reading! We would love to see your daily view of these 5 big companies.

Stocks Ranging Before the BreakoutStocks have retraced a bit after encroaching upon the 4214 level. We still believe they are gearing up for another breakout and that 4068 is a bottom for now. We are likely to see either continued ranging here or a further retracement before the breakout. This is supported by a waning Kovach OBV. The levels 4188 and 4178 are providing good support. If these do not hold, then consider 4144 or 4122. The next major target is highs at 4245.

QQQ condition statementJust a condition statement in chart format for QQQ for the dip buying enthusiast.
Price is sitting at April support backtest as RES at 333.94!!
ATH to March low fib is below that price, at 332.59!!!
Trade strategy is to dollar cost average 20%/30%/50% into 331.74/329.84/326.76 areas, save the heaviest buy for 326.76.
Stoploss for the trade is the gap at 323, plan is to cut 50% of position and wait for 316 at the March low before deploying new capital.
This is a volatility reducing swing strategy using fibonacci levels from different time frames and pivots to define risk and cost average.
A break of 336.65= ATH test!

