Looks like a confirmed break, repetitious fractal to 82c?At this point anything is possible.
I would not be shocked if we see 1.2USD within the next 24 hours.
SNL is exactly 23 hours and 55 minutes away. One sleep till Christmas.
Stonks

Stocks Poised to Breakout!!Stocks have broken higher, toward the upper bound of their range at 4214. We see increasing proclivity toward these higher levels suggesting that we are gearing up for a breakout soon. The Kovach OBV however is pretty flat, and seems unfazed by the move, so watch for resistance at highs. We will have support at 4188, 4178, and 4172. Our next price target is 4228.

Best Stock Trading IdeasStocks held a very narrow range yesterday, after dipping significantly, traversing the vacuum zone to find support at 4122. They could be gearing up for another breakout, which may finally take us to our profit target of 4227. Currently we are sitting at almost the exact middle of the range, at the 0.618 Fibonacci level at 4161. Watch out for 4187, which may provide resistance. If we retrace further, we will see support from 4146, which is a Fibonacci and technical level, then 4122 again.

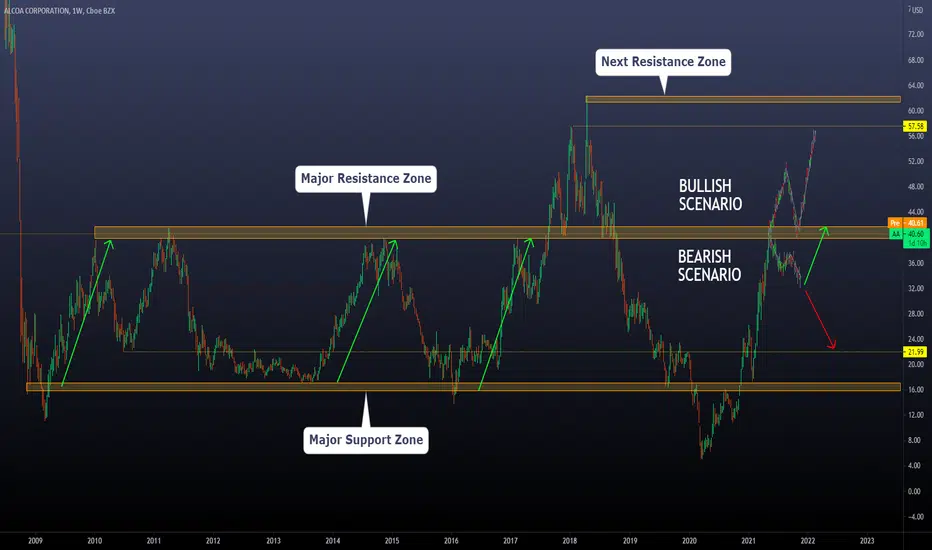
ALCOA has reached our Weekly Target. What's next?Today we will speak about ALCOA: In March, we posted the expected movement of the current trend (Link to related ideas). After 2 months, the price has already reached a major Resistance zone that has been working since 2010
Now we are asking the question. What's next?
To answer this, we will use the previous price information we have to develop possible paths for the price to take.
SCENARIO 1 (Bearish): The price is not able to make a clean break out of the resistance zone, and we have a Correction or the beginning of a new bear market. In this situation, we should expect a -20% movement between 100 and 150 days. IF the price cannot keep falling, we should be open to the idea that the correction was a break before the breakout of the resistance zone. Like the scenario, we saw between 2018 and 2018.
However, if the price keeps falling below the previous parameters, we may think that a new bearish trend will start with the first target at 22.20
SCENARIO 2 (Bullish): The price makes a clean breakout of the resistance zone reaching at least 45USD a share. IF that scenario happens, we will be waiting for a "Throwback," which is a retest of a broken level or structure, and the target for that movement will go from 57 to 61.
How to use this information): The main idea about creating possible paths is to start thinking about how you would trade certain assets IF the price reaches all your parameters. That allows you to do it calmly and professionally without being moved by your emotions. Patience is a great wealth creator.
Thanks for reading!
Time For Splunk To Bounce Up?Based on historical movement, the trough could occur anywhere in the larger red box. The final targets are in the green boxes. The pending top should occur within the larger green box as has been the historical case. Half of all movement has ended in the smaller green box. In this instance, the signal indicated BUY on May 4, 2021 with a closing price of 119.41.
If this instance is successful, that means the stock should rise to at least 120.045 which is the bottom of the larger green box. Three-quarters of all successful signals have the stock rise 3.1735% from the signal closing price. This percentage is the bottom of the smaller green box. Half of all successful signals have the stock rise 5.92% which is the end point of the black dotted arrow. One-quarter of all successful signals have the stock rise 8.0325% from the signal closing price which is the top of the smaller green box. The maximum rise on record would see a move to the top of the larger green box. These are the same concepts for the levels in the red boxes as well.
The ends/vertical sides of the boxes are determined in a similar fashion. The peak of the rise can occur as soon as the next trading bar after signal close, while the max rise occurs within the limit of study at 50 trading bars after the signal. A 0.4% rise must occur over the next 50 trading bars in order to be considered a success. Three-quarters of successful movement occur after at least 18.0 trading bars; half occur within 36.0 trading bars, and one-quarter require at least 46.0 trading bars.
The black dotted arrow represents median historical movement. Medians are a good metric, but they are just one of many I use when forecasting future movement.
As always, the stock could decline the very next bar after the signal without looking back (therefore the red boxes would not come into play) or the stock may never decline (and the green boxes may never come into play).
All movement could technically be over after the second bar from signal as the larger green box was breached and followed by a retreat. If this is not the case, it is interesting the close today occurred in line with the bottom of the smaller red box, meaning the drop could be over and a week or two of gains may start as early as the open tomorrow.
All statistics and the full analysis are available for free as always at the site below.


Stocks Tumble!! What's Next??We warned you of the downside risk yesterday in stocks, and it would have been very wise to pay attention. The S&P tumbled yesterday, careening through the vacuum zone back to 4144 and bottoming out just above the level under that, 4122. They were swiftly bought back, however, but that would have been a lot of pain to hold through if you were impatient and FOMO'd in at highs. Currently, we are hovering between 4182 and 4188. It could go either way from here. If we reject current levels, we could see another wave of selling, testing lows. We could also see a lift back to highs at 4214. It seems likely for stocks to feel out this broad range before making new highs and hitting our next profit target of 4228.

Stocks Consolidating!! Breakout??Stocks have continued to maintain their range between 4188 and 4214. The volatility in the S&P has consolidated a bit and we appear to be forming a bull flag or bull wedge at the moment. This could suggest that stocks are gearing up for another breakout. However, the Kovach OBV has dropped off considerably so we must be aware of the down side risk. There is a vacuum zone down to 4144. If we can break out, the next target is fairly close, at 4227.

ETH primed to short?The past few days have been wild for ETH climbing from sub 3k to 3500 in hours. In my opinion, this is not sustainable and a correction is due. We are obviously in a bull market, so if you do decide to short, please mitigate risk properly.

Correction Coming for Stocks??Stocks have peaked right under our profit target of 4227, at 4214. We have pretty good support underneath at 4188 and 4178. However there is a vacuum zone below to 4144. We may find some support at one of the Fibonaci levels drawn here. The S&P has been very strong lately but the price action is 'rounding off' which suggests that a correction is coming. The Kovach OBV has declined a bit which may support this. We certainly aren't short of stocks, just cautious to enter at highs. If we do catch some momentum, we will most likely hit our profit target of 4227. Our next profit target is 4293.

Mirror Protocoli like this coin, it's a decentralized Stock exchange Token based on Luna (Terra), very big potential as it allows to simple peoples as us to buy stonks with Metamask Wallet!
MIR is the governance token of Mirror Protocol, a synthetic assets protocol built by Terraform Labs (TFL) on the Terra blockchain.
Mirror Protocol is decentralized from day 1, with the on-chain treasury and code changes governed by holders of the MIR token. TFL has no intention of keeping or selling MIR tokens, and there are no admin keys or special access privileges granted. The intent for this is to be a completely decentralized, community-driven project.
Mirrored assets are blockchain tokens that behave like "mirror" versions of real-world assets by reflecting the exchange prices on-chain. They give traders the price exposure to real assets while enabling fractional ownership, open access and censorship resistance as any other cryptocurrency. Unlike traditional tokens which serve to represent a real, underlying asset, mAssets are purely synthetic and only capture the price movement of the corresponding asset.
Trading Parts :
Buy Zones :
- 8.5$ ( A bit )
- 7.2$ ( All in )
Take Profits :
Tp1 : 16.5$
Tp2 : 22.$
Happy Tr4Ding !


Bank of America BAC Bearish CrabBank of America (BAC)... this company is found in Warren Buffet's Portfolio and once it becomes a bargin price it will be found in mine too. I follow the advice layed out by The Oracle of Omaha. The company financials are very weak from a value investors point of view. The total revenue has been flat line at best for the past decade and when your operating income eats up 74% of your total revenue thats a problem. I always try to remember the law of depreciating return which is "you get back less than you put in." Warren Buffet always says "its easier to take 100,000 to a million than to take a billion to 100 billion. I mean the company is absoultly massive with 2 Trillion dollars in assets?!?! So, I guess the Value invstor needs to look at other things when considering Bank of America. I dont forget that major banks created these mortgage bonds back in 2008 that imploded when the real estate market crashed, so i have to dig deeper into where the assets are coming from. However their EPS has been growing at a decent rate over the past decade so thats also a plus. Their total ratio (becasue they do not report current assets and curret liabilities) is a 1.14 which if using a a current ratio thats real good (not exceptional but better than just plain "good") They are currently undervalued by the Ben Graham Formula (revised) by 61%. Which is a real good thing as well. They pay an annual dividend of 1.75%, but i am not sure if theyre an S&P aristocrat or not. Overall, based on what i have read based on Marry Buffets books and listening to videos of Warren Buffet himself i would grade BAC ( Bank of America Corp.) a C+ company which I would hold only for a few years up to 5 years max. Dont get me wrong the company is NOT going anywhere, so if youre looking to hold just to hold to sound trendy and chic amongst your friends then sure, but it is not going to be your star player, but more like your practice squad ...just a great supplemental.
the technical side is the Bearish Crab. the grey box is the PRZ with a 3.618 projection of the BC leg, a 1.618 of the XA leg and 2.0 fibo extension of the ABC legs. if youre looking for a decent bargain then wait for Price to reach the pink line which is .382 of the whole pattern and if youre looking for a great bragain then wait for the .618 of the entire pattern. Seeing how the market is flowing at the moment i would probably buy at the .382 of the retrace anything lower than that there might be mass hysteria of a market "crash" which is honestly a very much needed correction for the stock market. But a good deal is better than no deal. I dont publish often my investing ideas as my investing is vastly different than my speculation ideas.
If you guys want to know more about my investing ideas please let me know in the comments. I know value investing is not as flashy as speculating, but the longevity of investors is far greater than that of any speculator; moreover, it is of dire importance to know the difference of speculation and investing.


Stocks Tumble!!The S&P has dipped pretty hard from highs. We anticipated that we would see 4188, again yesterday and that's exactly where we are at the time of this writing. In fact it looks like stocks are not finished with the bear run and are pushing through this level. We are likely to find some support around this level, at least until the open, where we may catch some momentum. We have a few lows testing 4178, which we have added as a new level. Pay attention to this level since there is a vacuum zone below to 4144. The Kovach OBV has dipped sharply suggesting the aggressive rally in stocks is on pause for now.

NIO NIO has came down to the 618 will be interesting to see where it goes from here... Trade safe people!!

$TSLA - charting stonks stinks, make it 24/7A good place to bid some TSLA may well be this ascending trendline that has confluence with the golden pocket of previous up leg
Could treat it as a swing with stops below 619 and TP's around 815
Might make this trade on a crypto exchange to try the tokenised stonks out
I hate charting the gaps. Bankers need to control the open and close so they can manipulate when they are awake!

The Expanding channel on SP500 + Historical situations analysisToday we will look at the current situation on the index, and we will try to understand the possible paths the price may take from here.
What are we observing right now?
a) The price is inside a clear expanding channel. This type of structure has well define zones both on the upper and lower side
b) The higher degree structure is an ascending channel
c) We asked the question. What can we expect from here? The idea was to look for similar situations in the past in which we have a well-defined higher trendline working as a resistance. Based on the resolutions of those situations, we can make a filter to trade IF the sequence of movements happens.
We will show you 6 situations using SPX where the price had a clear upper limit that was tested several times. In these examples, you will see situations in which the price could break it and situations where the price couldn't do it. Let's start:
-------------------------------------------------------------------------
As you can see in these examples, we have two clear situations we should be paying attention to. Either the price is able to go above the expanding channel and make a small correction in which after that if the price makes a new local high we would have the confirmation for the new bullish movement OR the price is not able to break the line clearly, and bearish pressure comes after that.
Based on that, IF we want to develop bullish setups, we will be waiting for the price to go above the expanding channel, and our final target will be the higher trendline of the ascending channel (macrostructure)
IF the price cannot break the expanding channel, we can expect bearish scenarios like the ones we are showing with the red arrows.
Thanks for reading!

Stocks Hit Profit Target!! What's Next??Stocks broke out and hit our profit target exactly! After a few days of malaise before the FOMC, we had a breakout to 4214, a level of which you were alerted many days prior. Our next target is pretty conservative at 4227, then we have another at 4293. These are generated by Fibonacci extensions from Fibonacci levels anchored at the upper and lower bounds of the range the S&P has been respecting before the breakout. The Kovach OBV is still very strong, though it would be reasonable to expect a pullback, which could take us back to 4188.

Stocks Poised to Breakout??Stocks ranged at highs yesterday. The S&P is forming a very narrow range with a point of control about 4188, one of the levels we have mentioned many times here. The Kovach OBV is very strong, suggesting that a breakout is imminent. Since we are at highs, there is a risk for a retracement, which could take us back to 4144 again. If we are able to breakout, 4214 is the next target.

Trading map for ZOOM / Our filters to develop setups.Today we will speak about the exact situation we are waiting for before developing bullish setups on ZOOM.
Our trading philosophy is: Define the future situation you consider worth trading. Wait until that happens. Trade or Cancel the setup.
What are we waiting for on ZOOM?
1)Wait for the breakout:
We want to observe a clear bullish movement that breaks the current consolidation defined with the two yellow lines.
2)Wait for 5 - 10 days corrective pattern:
After the breakout, we want to observe sideways movements on the edge or above the broken structure (yellow lines) with a duration between 5 to 10 days
3) Look for a 1:4 risk-reward ratio setup:
Suppose the breakout and the sideways movement happens. We will be ready to trade that pattern. We want to be able to catch a 1 to 4 risk reward ratio setup AT LEAST. Why? Because that means that we are risking 1 dollar to make 4 dollars, and if we are right only 40% of the time on this setup, we are still extremely profitable. Also, once you have a clear breakout of a corrective pattern of this size, you tend to see bullish movements with similar proportions to the consolidation.
Thanks for reading; we hope this content was useful!

Analyzing the current situation on Disney (DIS)Today, we will take a look at the DIS chart:
A) The price is above a broken ascending channel which tells us about a bullish trend that has been accelerating
B) Finding Support on the cloned channel, we can see a clear corrective pattern (yellow lines)
C) From a Technical Perspective, this type of structure after the breakout tends to show continuation movements as the previous impulse.
D) The horizontal line is the activation level in which we consider our Analysis is active
E) We are using Fibo extensions to get an idea of possible Targets
F) The invalidation level is below the corrective structure.

New Highs for Stocks! Can they Hold them??Stocks managed to eek out new all time highs yesterday but just barely. There was quite a lot of resistance at this level, and it will take significant momentum to puncture through and maintain the rally. Entering a long here would be the height of fomo. Waiting for a deep seems much more reasonable and we could see the S&P cross a vacuum zone below to 4144 or 4122. These would be better levels to buy for at least a mean reversion trade. Take note of the vacuum zone to 4073.
