is the Trumph speech boost the Index? n is Wednesday the humpdayHello everyone! How was yesterday trade? Hope everyone stick to the strategy set the SL/TP for your day trade.
News📰 : as expected and anticipate more positive news this week 🔮
www.tradingview.com
**China shares waver, HK bounces as Beijing vows more support for consumption, AI**
HSI +1.30% at this news published.😂
Look at the HSI D Chart
- posted 28Feb2025
at point of writing; the index closed below key support level of 22900-23000 (the strong level of 23000 which is the 10MA level, the uptrend is broken 28Feb25); as mentioned this level has been retest 3 times, let's continue to monitor.
However, today the Index open Hi. So trade ⚠ cautiously. Don't chase Hi.
Trading volume: finance.yahoo.com
Date Volume
Mar 3,2025 4,338,200,000
Feb 28, 2025 6,578,300,000
Feb 27, 2025 6,257,000,000
Feb 26, 2025 5,138,100,000
Feb 25, 2025 4,449,800,000
Monthly
Mar 1 2025 - 4,338,200,000 (as of todate)
Feb 1 2025 - 93,960,700,000 (+7.53% from prev month)_correction
Jan 1 2025 - 52,385,800,000
Dec 1 2024 - 56,349,200,000
Avg past 3 months : 77.909Bn (+19.18% for the past avg vol); this imply the fund flow is abundance, hopefully this continues! Although the vol is slightly less than the last Oct 2024.
Look at the 4H chart
PEPPERSTONE:HK50
The HSI last Oct Hi @ 23241 has been broken, this level could be the resistance level for the Index to break the next level Hi. The HK50 last Oct Hi @ 23258.
Now, what's next?
As updated:-
Next level that we are looking at to break:
20985
21336-21350
22020-22535, 22840-22900
23241-23275-23314- 23471 (need to break above this level to change back to uptrend movement, else probably is gonna be sideways)
23952-24101
24385
🚨 as of ✍️ :
it stays above 22535(retest 3 times and this might formed very strong support level).
🗝️ support level :
22990 broken :22340-22750 (this level being tested 3 times 17,20Feb & 4Mar; last tested at 22535.3)
MACD - Deadcross was marked in Green, continue to curving down (4h Chart)
KDJ - Reverse to Bullish green zone on 4Mar25; the CFD continue to trading the upwards trend till now.
BB - Still within lower BB channel and gap up trading at upper BB channel/
the Mid-line 4H chart at 22960-975 was corrected from 23320.
Trade Plan: might pullback to 23020 to fill the gap. Range : 23025-23258
Buy into support : 22880-22960(confirm with indicators)
Sell at resistance : 23150, 23190, 23372/400, 23454,23512(it soared to hit ,this morning)
Monitor the 1H,4H movement with confirmation using MACD & KDJ indicator.
Set your tf, have your entry and exit plan!
Pay attention to the Goldencross/DeadCross; practice makes perfect.
Let's follow our own strategy and zen with 📙 and 🍵 for profits.
Happy Trading everyone!
🎯 Start to accumulate China & HKG for the potential upside for the year! All retracement is a good entry point.
🔎 DYODD and don't listen to anyone. Invest in yourself, do some study and learn along the way while you trying to verify or finding the answer if to start invest in CHN/HKG markets.
HKEX:2800 - 22.90-22.82 if it happens to retrace back to this level, otherwise anytime NOW is entry point! It's confirmed by the 200MA (above in W chart) ; also the W chart MACD GoldenCross. Cross-check it; if need helps let us know.
HKEX:2823 - 13.17-14.75 can start to open position and start accumulate, is allowed to wait for confirmation once it breaks 14.75 level. But you will be getting at higher cost...
HKEX:2801 - open position at price : 23.73-23.80 or anytime NOW! if ever retraced back to 23.36-23.66 accumulate more.
HKEX:3067 - open position now, add position when it retraced to 11.63,,11.33 or below. If you have missed, you may tk position still good to start at 11.85,11.99,12.15
** Please Boost 🚀/LIKE 👍, FOLLOW ✅, SHARE 🙌 and COMMENT ✍ if you enjoy this idea or need help! *
Support and Resistance

Seeds in Chaos, Petals in Profit -A trader's guideSeeds in Chaos, Petals in Profit
A trader's guide to reading the market through nature's lens.
By: Masterolive
Intro:
This trader's guide is not another cookie-cutter trading system.
Instead, it focuses on building a long-term mindset and a way to read the market's chaos through nature's lens. This guide is grounded in real success but is not for the daily trader; it works for long-term swings using hourly price moves.
Over seven years of trading, I developed a unique way to view the market, which led to a practical trading mindset. The technique comes from simplifying the chart after experiencing endless combinations of indicators to no avail. It wasn't until I had to explain my concept to someone else that I found a way to use a garden analogy that fits the mindset well to see the market as a natural system: planting in chaos, thriving through storms.
Later, I read two books: "The Alchemy of Finance" by George Soros and "The Misbehavior of Markets" by Benoit Mandelbrot and Richard L. Hudson. Surprisingly, these two books validated my approach and inspired me to share it. Previously, I would tell no one because I thought it was silly.
The overall goal is to plant a garden, watch it grow, and understand how the weather affects the plants. This guide walks you through determining what flowers you want to plant and how to read the weather after you have made your choice.
It uses a garden and planting flowers as an analogy to choosing the right stocks and interpreting an EMA indicator to determine the market's direction. This guide also works well for Bitcoin.
This guide will help you understand how to read and interpret the chart. It will also give you accurate future context so you react less to the market moves and see the bigger picture: Plant while they panic.
This guide is not financial advice.
Part One - Planting.
Some traders focus on various companies based on technicals or fundamentals, some short-term and some long-term. Other traders will focus on a few stocks or diversify across many.
For this guide, we pick and diversify a sector with roles that thrive together. The industry can be broad or small, but we will use 10 assets, including nine stocks and Bitcoin, and explain how they correlate and grow into a weather-worthy garden.
In this garden, we will focus on Tech and Finance and explain how to plant and organize the garden. First, we must look back at the broadest picture in finance. We will choose a stock exchange and a crypto exchange in this garden. (1 and 2 out of 10 flowers)
Why an exchange? Simply put, traders will always look for stocks and crypto to buy. They will look for the best companies and the best opportunities. Therefore, stock exchanges will benefit from the revenue they generate. If a stock goes parabolic, the exchange still profits from that price move.
Choosing the exchange skips the hassle of finding companies in a haystack. The same is true for the crypto exchange. Our garden has two flowers: one stock exchange and one crypto exchange, representing those two sectors.
Next, what else can correlate with our garden from a zoomed-out view?
Let's choose a Bank and a payment processor. (3 and 4 out of 10 flowers)
Traders will need the bank to on and offramp their cash profits to and from the stock and crypto exchange. Meanwhile, they will need to process those electronic payments.
The bank and payment processors benefit from trading surges; if everyone piles in for a parabolic price move of a particular stock, the bank and payment processors benefit from the action, and the exchanges offering the stock get revenue from the surge.
Once again, this choice skips the need to hunt for specific stocks. It takes advantage of all stocks since traders need cash, banks, electronic payments, and exchanges to buy those company stocks or bitcoin.
Our garden now has Four flowers, a bank and payment processor, and two exchanges for this sector. The correlation? Exchanges, banks, and processors all thrive when traders move money.
The fifth is a pivot flower before we discuss the tech company sector. This pivot flower is a gambling company (5 out of 10).
How does this correlate? Some traders and other users gamble with their cash and profits; even in a recession or a depression, people will still gamble. Plus, users might take their gambling winnings and invest them in a stock or buy bitcoin. They need a bank, an exchange, and a payment method.
In this case, the flowers are self-reinforcing: gambling winnings or losses, stock booms or busts; it doesn't matter in the big picture because, once again, exchanges, banks, and processors all thrive when people move money. Our garden now has five flowers with a broad but strong correlation.
Now, on to the tech sector with the last five flowers.
You will hone in on specific tech roles at this point, but remember that your choices will be self-reinforcing.
If your choice booms, the exchange benefits, and you benefit again from the exchange stock. You will electronically transfer your profits to your bank, which you benefit from by owning the bank stock and payment processor. But if you're smart, you will skip the gambling and let the crowd roll the dice while you plant the profits.
We will focus on two more flowers (6 and 7 out of 10) for tech, so we need to find companies exposed to the popular and relevant tech we want. For tech company 1, you could expose yourself to AI, EVs, and ROBOTS. For tech company 2, Semiconductors (or graphics cards).
In this section of our garden, graphic cards and AI rely on one another, while EVs and robots use AI to operate. Eventually, people will buy or sell the robot and EV, and some may use the profits to buy stock (or Bitcoin), requiring a bank and payment processor.
Meanwhile, people use LLMs, log into their bank, or exchange daily on a computer that requires a graphics card.
Our garden now has seven flowers out of 10, 3 more to go!
We want to diversify (but stay correlated with our garden), so next, we will look at a real estate company or ETF—but not just any company or ETF, one that develops in tech hub areas. How does this correlate?
Robots, AI, EVs, and graphics cards all need workers to operate the companies; young talent will want to move to places where they can work in AI or Robotics or factory EV workers, so the real estate in those areas will be in high demand, so now we own the real estate for our Ai, EV, Robots, and graphic card workers.
As tech grows, real estate booms, driving more money through exchanges, banks, and processors.
We now have eight flowers in our weather-worthy garden.
For the 9th flower, we turn to a wildflower: none other than Bitcoin. Bitcoin is not just a crypto coin but a capital asset, a store of value for your currency when it debases.
People, especially tech workers, will buy, trade, and sell Bitcoin.
As people learn and turn to the asset, global capital will flow through Bitcoin as people around the world save their cash value,
whether it be from gambling winnings, selling a car, selling real estate, selling a stock, or simply putting part of their income from their tech job into it regularly. All of this requires Exchanges, Banks, and payment processors to move.
Bitcoin correlates with that, as exchanges profit off bitcoin, which you own stock in the exchange company. You still need a bank to land on and a payment processor to move the money electronically.
We now have nine flowers in our garden, and it's almost complete.
How can we diversify even more? We can use industrial metal for our last flower, but how does an industrial metal correlate with our tech and finance garden?
Copper is the metal that conducts electricity, and electricity is needed to move money, send Bitcoin, power a growing network of EV superchargers, and power the factories that produce EVs, graphics cards, robots, and more. Copper's the most vigorous root, tying every flower, from tech to finance, into a weather-worthy bed. Meanwhile, the crowds go for gold and sleep on copper.
That completes our garden with 10 flowers. It's a diversified flowerbed, but the flowers correlate in the big picture: Tech drives money movement, which benefits exchanges, banks, and processors; copper powers tech, which drives Bitcoin adoption.
Your goal is to find and build your garden. Think up different bigger pictures with other sectors and roles. Correlating these assets keeps the garden strong through chaos and self-reinforces one another.
To review, we have the following:
Stock exchange
Crypto Exchange
Bank
Payment processor
Gambling
Ai / EV / Robots
Semiconductors (Graphics cards)
Real estate
Bitcoin
Copper
Now that we have planted our garden, let's examine the weather and its meaning. We will learn to read the weather and see when storms are coming or clearing.
In part 2, you will set a simple EMA indicator, learn how to interpret the weather, and tend to the flowers in our garden.

How I play 0DTE during EOD volatility of last 15min/30minChart is from yesterday 3/3/2024(mon) + today 3/4/2024(tue)
Timeframe:1min
Indicator used: MACD, SlowStochastic RSI, 5MA, 20MA.
I use 1min 5ma as TREND(S) to scalp, just make sure MACD+SlowStochastic agrees.


BTC daily analysisAfter Trump's crypto reserves news, BTC was able to shrug off the bearish momentum and bounce back from around 81,500 and close above the previous daily closing of 86,000. That opens the way for price to now retest the previous daily high of 93,800. The asian session has closed slightly bearish but the daily momentum is still to the upside, which should see the London and/or New York session moving the price up. The best entry would be as the price breaks and closes above the Asian 4H high of 89,000.

SEI - good long zone, needs to flip .26 as supportSEI is in a great zone of interest right now under .26 cents.
If we can break the blue downtrend, and build .26 cents as support, we might have something here. The next milestone would be building .33 cents as support.
Right now SEI is a good swing trade to .26 cents, and .33 cents.
If we actually do get a moonshot from SEI, then I see anywhere from 1.80-ish to $3.85 as a nice super bullish profit taking zone. That's thinking ahead to later this year if BTC didn't already put its top in.
That's all for now!
Thank you!

USDJPY InsightHello, dear subscribers!
Please share your personal opinions in the comments. Don't forget to like and subscribe!
Key Points
- European Commission President Ursula von der Leyen has proposed the "REARM Europe Plan" to the leaders of the EU's 27 member states. This plan aims to secure at least €800 billion for increased defense spending by suspending EU fiscal rules.
- In Germany, the Christian Democratic Union (CDU), Christian Social Union (CSU), and Social Democratic Party (SPD) have agreed to establish a €500 billion fund for infrastructure investment.
- As of March 4, the U.S. has officially announced tariffs on Mexico, Canada, and China, with the affected countries responding with retaliatory tariffs.
This Week’s Key Economic Events
+ March 5: U.S. February ADP Nonfarm Employment Change
+ March 6: ECB Interest Rate Decision
+ March 7: U.S. February Nonfarm Payrolls, Unemployment Rate, and Fed Chair Powell’s Speech
USDJPY Chart Analysis
The uptrend has been broken, leading to a downward trend. Recently, the price found support around the 148 level and successfully rebounded. There is a high probability of a rapid rise toward the 151 level. If 151 is breached, further gains toward 155 can be expected. However, if it fails to break through resistance, a drop toward 147 may occur, maintaining the current trend.

GBP/AUD: Topping Signals Flash After Relentless RallyThe bearish pin candle on the GBP/AUD daily chart on Tuesday is a warning sign for bulls after a more than seven big-figure rally in less than a fortnight. RSI (14) is flashing extreme overbought conditions, sitting at levels that have marked major market tops in the past.
Fundamentally, the move stacks up—improved Eurozone optimism from increased military spending and weaker energy prices is a tailwind for the U.K., while ongoing U.S.-China tariff skirmishes weigh on the AUD, overshadowing early signs of an Australian economic recovery.
But that’s all baked in now, leaving GBP/AUD vulnerable to downside without fresh catalysts to push the narrative further.
If the pair nears Tuesday’s high, it could offer an entry point for those looking to fade the move. Stops could be placed above that level, targeting an initial pullback to 2.0300—the December 2024 high. From there, traders can reassess whether to aim for 2.0150 or square the trade.
Good luck!
DS

RUSSELL 2000 Chart Fibonacci Analysis 030425Trading Idea
1) Find a FIBO slingshot
2) Check FIBO 61.80% level
3) Entry Point > 206/61.80%
Chart time frame: B
A) 15 min(1W-3M)
B) 1 hr(3M-6M)
C) 4 hr(6M-1year)
D) 1 day(1-3years)
Stock progress: A
A) Keep rising over 61.80% resistance
B) 61.80% resistance
C) 61.80% support
D) Hit the bottom
E) Hit the top
Stocks rise as they rise from support and fall from resistance. Our goal is to find a low support point and enter. It can be referred to as buying at the pullback point. The pullback point can be found with a Fibonacci extension of 61.80%. This is a step to find entry level. 1) Find a triangle (Fibonacci Speed Fan Line) that connects the high (resistance) and low (support) points of the stock in progress, where it is continuously expressed as a Slingshot, 2) and create a Fibonacci extension level for the first rising wave from the start point of slingshot pattern.
When the current price goes over 61.80% level , that can be a good entry point, especially if the SMA 100 and 200 curves are gathered together at 61.80%, it is a very good entry point.
As a great help, tradingview provides these Fibonacci speed fan lines and extension levels with ease. So if you use the Fibonacci fan line, the extension level, and the SMA 100/200 curve well, you can find an entry point for the stock market. At least you have to enter at this low point to avoid trading failure, and if you are skilled at entering this low point, with fibonacci6180 technique, your reading skill to chart will be greatly improved.
If you want to do day trading, please set the time frame to 5 minutes or 15 minutes, and you will see many of the low point of rising stocks.
If want to prefer long term range trading, you can set the time frame to 1 hr or 1 day.

BERACHAIN Chart Fibonacci Analysis 030425Trading Idea
1) Find a FIBO slingshot
2) Check FIBO 61.80% level
3) Entry Point > 6.13/61.80%
Chart time frame: B
A) 15 min(1W-3M)
B) 1 hr(3M-6M)
C) 4 hr(6M-1year)
D) 1 day(1-3years)
Stock progress: C
A) Keep rising over 61.80% resistance
B) 61.80% resistance
C) 61.80% support
D) Hit the bottom
E) Hit the top
Stocks rise as they rise from support and fall from resistance. Our goal is to find a low support point and enter. It can be referred to as buying at the pullback point. The pullback point can be found with a Fibonacci extension of 61.80%. This is a step to find entry level. 1) Find a triangle (Fibonacci Speed Fan Line) that connects the high (resistance) and low (support) points of the stock in progress, where it is continuously expressed as a Slingshot, 2) and create a Fibonacci extension level for the first rising wave from the start point of slingshot pattern.
When the current price goes over 61.80% level , that can be a good entry point, especially if the SMA 100 and 200 curves are gathered together at 61.80%, it is a very good entry point.
As a great help, tradingview provides these Fibonacci speed fan lines and extension levels with ease. So if you use the Fibonacci fan line, the extension level, and the SMA 100/200 curve well, you can find an entry point for the stock market. At least you have to enter at this low point to avoid trading failure, and if you are skilled at entering this low point, with fibonacci6180 technique, your reading skill to chart will be greatly improved.
If you want to do day trading, please set the time frame to 5 minutes or 15 minutes, and you will see many of the low point of rising stocks.
If want to prefer long term range trading, you can set the time frame to 1 hr or 1 day.


$SILVER Head & Shoulders Silver Head & Shoulders with Bearish Divergence on the Weekly at long term resistance...

SOL/USDT 2H Chart🔹 Asset: Solana (SOL/USDT Perpetual Futures)
🔹 Timeframe: 2-Hour
🔹 Exchange: MEXC
📊 Market Overview:
Solana has bounced from a key support zone after a strong breakdown, signaling a potential shift in momentum. The structure has confirmed a Break of Structure (BOS), which may lead to further upside movement before facing resistance.
📈 Key Technical Insights:
✅ Support Holding: The price has reacted well to the $130 - $135 support zone, leading to a bounce.
✅ Mini Reversal Area ($150 - $155): This zone could act as a minor resistance before a deeper retracement.
✅ Main Reversal Area ($165 - $175): A significant supply zone where selling pressure may increase.
📌 Trading Plan:
🔹 Bullish Scenario: If SOL holds above the support zone and breaks past the Mini Reversal Area ($150 - $155) with volume, a further move toward the Main Reversal Area ($165 - $175) is likely.
🔹 Bearish Scenario: If SOL struggles to break past $150 - $155, a retest of the support zone ($130 - $135) could happen.
🔹 Risk Management: Watch for rejection wicks or bearish divergence before entering short positions.
📢 Final Thoughts:
📌 A strong move above $155 could trigger further upside momentum.
📌 Traders should watch price action closely at the marked reversal areas.
📌 Be patient, wait for confirmation, and manage risk accordingly!
⚡ Trade smart and stay ahead of the market! 🚀

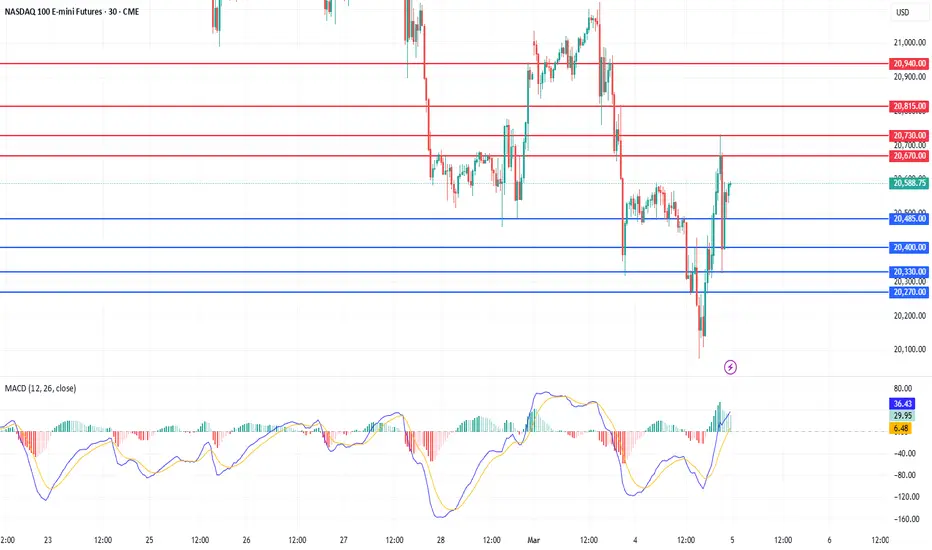
Today analysis for Nasdaq, Oil, and GoldNasdaq
The Nasdaq closed lower as market volatility increased due to tariff concerns. Although the index dropped below the 240-day moving average, it formed a lower wick, indicating an attempt to establish a short-term bottom. On continuous futures, the 240-day MA is slightly below 20,000, meaning that the 20,100–20,000 zone is a key support area where a technical rebound is likely following the recent sharp decline. If the market falls into this zone, it could present a swing buying opportunity. Since the daily MACD and signal line are dropping steeply, a sideways consolidation period may be necessary to reduce their angle and separation before further directional movement.
Given that the Nasdaq rebounded strongly after forming a lower wick yesterday, a pullback in pre-market trading could provide a buy-the-dip opportunity. Additionally, potential bullish catalysts include today’s ADP Non-Farm Employment data and Friday’s Non-Farm Payroll report.
On the 240-minute chart, the index is forming a bullish divergence and attempting a golden cross, reinforcing the buy-the-dip strategy at current levels. Therefore, chasing shorts is not advisable, as the Nasdaq has entered a more attractive buying zone. A range-trading approach remains effective, with a preference for buying near support.
Crude Oil
Crude oil closed lower, finding support near previous demand zones. Despite the continued downtrend, the $66–67 range remains a strong support area, making it a potential rebound zone for technical buyers. However, on the daily chart, the MACD and signal line are sloping downward sharply, meaning that selling pressure could intensify further. Long positions should be initiated as close to the lower support zone as possible.
On the 240-minute chart, the MACD has formed another bearish crossover, confirming strong selling momentum. However, when compared to the previous MACD level near $68.50, price has declined further, but the MACD has not dropped as low, suggesting a potential bullish divergence. Since this zone has historically acted as strong support, a buy-the-dip strategy remains preferable, but traders should remain cautious of today’s Crude Oil Inventory report, which could lead to increased volatility.
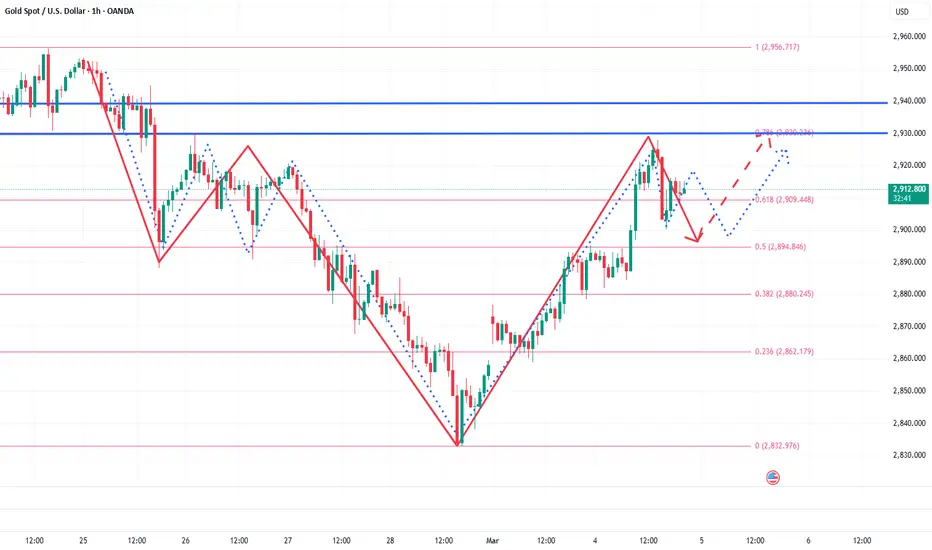
Gold
Gold closed higher, successfully rebounding from support. Yesterday, gold reached the previously projected target of 2,925, aligning with the 240-day moving average characteristics.
If gold continues higher, the 2,940 level will act as resistance, as this is a previous supply zone on the daily chart. Therefore, further upside should be monitored carefully before making new decisions. Since the daily MACD and signal line remain widely separated, this is not an ideal condition for chasing long positions. Even if gold extends its rally, a pullback is likely, making buying dips a safer approach.
On the 240-minute chart, the MACD formed a golden cross, leading to a sharp rally. As expected, price reached the 60-day MA following the 240-day MA bounce. However, while the MACD has moved above zero, the signal line is still below zero, meaning that another corrective phase could occur before further upside. Additionally, there is a possibility that gold could revisit the 2,850 support zone to form a double-bottom structure, making buying dips a better strategy than chasing breakouts. Overall, a range-trading strategy—buying low and selling high—remains effective, and today’s ADP Non-Farm Employment data could introduce market volatility.
As market conditions shift, risk management remains crucial. Stay disciplined, adapt to volatility, and trade with confidence. Wishing you a successful trading day! 🚀
If you like my analysis, please follow me and give it a boost!
For additional strategies for today, check out my profile. Thank you!
NZDUSD Possible SellNZDUSD is a strong downtrend and price is currently forming a bearish flag . A sell is in place once the price pull back up into the bearish OB . A second entry would be to wait for the price to break down out of the channel and the blue support line .
Good LUck

1inch it's time to bounce1d great support.
1d divergence.
correction from december, already 3 months, 85 days..

Stock Of The Day / 03.04.25 / OKTA03.04.2025 / NASDAQ:OKTA #OKTA
Fundamentals. Earnings report exceeded expectations.
Technical analysis.
Daily chart: Uptrend, update of the previous high.
Premarket: Gap Up on increased volume.
Trading session: The price has been trading in a wide range of 101.50 - 104.50 for a long time after the initial impulse at the opening of the session. Volumes for buying appeared after 2:00 p.m. and the price confidently broke the high of the day 104.50. We are considering a long trade in case a retest and holding the price above the level.
Trading scenario: #breakout of level 104.50
Entry: 105.13 when exiting upwards from the range above the level 104.50
Stop: 104.38 we hide it behind the level 104.50 with a small reserve
Exit: We observe a pure trend movement after entering the position. Close the position at a price of 108.35 before the session closes.
Risk Rewards: 1/4
P.S. In order to understand the idea behind the Stock Of The Day analysis, read the following information .

PLTR eyes on $84.69 (again): Golden Genesis fib and a MUST HOLDHere we are again at a Golden Genesis fib, strongest of all fibs.
"Golden" as in an exponent/multiple of .618, the Golden Ratio.
"Genesis'" as in the primary wave of this asset's growth pattern.
A retest was expected but bulls needed it to happen much sooner.
The high altitude drop has pierced the fib instead of a clean bounce.
Bulls need to "orbit" this fib and then attempt to slingshot Northward.
=============================================================================
Previous post calling the last pullback:
============================================================================

USDCAD SELL SETUPDaily rejection from supply and evening star formed. With DXY being bearish and USoil finding strong support, I like for UCAD to set up for bearish wave from here!

GBPUSD BUY 📊 Technical Analysis & Entry Signal 💹
🔍 The chart shows a strong uptrend where the price has broken a key resistance level and is now pulling back to retest it. As highlighted in the analysis, it's crucial to wait for a complete pullback and confirmation before entering a trade.
📈 Entry Signal:
✅ Entry: After pullback confirmation around 1.27570
🎯 Targets:
First Target: 1.27952
Second Target: 1.28269
Third Target: 1.28645
🛑 Stop Loss: 1.27414 (Risk management is essential)
📝 Important Note: Always manage your risk and avoid entering without confirmation. 📉

Ebay Wave Analysis – 4 March 2025
- Ebay reversed from pivotal support level 61.15
- Likely to rise to resistance level 67.00
Ebay reversed up exactly from the pivotal support level 61.15 (which has been reversing the price from last December), standing near the lower daily Bollinger Band and the 61.85 Fibonacci correction of the upward impulse from October.
The upward reversal from this support zone created the daily Japanese candlesticks reversal pattern Long-Legged Doji – which stopped the previous ABC correction 2.
Given the clear daily uptrend, Ebay can be expected to rise in the active impulse wave 3 to the next resistance level 67.00.

Nikkei to continue in the downward move?JP225USD - 24h expiry
Although the bears are in control, the stalling negative momentum indicates a turnaround is possible.
A higher correction is expected.
The primary trend remains bearish.
We therefore, prefer to fade into the rally with a tight stop in anticipation of a move back lower.
Further downside is expected although we prefer to sell into rallies close to the 37650 level.
We look to Sell at 37650 (stop at 38290)
Our profit targets will be 36000 and 34390
Resistance: 36790 / 38275 / 40675
Support: 35590 / 34390 / 32680
Risk Disclaimer
The trade ideas beyond this page are for informational purposes only and do not constitute investment advice or a solicitation to trade. This information is provided by Signal Centre, a third-party unaffiliated with OANDA, and is intended for general circulation only. OANDA does not guarantee the accuracy of this information and assumes no responsibilities for the information provided by the third party. The information does not take into account the specific investment objectives, financial situation, or particular needs of any particular person. You should take into account your specific investment objectives, financial situation, and particular needs before making a commitment to trade, including seeking advice from an independent financial adviser regarding the suitability of the investment, under a separate engagement, as you deem fit.
You accept that you assume all risks in independently viewing the contents and selecting a chosen strategy.
Where the research is distributed in Singapore to a person who is not an Accredited Investor, Expert Investor or an Institutional Investor, Oanda Asia Pacific Pte Ltd (“OAP“) accepts legal responsibility for the contents of the report to such persons only to the extent required by law. Singapore customers should contact OAP at 6579 8289 for matters arising from, or in connection with, the information/research distributed.

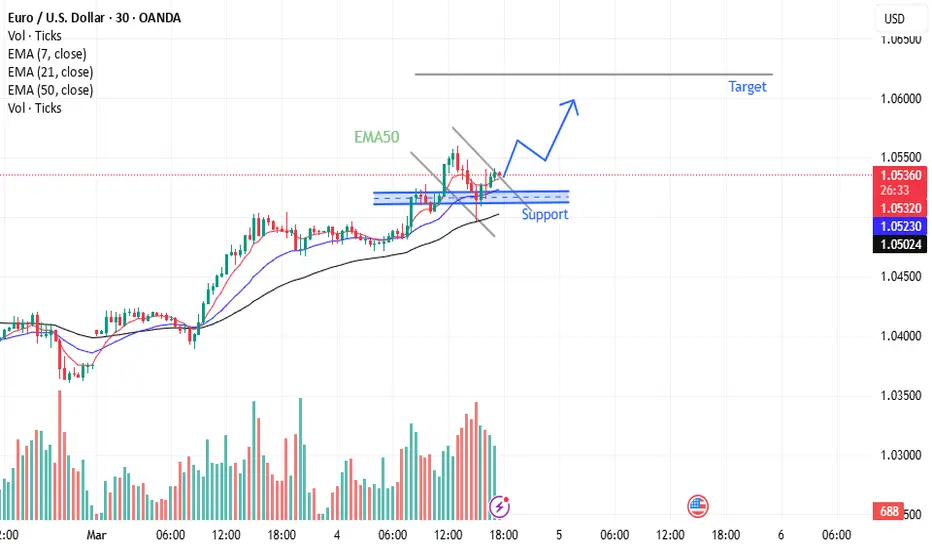
EUR/USD Trade Setup: Long### **📢 EUR/USD Trade Setup: Long Entry at 1.05200 🚀**
EUR/USD presents a **buy opportunity** at **1.05200**, supported by the **EMA50 trend** and a **strong support level at 1.05100**.
---
### **🔹 Trade Details:**
✅ **Entry:** **1.05200** (Long)
✅ **Target TP1:** **1.06200** (+100 pips)
✅ **Stop Loss:** **40 pips below entry**
✅ **Support Level:** **1.05100**
---
### **🔹 Strategy & Risk Management:**
🔹 If the price holds above **1.05100**, bullish momentum could push it toward the **1.06200 target**.
🔹 **Set stop loss** properly to protect capital.
🔹 **Secure profits** along the way or set a **break-even point** as price moves in your favor.
📈 **Trade smart & follow proper risk management for success!** 🚀
Gold still has room to continue falling,continue to short goldBros, according to the trading strategy shared in my last article, whether you are short gold in the 2915-2925 zone or long gold near 2900, I believe you have made very considerable profits in both long and short transactions. Currently, gold is trading around 2913, and volatility has narrowed, gold should still have room to continue falling. Gold fell from the interim high of 2956 to around 2832, a total drop of more than $120, but pulled back to around 2928 with two huge positive candlesticks within 2 days. The rebound was too fast and did not go through the stage of shock bottoming and rebound. So the too fast rebound is actually not conducive to the continued rise of gold; in addition, according to the current structure and symmetry of gold, gold still has the need to continue to fall back to the 2895-2885 area in a short period of time, as shown in the following figure:
So in short-term trading, we can still keep the rhythm of shorting gold!
Bros, profits are the ultimate goal in trading. Accumulating profits is what changes lives and destinies. Choosing wisely is far more important than just working hard. If you want to replicate trade signals and earn stable profits, or if you want to deeply learn the correct trading logic and techniques, you can consider joining the channel at the bottom of this article!