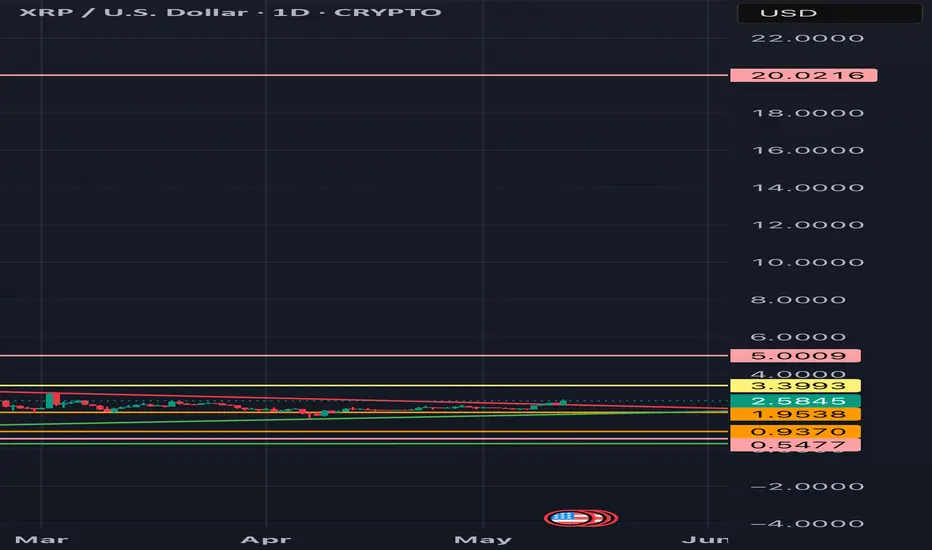
New Target Now Available. $20 A new target has been made available. I told you we were going down and we were, then I told you we were goin up and we did.
Now I’m telling you… we are aiming for $20
Support and Resistance
GBPUSD SHORTPrice took me out last week but looks like it was a liquidity grab, Now reacting to what the market is showing me;
Market structure bearish on HTFs DW
Entry at both Weekly And Daily AOi
Weekly Rejection at AOi
Daily Rejection at AOi
Daily Previous Structure Point
Around Psychological Level 1.33500
H4 EMA retest
H4 Candlestick rejection
Rejection from Previous structure
Levels 4.43
Entry 100%
REMEMBER : Trading is a Game Of Probability
: Manage Your Risk
: Be Patient
: Every Moment Is Unique
: Rinse, Wash, Repeat!
: Christ is King.

DeGRAM | GOLD fixed under the supply area📊 Technical Analysis
● Break back below the blue median line turned the $3 ,260 ‑ 3,320 supply into resistance; the rebound stalled there, forming a bearish flag.
● With price sliding underneath the flag’s base, momentum points to the channel floor/ horizontal supports at 3 200 and 3 100; short view void on a close above 3 315.
💡 Fundamental Analysis
● May US retail‑sales beat (+0.5 % m/m) and hawkish Fed remarks (“rates may stay high for some time”) lifted 10‑yr yields toward 4.50 %, firming the USD.
● World Gold Council reports the largest weekly ETF outflow since February, signalling softer investment demand.
✨ Summary
Supply‑zone rejection plus firmer USD/yields favour shorts: targets 3 200 → 3 100; exit if price reclaims 3 315.
-------------------
Share your opinion in the comments and support the idea with a like. Thanks for your support!

Focus on 3200 for some support during the day🗞News side:
1. Sino-US tariffs have been eased
2. U.S. trade progress and focus on geopolitical risks
📈Technical aspects:
Yesterday we gave a long trading strategy and have been waiting to see whether the gold price can touch our target point of 3270. However, gold did not fluctuate much after the opening of the Asian market, so I chose to manually close the position near 3256.
To be honest, the market did not fluctuate much today whether it was up or down, and it is still consolidating within our box range of 3220-3265. Although gold is generally weak, it has a higher probability of strengthening during the day, and the early gap may be ready for market recovery. At present, the gold price has tested the 3240 line many times. If it cannot stand above 3240, it may test the strong support of 3200 again. If there is no breakthrough below the strong 3200 support, the market may repeat
If you agree with this view, or have a better idea, please leave a message in the comment area. I look forward to hearing different voices.
FOREXCOM:XAUUSD FXOPEN:XAUUSD TVC:GOLD FX:XAUUSD OANDA:XAUUSD

Has Alcoa Bottomed?Alcoa has been falling since Thanksgiving, but some traders may think the aluminum stock has bottomed.
The first pattern on today’s chart is the April 9 high of $26.67. AA was trapped under that level for a month but yesterday it closed above it for the first time. Is the old resistance broken?
Second is the series of higher lows during the period of bottoming. Those may suggest buyers outnumber sellers.
Third, the 8-day exponential moving average (EMA) is climbing toward the 21-day EMA. A crossover could indicate the short-term trend is getting bullish. MACD is also rising.
Finally, AA is about 20 percent below its 200-day simple moving average. That may provide space for a rebound -- especially with lower tariffs easing worries about the economy.
TradeStation has, for decades, advanced the trading industry, providing access to stocks, options and futures. If you're born to trade, we could be for you. See our Overview for more.
Past performance, whether actual or indicated by historical tests of strategies, is no guarantee of future performance or success. There is a possibility that you may sustain a loss equal to or greater than your entire investment regardless of which asset class you trade (equities, options or futures); therefore, you should not invest or risk money that you cannot afford to lose. Online trading is not suitable for all investors. View the document titled Characteristics and Risks of Standardized Options at www.TradeStation.com . Before trading any asset class, customers must read the relevant risk disclosure statements on www.TradeStation.com . System access and trade placement and execution may be delayed or fail due to market volatility and volume, quote delays, system and software errors, Internet traffic, outages and other factors.
Securities and futures trading is offered to self-directed customers by TradeStation Securities, Inc., a broker-dealer registered with the Securities and Exchange Commission and a futures commission merchant licensed with the Commodity Futures Trading Commission). TradeStation Securities is a member of the Financial Industry Regulatory Authority, the National Futures Association, and a number of exchanges.
TradeStation Securities, Inc. and TradeStation Technologies, Inc. are each wholly owned subsidiaries of TradeStation Group, Inc., both operating, and providing products and services, under the TradeStation brand and trademark. When applying for, or purchasing, accounts, subscriptions, products and services, it is important that you know which company you will be dealing with. Visit www.TradeStation.com for further important information explaining what this means.

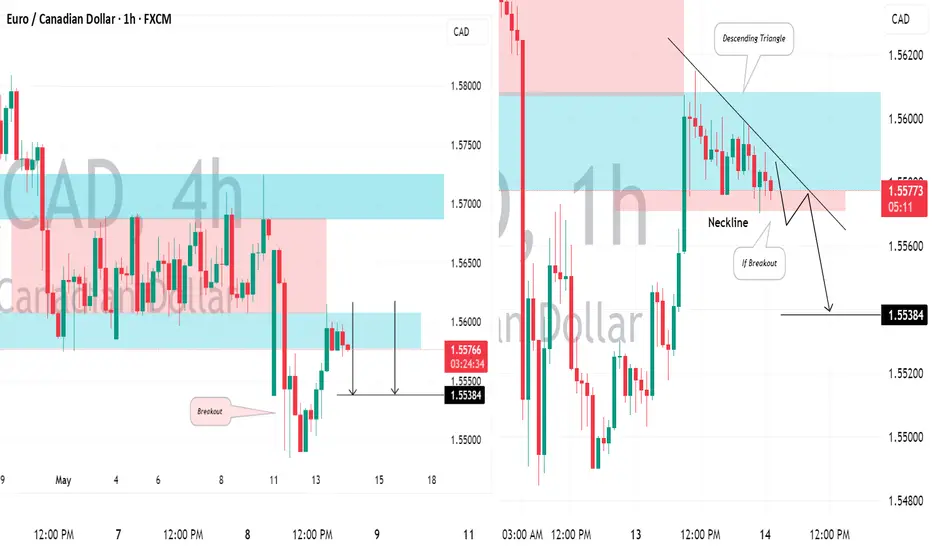
EURCAD: Your Trading Plan For Today⚠️EURCAD is currently testing a recently violated horizontal support level within a trading range.
It is highly likely that this broken structure has now become resistance.
We will look for a confirmation to sell upon a bearish breakout of the neckline of a descending triangle pattern on the 1-hour timeframe.
A close of the hourly candle below 1.5545 will confirm this violation, with an anticipated bearish continuation targeting at least 1.5538.
Best GOLD XAUUSD Psychological Levels Indicator on TradingView
There is one free technical indicator that will show you every significant psychological level on Gold XAUUSD chart.
It is available on TradingView and it is very easy to set.
Discover the best psychological support and resistance indicator for Gold trading , its settings and useful tips.
First, let's discuss the significance of psychological levels in GOLD XAUUSD analysis and trading.
The classic way of the search of significant supports and resistance is based on the analysis of a historic price action.
However, while Gold constantly sets new historic highs such a method does not work, because there are no historic resistances to rely on.
In such a situation, the only reliable strategy to find potentially strong resistances is to analyze psychological levels.
Psychological levels are the round numbers based price levels. Because of the common human psychological biases, these levels attract the interest of the market participants and the prices tend to react to them.
A great example of a psychological level in Gold trading is 3000 level.
It served as a resistance first and after a breakout turned into an important support.
And I found a free technical indicator that plots all the significant psychological levels efficiently.
One more thing to note is that I strictly recommend searching for psychological levels on a daily time frame, because it provides the most relevant perspective.
To use this indicator, search "round" in indicators wind ow.
It is called "Round numbers above and below".
Click on that and it will start working immediately.
You can see that the indicator plotted 3 significant psychological resistances above current prices and 3 supports below on Gold chat.
In the settings of the indicator, you can change the number of levels to identify and change the style of the horizontal lines.
Examine the reaction of the price to psychological supports that the indicator shows. These levels may remain significant in futures and applied for pullback/breakout trading.
With a crazy bullish rally that we contemplate on Gold this year, psychological levels will be the most reliable technical analysis tools for the identification of future bearish reversals and corrections.
This free technical indicator on TradingView will help you in search of the strongest ones.
❤️Please, support my work with like, thank you!❤️
I am part of Trade Nation's Influencer program and receive a monthly fee for using their TradingView charts in my analysis.

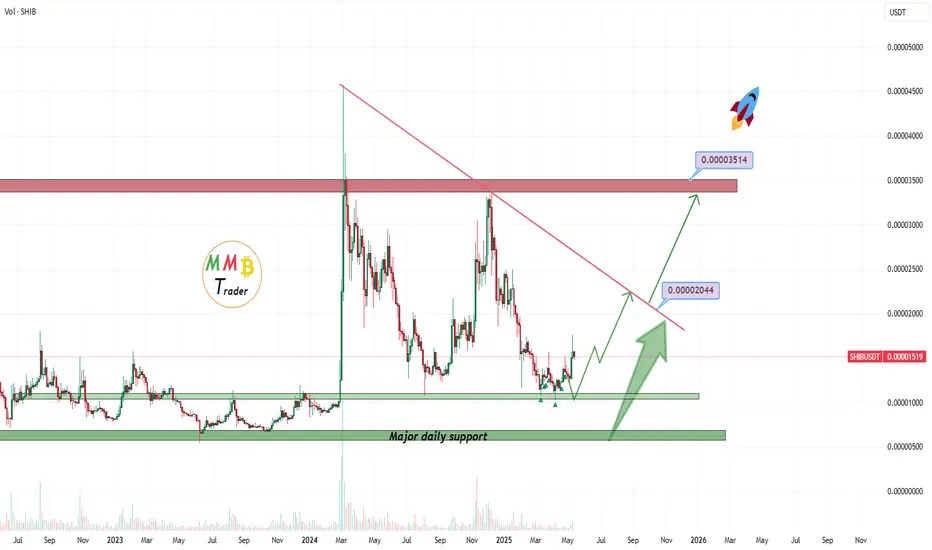
SHIBUSDT The pump is even not started yet(Get ready for more!!)As we can see price is still near major daily support zone also our first target is red trendline resistance and the real bull candles with high volume and good amount of pump will appear after that resistance break and we are waiting for this bull scenario.
DISCLAIMER: ((trade based on your own decision))
<<press like👍 if you enjoy💚
Short - NVDAPrice hits a strong resistance at $123, the purple line is the danger zone from the last tariff crash.
Trend: Expect a pull back short term before forming a higher low to enter to the upside.
Elliot Wave Strategy: Expect to finish wave 5.
Support line to enter put: $112
Put option expiration 5/23/25
PT 1:~109.50
PT 2: ~105.8

$SPY still bearish unless $584 and trendline break as resistanceI'll be the first to admit that the rally has gone further than I expected. That said, everything on the chart still looks like this is a bearish rally and not a new bull trend.
Unless we can break the blue trend line and the strong overhead resistance between $581.63 and $583.57, I think the most likely scenario is we fall further and see one last leg down before we bottom.
I think the bottom will come between the lower supports at $409 and $538.
Again, invalidation of the bearish idea is a break and flip of the resistances above, the upside targets are on the chart as well.
Let's see what happens over the coming weeks.

DeGRAM | EURUSD retest of the support level📊 Technical Analysis
● Price is testing the confluence of the blue corrective channel floor, the long‑term rising‑channel base and the 1.11 support, replicating April’s launch point.
● A close above the blue channel roof (~1.127) would confirm a break and target the mid‑channel 1.134 resistance, then the supply zone / upper rail near 1.140; bias is invalidated on a sustained close below 1.11.
💡 Fundamental Analysis
● US initial claims jumped to 252 k (5‑week high) while two FOMC voters signalled readiness to cut if labour softens, pressuring yields and the USD.
● ECB’s Lane said inflation is “on track” but emphasised data‑dependence beyond June, tempering easing expectations and underpinning euro rates.
✨ Summary
Channel‑base retest + weaker US data versus cautious ECB keep the short‑term long in play: objectives 1.134 → 1.140, cut if < 1.11.
-------------------
Share your opinion in the comments and support the idea with like. Thanks for your support!

EURUSD - Expecting Bearish Continuation In The Short TermH1 - Clean bearish trend with the price creating series of lower highs, lower lows.
Lower lows on the moving averages of the MACD indicator.
Expecting further continuation lower until the two Fibonacci resistance zones hold.
If you enjoy this idea, don’t forget to LIKE 👍, FOLLOW ✅, SHARE 🙌, and COMMENT ✍! Drop your thoughts and charts below to keep the discussion going. Your support helps keep this content free and reach more people! 🚀
--------------------------------------------------------------------------------------------------------------------
Disclosure: I am part of Trade Nation's Influencer program and receive a monthly fee for using their TradingView charts in my analysis.

GBPUSD's Potential Trend ChangeHi there,
GBPUSD currently shows bullish potential up to 1.34000, with 1.35113 open as a target, meaning the price could reach that level if the support area holds.
Potential bearish interest lies in a break below 1.32549, targeting the area around 1.29875. However, the price may drop further to 1.2800, with a bias toward 1.26000.
Happy Trading,
K.
Not a trading advice.

UnitedHealth Group | UNH | Long at $323.00UnitedHealth Group NYSE:UNH currently has a P/E near 15x, steady rising revenue (2024 = $400+ billion), EPS of 6.24x, dividend of 2.2%, and earnings are forecast to grow by 10.8% per year. The stock, however, has plummeted recently due to negative news, rising healthcare costs, CEO changes, and suspension of 2025 outlook. Every company has bumps, but I view solid companies like NYSE:UNH as pure opportunities for long-term investment - especially with America's aging population.
From a technical analysis perspective, the stock price has entered my "crash" simple moving average zone (which currently extends down near $307.00). Personally, this is the zone I am starting a position due to the odds of a future bounce from here. However, I am very aware that there is an open price gap near $265.00 that may get filled this year or early next. I could see a bounce in my crash zone to bring in the bulls and then a drop to that level to heighten the fear. That is another area I plan to grab more shares and build a strong position. But, in case it doesn't extend that low, I have started a position at $223.00, with future investments near $307.00 and below. I doubt this will be a quick turnaround stock - patience is where money is made.
Targets (into 2028):
$375.00
$475.00
$580.00

HolderStat┆SOLUSD fixed above the trend lineSOL spent March in a messy consolidation box before rotating into a disciplined rising channel that has marched price from 110 to the doorstep of 180. Bulls are now wrestling with that major horizontal barrier; acceptance above it would turn the former ceiling into fresh support and open the calculated channel extension toward 205. Until channel lows around 150 give way, trend traders may lean on pullbacks inside the lane to stay positioned with momentum. 🔥

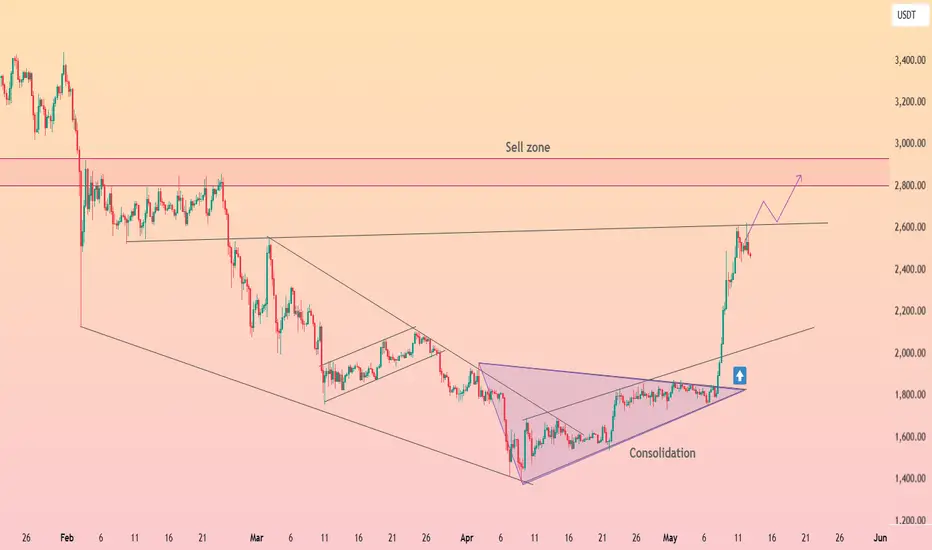
HolderStat┆ETHUSD retest $2500 After months locked inside a broad falling wedge, ETH erupted in early May, blasting through both the wedge roof and an internal consolidation triangle. The vertical thrust carried price from 1.8 k straight to 2.6 k, where a key horizontal lid now tests bulls’ resolve. Short‑term dips back toward the broken trendline or 2.2 k support would look constructive while momentum targets the well‑flagged 2.8‑3 k sell zone overhead. 🎯
SHORT ON EUR/JPYOANDA:EURJPY has created a double top with bearish divergence at a major supply zone.
I will be selling EJ to the next level of support/demand for over 200 pips.

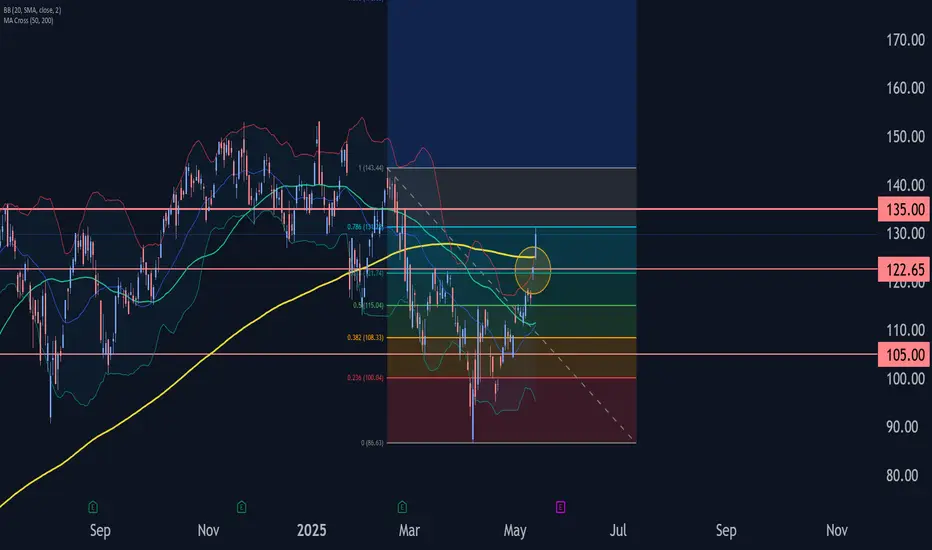
NVDA Wave Analysis – 13 May 2025
- Nvidia broke resistance area
- Likely to rise to resistance level 135.00
Nvidia recently broke the resistance area between the resistance level 122.65 (which reversed waves 4 and ii in March) and the 61.8% Fibonacci correction of the downward impulse from February.
The breakout of this resistance area continues the active short-term impulse wave 1 of the intermediate impulse wave (1) from the start of April.
Nvidia can be expected to rise to the next resistance level 135.00, target price for the completion of the active impulse wave i.
DeGRAM | GOLD trend line breakout📊 Technical Analysis
● Price printed successive lower highs (LH) inside the descending channel and has just broken back below the blue corrective trend‑line.
● Fresh acceptance under the 3 260 points to a slide toward the lower rail at 3 200, with scope to probe the March floor near 3 100; bias flips only on a 4 h close back above 3 300.
💡 Fundamental Analysis
● A hotter‑than‑expected US CPI (3.5 % y/y) lifted 10‑yr yields to 4.50 %, reviving bets that the Fed may delay cuts, which firmed the USD and spurred ETF outflows from bullion.
✨ Summary
Lower highs + rising US yields favour a short‑term short in XAU/USD: targets 3 200 → 3 100, risk managed above 3 300.
-------------------
Share your opinion in the comments and support the idea with a like. Thanks for your support!

SPX500 watch 5900 then 6103: Double Golden zone Was/Will be TOP?SPX500 with a ferocious recovery after tariff relief.
About to test a most important zone of its lifetime.
Double Golden zone of a Genesis plus a Covid pair.
Such a tight confluence of two major Goldens is rare.
It warned us of a top BEFORE Trump even won (click).
The retest could form a "Wave B" or "Bull Trap" lower high.
It is PROBABLE that we "Orbit" these high gravity objects for a while.
It is PLAUSIBLE that we "Blast" by them but have to retest soon after.
It is POSSIBLE that "wave B" ends here and we drop deep for "wave C".
I am personally a bull, but we should be PREPARED for a BULL TRAP.
==================
Previous Plots below
==================
5901 TOP warning:
5668 Tariff warning:
5100 Tariff Relief Entry:
===============================================
.

BTCUSD – Multi-TF Bearish SFP & Fib Retrace Before ATH Rebound
Bearish SFP printed on 4H / 8H / 12H / 1D at $103 345 – $104 985 after a parabolic ~$94 k → $104 k run and multiple rejections at $104 k–$106 k resistance.
Trump tariff-cut announcement sparked a sharp spike into resistance that was quickly sold off, confirming heavy supply at $104 k – $106 k.
Baseline plan: drop to 0.786 Fib ~$102 586, then 0.618 Fib ~$100 613, before a push toward the ATH ~$109 588.
Trade Setups
Short – SFP Breakdown
Trigger: 4H close below $103 345
Entry: ≈ $103 300 on retest
SL: $105 500 (above swing high)
TP1: 0.786 Fib ≈ $102 586 RR ≈ 0.7
TP2: 0.618 Fib ≈ $100 613 RR ≈ 2.6
Long – Fib Rebound
Trigger: Bullish reversal at 0.618 Fib / FVG cluster ≈ $100 613
SL: $99 300 (below FVG)
TP1: SFP top / range high ≈ $104 145 RR ≈ 2.7
TP2: ATH ≈ $109 588 RR ≈ 6.8

USDCAD Analysis: Three Bounce ScenariosHello traders!
USDCAD is offering three trading scenarios on the daily timeframe.
The first scenario suggests the pair may react bullishly from the currently approached zone, setting up a bounce opportunity that could drive price higher toward the 1.41600 area.
The second scenario anticipates a bounce toward the 1.37586 region, where a mean reversion setup may come into play (if buyers step in and price action confirms bullish intent near that support).
The third scenario anticipates a bounce toward the 1.34150 region, where a mean reversion setup may come into play (if buyers step in and price action confirms bullish intent near that support).
Discretionary Trading: Where Experience Becomes the Edge
Discretionary trading is all about making decisions based on what you see, what you feel, and what you've learned through experience. Unlike systematic strategies that rely on fixed rules or algorithms, discretionary traders use their judgment to read the market in real time. It's a skill that can't be rushed, because it's built on screen time, pattern recognition, and the ability to stay calm under pressure.
There's no shortcut here. You need to see enough market conditions, wins, and losses to build that intuition—the kind that tells you when to pull the trigger or sit on your hands. Charts might look the same, but context changes everything, and that's something only experience can teach you.
At the end of the day, discretionary trading is an art, refined over time, sharpened through mistakes, and driven by instinct. It's not for everyone, but for those who've put in the work, it can be a powerful way to trade.

CPI data market, buy gold!Fundamentals:
Focus on CPI;
Technical aspects:
As expected in my previous article, gold has rebounded to the area around 3250-3260 as expected.According to the current structure, gold tends to fluctuate upward in the short term; it may even extend to the 3280-3290 area.Gold rebounded after touching 3207, and combined with the secondary low point near 3215 to form a "W" structure. This technical structure has formed a strong support structure for gold prices; and after the bad news is exhausted, the on-site wait-and-see funds will gradually enter the market, which will also push up the gold price to a certain extent. So I think gold still has the conditions to challenge the 3280-3290 area!
Trading strategy:
Consider starting to go long on gold in batches in the 3250-3240 area, target price: 3270-3280
