ASX to find sellers at market price?ASX200 - 24h expiry
Daily signals are bearish.
Daily signals for sentiment are at oversold extremes.
The lack of interest is a concern for bulls.
Offers ample risk/reward to sell at the market.
20 1day EMA is at 7766.
We look to Sell at 7785 (stop at 7905)
Our profit targets will be 7435 and 7365
Resistance: 7817 / 7865 / 7987
Support: 7716 / 7600 / 7500
Risk Disclaimer
The trade ideas beyond this page are for informational purposes only and do not constitute investment advice or a solicitation to trade. This information is provided by Signal Centre, a third-party unaffiliated with OANDA, and is intended for general circulation only. OANDA does not guarantee the accuracy of this information and assumes no responsibilities for the information provided by the third party. The information does not take into account the specific investment objectives, financial situation, or particular needs of any particular person. You should take into account your specific investment objectives, financial situation, and particular needs before making a commitment to trade, including seeking advice from an independent financial adviser regarding the suitability of the investment, under a separate engagement, as you deem fit.
You accept that you assume all risks in independently viewing the contents and selecting a chosen strategy.
Where the research is distributed in Singapore to a person who is not an Accredited Investor, Expert Investor or an Institutional Investor, Oanda Asia Pacific Pte Ltd (“OAP“) accepts legal responsibility for the contents of the report to such persons only to the extent required by law. Singapore customers should contact OAP at 6579 8289 for matters arising from, or in connection with, the information/research distributed.
Support and Resistance

FILUSDTFIL is showing signs of a potential trend reversal 📊
Price has formed a higher low and is now approaching the key resistance at 2.485 USDT. A breakout above this level could open the way toward the next major zones around 2.887 and even 3.189 USDT 🚀
However, if rejection occurs, we might see a pullback toward the 2.272 USDT support area 🔁
Currently, momentum is leaning bullish and favoring a move higher, especially if the descending trendline gets broken with strength 💪

Celanese Corp | CE | Long at $39.64Celanese Corp is another chemical company (like Dow Inc) crushed by tariffs and economic headwinds. It's dropped -78% in one year.... However, this is a very strong company with strong credit market interest and no immediate liquidity crisis. From a technical analysis perspective, this... like in 2008 and 2020... is the time to gather shares given it has reached the "abysmal crash" levels based on my selected simple moving averages. In the past, recovery to new highs has taken 1-2 years. History doesn't always repeat, but fear is opportunity in the stock market. If negative news continues to reign, a dip into the high $20's isn't out of the question.
If the company can squeak through 2025 and not continue to stack debt (debt/equity=2.43x), the growth opportunity into 2027-2028 looks promising.
I'm keeping my targets into 2026 low, but this could be a good buy and hold for the right investor.
Targets:
$47.00
$54.75

EURCAD Wave Analysis – 17 April 2025- EURCAD reversed from long-term resistance level 1.5840
- Likely to fall to support level 1.5400
EURCAD currency pair recently reversed down from the long-term resistance level 1.5840 (which has been reversing the price from the start of 2020) standing close to the upper daily Bollinger Band and the resistance trendline of the weekly up channel from 2022.
This is the 3rd consecutive failure to break above the major resistance level 1.5840 by this currency pair from the start of this year.
Given the strength of the resistance level 1.5840, overbought weekly Stochastic and the bullish Canadian dollar sentiment seen today, EURCAD currency pair can be expected to fall to the next support level 1.5400.

Will gold still rise after correction? Market analysis referenceAnalysis of gold market trend:
Technical analysis of gold: Today in the Asian session, gold directly rushed to the 3357 line, continuing the previous upward trend. The spot gold price in the Asian session has once again hit a record high, breaking through $3350 for the first time. The US dollar index fell close to a three-year low, triggering a sharp rise in market risk aversion, pushing up gold prices. The current basic trend of gold rising has not changed, and the bulls are strong. However, from the perspective of time nodes, even if you are bullish today, you must pay attention to the adjustment space at any time. The Asian session hit a high and fell back, and the European session did not continue to rise but fluctuated and fell. Attention should be paid to the second bottoming out in the evening. In addition, the market will be closed tomorrow, Friday, and will not open normally until next Monday; therefore, today, Thursday, we must do a good job of risk prevention; such as short positions, such as adjusting positions, and so on.
In the short term, gold is now likely to start a large range of fluctuations again. The 1-hour inverted V trend has begun. Gold will either start a large range of fluctuations or make adjustments. If there is no support from bullish news in the short term, then the short-term gold bulls may be suppressed. Due to the rest tomorrow, do less and wait and see. Gold will be operated next week in combination with the news over the weekend. The recent market has been ups and downs, and I can finally take a good rest for three days to relax the tense atmosphere. The recent ups and downs of gold are like an electrocardiogram, which affects the hearts of everyone who pays attention to gold. It is mainly too active. Maybe you drink a sip of tea and smoke a cigarette, and gold goes back and forth for more than ten US dollars. So, don't be too bullish today. If you are bold, go short, and if you are prudent, just watch the show! Overall, today's short-term operation strategy for gold is mainly to go short on rebounds, and to go long on pullbacks. The short-term focus on the upper side is 3315-3320 resistance, and the short-term focus on the lower side is 3245-3285 support. Friends must keep up with the rhythm.
Gold operation strategy reference: short gold rebounds near 3315-3320, target near 3295-3285, and look at the 3245 line if it breaks.
Strategy 2: Go long on gold pullbacks near 3280-3285, target near 3305-3315, and look at the 3320 line if it breaks.

CADJPY Wave Analysis – 17 April 2025
- CADJPY reversed from key support level 102.00
- Likely to rise to the resistance level 104.00
CADJPY currency pair recently reversed up from the key support level 102.00 (which has been reversing the price since August of 2024) standing close to the lower daily Bollinger Band.
The upward reversal from this support level is likely to form the weekly daily candlesticks reversal pattern Morning Star – a strong buy signal for CADJPY.
Given the strength of the support level 102.00, the CADJPY currency pair can be expected to rise to the next resistance level 104.00.

USDT DOMINANCE UPDATE: What to Expect Next? USDT Dominance is currently heading toward a key demand zone between 5.33 and 5.16, which could act as a strong support area. From this zone, we might witness a short-term bounce or upward movement. This could temporarily cause corrections in both Bitcoin and altcoins, so don't be alarmed—this is a healthy part of market behavior.
After a possible slight move upward, USDT dominance may go sideways for a while, showing some consolidation. But here’s the important part: this move is likely the beginning of its next downtrend. And when USDT dominance starts falling, it typically signals the start of an uptrend for Bitcoin and the overall crypto market.
So, stay calm and stay prepared. I'm sharing this so the market doesn’t catch you by surprise. Because you’re following me, I’ll make sure you stay ahead of the moves with timely updates.
Everything will be fine—this is just part of the cycle.

ONDO/USDTThe coin has a globally bullish structure. I highlighted the area after the liquidity was removed where one can consider buying the coin.
Targets for growth:
Target 1 = 0.9277
Target 2 = 0.9570
Target 3 = 1.0508

PEPE : WHAT WE WANT?Hello friends
Given the good price growth, we see that we had a correction, which we found the support area using Fibonacci, and the price has returned from that area by buyers and is now in an ascending channel, which we expect to move to the specified targets.
Trade safely with us

ETH: NEW UPDATEHello friends
Given the price decline we had and the lower lows that the price made in a support area, you can see that buyers entered and broke the downtrend and made higher lows, which is expected to move the price to the specified targets.
*Trade safely with us*

GOLD: What happened?Hello friends
The trend is very bullish and given the recent events in the world, the possibility of a decline is decreasing, so we can buy in pullbacks that the price is making in steps and with capital management and risk, price targets have also been specified.
*Trade safely with us*

ETHUSDTHey guys....
sharing ideas is fun for me... here is my ETHUSDT setup for you guys..Expecting a decent pump from this support zone to the resistance which is 1935.

XRP/USDT(UPDATE)Hello friends
Given the price growth we had, we can enter into transactions within the specified limits with capital and risk management and move towards the specified goals.
*Trade safely with us*

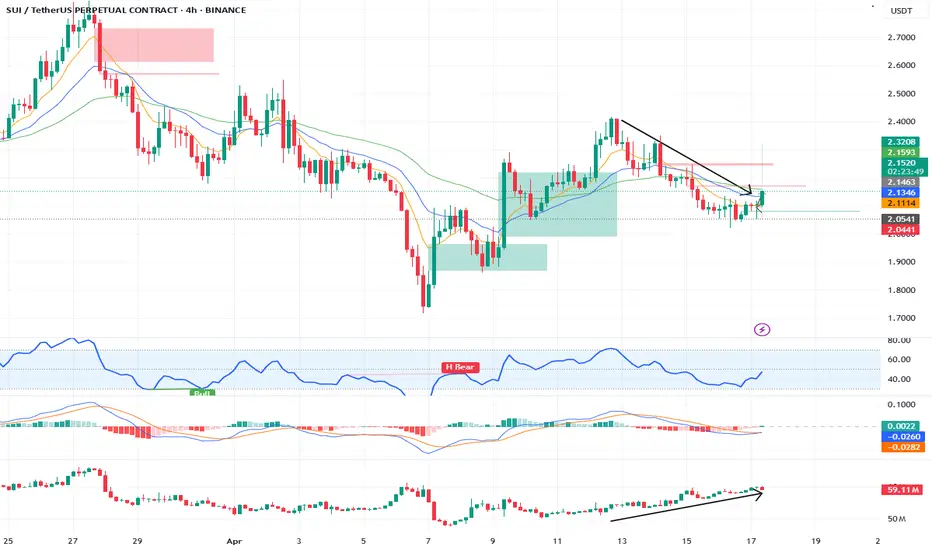
Long setup on SUISetting up long for SUI.
Using 4H time frame.
You can see OI increasing and Price decreasing which is divergence.
LTC/USDT:BUYHello friends
Due to the good price growth, we see that the price has hit a lower ceiling and has fallen, which we can buy in stages during the price decline, within the specified ranges and move with it to the specified targets.
Observe capital and risk management.
*Trade safely with us*

APT/USDT:BUYHello friends
Given the good price growth, we see that the price is in an ascending channel and has fallen, we can buy in a stepwise manner in the price decline within the specified ranges and move with it to the specified targets.
Observe capital and risk management.
*Trade safely with us*

AVAX/USDT:BUYHello friends
Given the good price growth, we see that the price has not managed to reach a higher ceiling and has fallen, so we can buy in stages during the price decline within the specified ranges and move with it to the specified targets.
Observe capital and risk management.
*Trade safely with us*

GBPUSD:SIGNALHello friends
Given the good growth we had, we can buy within the specified support ranges with capital and risk management because buyers reacted well after the price correction and this could be the beginning of a good growth.
*Trade safely with us*

nifty 24000-23400nifty 24000-23400
The Nifty 50 has been showing strong bullish momentum, reclaiming its previous swing high and closing at a three-and-a-half-month high

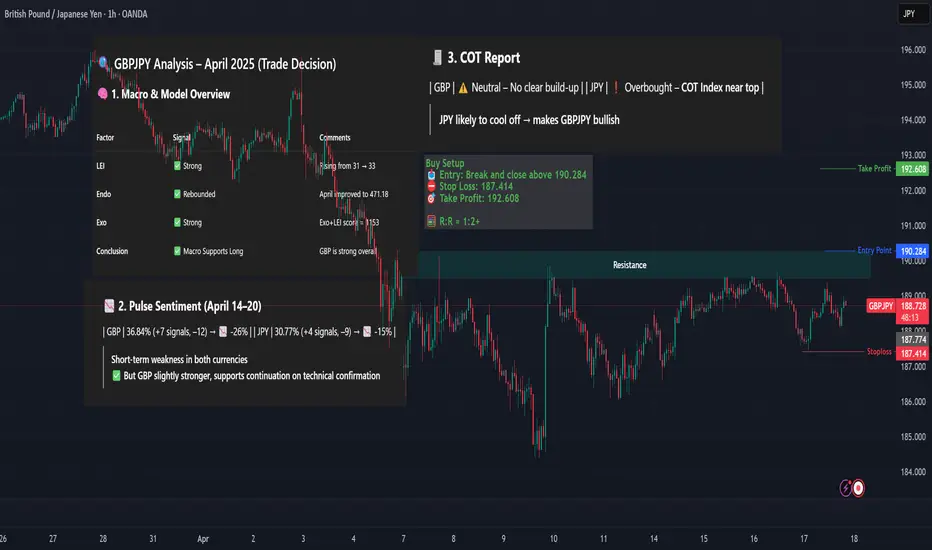
GBPJPY – Breakout Buy Setup (Macro Alignment)GBPJPY long setup backed by rising LEI, strong macro trend, JPY weakness, and bullish seasonal window approaching after April 24.
Waiting for breakout confirmation above resistance to validate entry.
🧠 Macro + Model Alignment
LEI score rising → 33 (April), macro outlook improving
Exo+LEI = 1153 → strong bullish signal
JPY COT: Overbought → reversal risk
GBP fundamentals outperform JPY across April
Seasonality: GBP bearish till April 24, then bullish into month-end
📌 Best entry window = April 25+
📊 Technical Setup – 1H Chart
Price testing key resistance zone ~190.00
Watching for breakout & candle close above resistance for confirmation
Clear R:R with defined structure zones
📥 Entry: Break and close above 190.284
⛔ Stop Loss: 187.414
🎯 Take Profit: 192.608
🧮 R:R ≈ 1:2+
Confirmation required before entry ✅
Short NEAR/USDT🔥 #NEAR/USDT
🔴 SHORT
🎲 Entry Zone 1: 2.076
🎲 Entry Zone 2: 2.097
✅ Take Profit 1: 2.038
✅ Take Profit 2: 1.987
✅ Take Profit 3: 1.921
✅ Take Profit 4: 1.850
✅ Take Profit 5: 1.737
(Extended if Momentum Persists)
❌ Stop Loss: Above 2.190
💱 Recommended Margin: 2.5% – 5%
🧳 Recommended Leverage: 5X – 15X
🧠 Narrative: NEAR is testing a supply zone at 2.076 – 2.097. A rejection here could spark downside toward the listed TP levels as sellers regain control.
📈 Market Context: Keep an eye on overall crypto sentiment and BTC’s trend; a broad market rally could negate this short bias, while renewed weakness may accelerate the move.
⚠️ Risk Management: Place stops above 2.190, size positions carefully, and stay alert for unexpected strength.
⚠️ Take Care of Risk Management for Your Account

Short ALGO/USDT🔥 #ALGO/USDT
🔴 SHORT
🎲 Entry Zone 1: 0.1870
🎲 Entry Zone 2: 0.1890
✅ Take Profit 1: 0.1838
✅ Take Profit 2: 0.1775
✅ Take Profit 3: 0.1667
✅ Take Profit 4: 0.1551
(Extended if Momentum Persists)
❌ Stop Loss: Above 0.1985
💱 Recommended Margin: 2.5% – 5%
🧳 Recommended Leverage: 5X – 15X
🧠 Narrative: ALGO is testing a supply zone at 0.1870 – 0.1890. A rejection here could trigger a move toward the lower support levels identified as TPs.
📈 Market Context: Monitor overall crypto sentiment and BTC action; a broad rally may invalidate this short bias, while continued weakness could accelerate downside targets.
⚠️ Risk Management: Place stops above 0.1985, size positions carefully, and be ready to adapt if price shows unexpected strength.
⚠️ Take Care of Risk Management for Your Account

Dow jones 38500?Dow jones 38500?
The Dow Jones Industrial Average (DJIA) has been experiencing volatility recently, influenced by factors such as weak earnings reports and global economic concerns. The index fell 507 points (1.3%) in its latest session, primarily due to a sharp decline in UnitedHealth shares following an earnings miss

NDX Nasdaq *2025* Bear MarketCalled it too early. Trump pump is over. Now back on track. See you at $14K.
