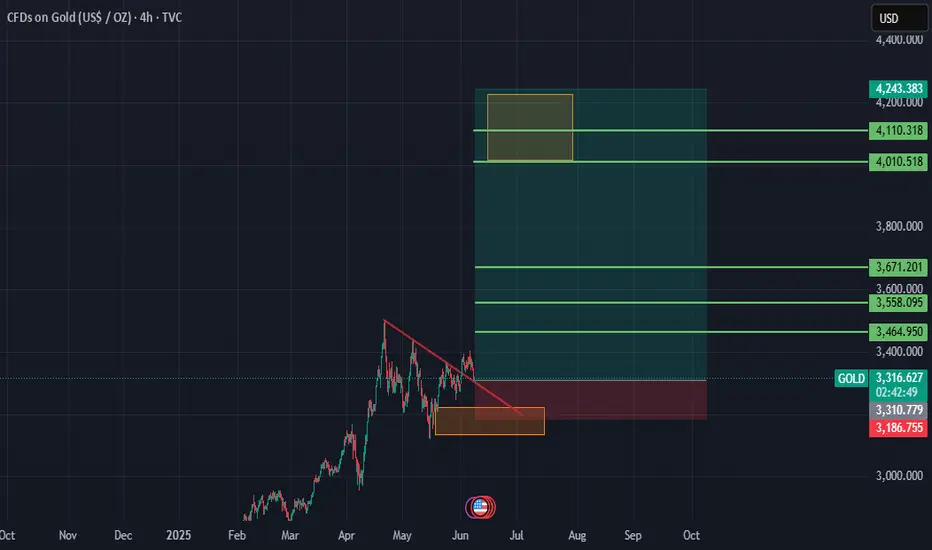
Why I Think Gold Will Continue Buying...Technical AnalysisHey Rich Friends,
Happy Monday! I think Gold will continue to buy today and maybe this week. This is only my technical analysis so make sure to check the news and cross-reference any indicators you have on your charts.
- The candles have crossed and closed above the previous high on H1 and H4 showing bullish momentum.
- After the break of the previous high, H1 was resistance has been retested as support confirming bullish momentum.
- The stochastic is facing up, the fast line (blue) is above the orange line (slow) and 1 or both lines have crossed above the 80% line. These are bullish confirmations for me.
Additional information:
- Wait for the current candle to close for more bullish confirmation.
- I would set buy stops/TPS to 3400. I will be using previous highs as TPs and previous lows as SL.
Only enter this trade if it make sense to you.
Peace and Profits,
Cha
Support and Resistance

soluusd for short *The content on this analysis is subject to change at any time without notice, and is provided for the sole purpose of assisting traders to make independent investment decisions.

TSM eyes on $194: Major Resistance to Break-n-Run or Dip-to-Buy TSM has been recovering with the chip sector.
Currently testing a Major Resistance zone.
Look for a Dip-to-Buy or Break-n-Retest entry.
$193.92-195.18 is the exact zone of concern.
$177.83-178.31 is the first major support.
$203.68-204.56 is the first resistance above.
========================================
.

Gold rises and then falls, short at 3330📰 Impact of news:
1. Geopolitical situation
2. Impact of the US dollar trend on gold
📈 Market analysis:
Gold rebounded again after falling to 3301, but the upper 3330-3340 line still has strong suppression on gold. Judging from the current trend, because the gold price has risen in the short term and returned to the 3325-3327 line, the short-term resistance is still 3330-3335 and it is expected to fall under pressure. Look for the 3315-3310 position. If it falls below this support, look down to the 3300-3290 line.
🏅 Trading strategies:
SELL 3330-3340
TP 3315-3310-3300
If you agree with this view, or have a better idea, please leave a message in the comment area. I look forward to hearing different voices.
OANDA:XAUUSD FX:XAUUSD FOREXCOM:XAUUSD FXOPEN:XAUUSD TVC:GOLD

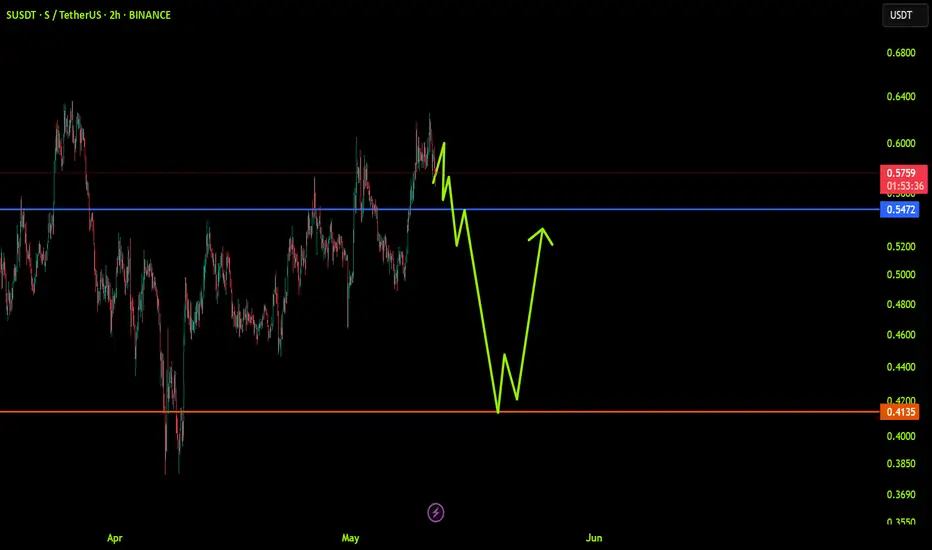
SUSDT: trend in 2H time framesThe color levels are very accurate levels of support and resistance in different time frames, and we have to wait for their reaction in these areas.
So, Please pay special attention to the very accurate trend, colored levels, and you must know that SETUP is very sensitive.
Be careful
BEST
MT

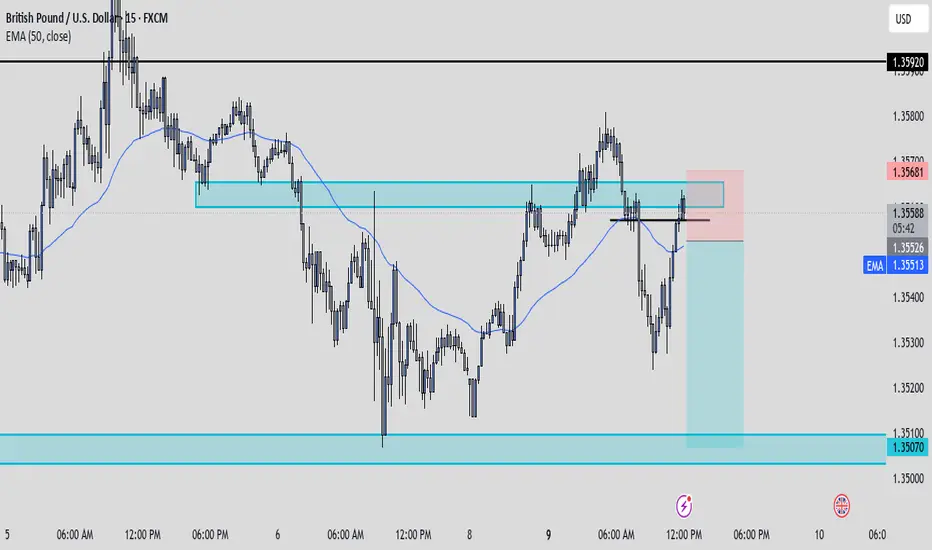
GbpUsdWith GU currently ranging between 2 solid levels and being bearish on the higher time frame I'll personally be shorting the pair. Price on smaller time frames also gave us a clean market shift back below the resistance while being in sync with the higher time frame. If price can close with a bearish candle below the retest then I'll be executing shorts on this pair for a 1:3rr. If all goes well we could expect price to tap back into support below being 1.35100. We'll see what happens.
short audcad*The content on this analysis is subject to change at any time without notice, and is provided for the sole purpose of assisting traders to make independent investment decisions.

DeGRAM | GOLD forming the ascending wedge📊 Technical Analysis
● Price is coiling inside an ascending flag that is riding the new support line at 3 342; flag range compression after each pull-back signals energy for a thrust.
● The pattern sits above the old channel roof, turning the former resistance into a launch pad; measured move of the flag points to the next confluence at 3 435.
💡 Fundamental Analysis
● US jobless claims ticked up while 10-yr yields slipped under 4.30 %; lower carry costs and renewed Chinese reserve buying reported by Reuters keep dip-buyers active in bullion.
✨ Summary
Buy 3 330-3 350; flag break targets 3 435, stretch 3 500. Invalidate on a 4 h close < 3 245.
-------------------
Share your opinion in the comments and support the idea with a like. Thanks for your support!

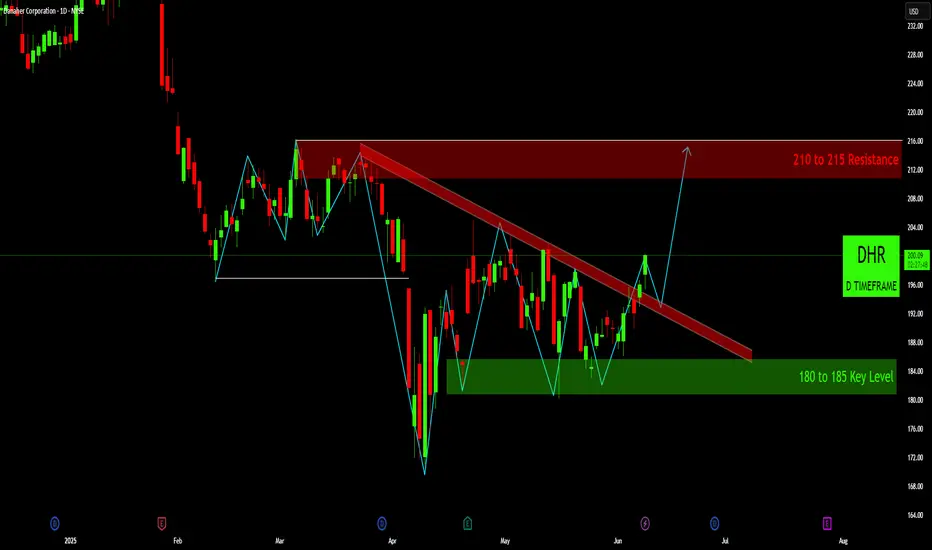
DHR: Bullish Breakout from Descending TrendlineOverview: Danaher Corporation (DHR) on the daily chart appears to have undergone a significant bearish pattern followed by a period of consolidation. The recent price action suggests a potential bullish reversal, as the stock has now broken above a key descending trendline, signaling a shift in momentum.
Context & Price History:
Prior Topping Pattern: From roughly February to April, DHR exhibited classic signs of a topping formation. The price repeatedly failed to break above the 210 to 215 Resistance zone (red shaded area), indicating strong supply in this region. The price action leading to the sharp April decline could be interpreted as a Head and Shoulders pattern or a triple top, with the white horizontal line around 196- 197 acting as a critical "neckline" or support level.
Sharp Decline & Key Support: Following the breakdown from the neckline in April, DHR experienced a significant sell-off, finding strong demand and bottoming out within the 180 to 185 Key Level support zone (green shaded area). This zone has proven to be a robust area of buyer interest.
Consolidation & Descending Trend: Since the April lows, DHR has been trading within a range, largely constrained by a descending trendline (thick red diagonal line) acting as dynamic resistance, while finding support at the 180-185 key level. This price action formed a descending triangle or wedge-like pattern.
Key Levels & Patterns:
Major Resistance (210 to 215): A strong supply zone where sellers have repeatedly stepped in. This will be the primary upside target if the current bullish momentum sustains.
Key Support (180 to 185): A critical demand zone that has held up well, providing a strong foundation for the recent recovery.
Descending Trendline (Red): This dynamic resistance has capped rallies since March/April. A decisive break above it is a bullish signal.
Pivotal Level (~196-197, White Line): This level acted as prior support (neckline) before the April drop. Now, it serves as a minor horizontal resistance that the price has recently overcome, potentially flipping to support on a retest.
Current Situation (As of Analysis):
DHR is currently trading around $200. Critically, the price has made a strong move above the long-standing descending trendline. This breakout suggests that bullish sentiment is gaining control after a prolonged period of consolidation.
Potential Scenarios:
Bullish Continuation (Primary Indication on Chart):
Confirmation: The chart's projection anticipates a retest of the broken descending trendline (which now acts as support) or the ~
196=197 pivotal level, followed by a bounce and continuation higher.
First Target: Upon a successful retest and bounce, the immediate target for buyers would be the 210 to 215 Resistance zone.
Why: A confirmed breakout from a multi-month descending trendline, especially after holding strong key support, is a strong bullish reversal signal.
Bearish Rejection / Fakeout:
Confirmation: If DHR fails to hold above the broken descending trendline and closes convincingly back below it (and potentially below the ~196-197 level), it would suggest that the breakout was a "fakeout."
Downside Potential: In such a scenario, the price could re-enter the consolidation range and potentially retest the 180 to 185 Key Level.
Confirmation & Invalidations:
Bullish Confirmation: A successful retest of the descending trendline (now support) with a clear bounce, or a sustained daily close above the ~196-197 level, preferably with increasing volume.
Invalidation of Bullish Setup: A decisive daily close back below the descending trendline and the ~ 196-197 pivotal level would suggest that the bullish momentum has faltered and the current breakout might be false.
Conclusion:
DHR has presented a compelling technical setup with a breakout from a significant descending trendline. This breakout, combined with the stock holding firm at the 180-185 key support, suggests a potential shift in trend from bearish consolidation to a renewed bullish advance. Traders should look for confirmation of the breakout (e.g., a successful retest and bounce) before targeting the 210-215 resistance zone.
Disclaimer:
The information provided in this chart is for educational and informational purposes only and should not be considered as investment advice. Trading and investing involve substantial risk and are not suitable for every investor. You should carefully consider your financial situation and consult with a financial advisor before making any investment decisions. The creator of this chart does not guarantee any specific outcome or profit and is not responsible for any losses incurred as a result of using this information. Past performance is not indicative of future results. Use this information at your own risk. This chart has been created for my own improvement in Trading and Investment Analysis. Please do your own analysis before any investments.
SPX 500 to 17,000 in 7 years.This chart represents the S&P 500, showcasing its performance over time, including quarterly data.
It captures everything.
Every recession.
Every war.
Every president.
Every variation of the monetary base as superpowers rise and fall.
Whenever I hear a bear in the stock market declare that THE TOP has been reached, and we are about to CRASH -50% to -90%
I find myself drawn to these comprehensive long term charts.
If the bulls are genuinely in control and we have merely undergone an intermediate-term correction, then the long-term bull market that commenced at the 2009 low remains robust, with many more years ahead.
The chart also illustrates that the three significant bull market phases typically last around 18-20 years following a major breakout.
And they yield a comparable number of X's.
It's all quite fascinating, if you ask me.
See you in the future!

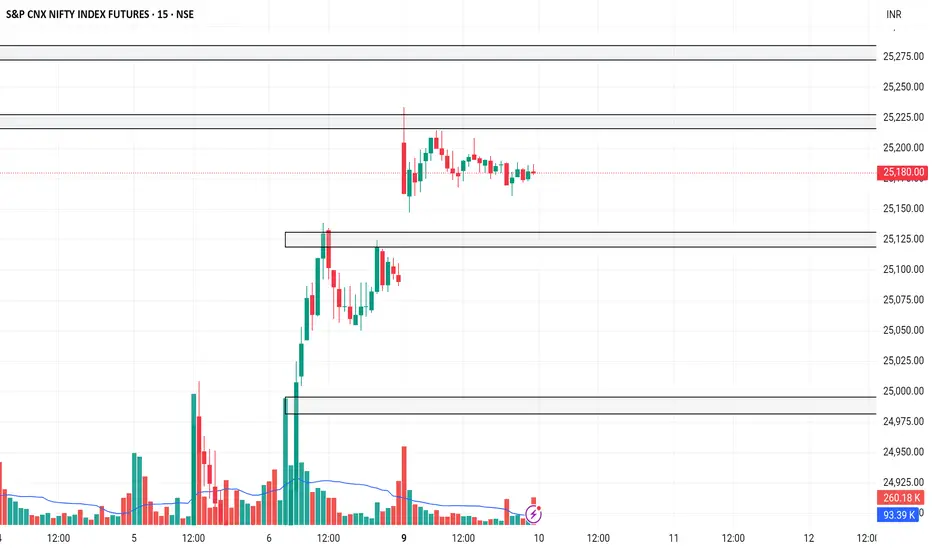
NIFTYNifty levels are based on imbalances
1. gapup 25220 long
2. 25220-25120 trade bfeakout
3. gapdown q25120 shorrt
MU eyes on $95/97: Double Golden fib zone Ultra-High GravityMU looking to exit a Double Golden zone $95.33-97.23
Break could pop to next resistance zone $109.41-111.38
Expecting some orbits around this ultra high gravity zone.
.
Previous Plot that caught the bottom EXACTLY:
==================================================
.

PEP – Bullish Divergence at Weekly DemandPepsiCo (PEP) has retraced into a key weekly demand zone, where price previously launched long bullish legs. At the same time, a bullish divergence is forming between price and RSI, suggesting selling momentum may be weakening.
Structure has clearly shifted bearish over the past two years, with multiple breaks of structure (BoS). However, the current setup shows strong confluence for a potential mean reversion or reversal swing.
Two key supply zones are mapped:
First target (5:1 R:R) at the $141 area — recent supply.
Second target (12:1 R:R) near $162 — major macro supply.

Gold is in the Bearish DirectionHello Traders
In This Chart GOLD HOURLY Forex Forecast By FOREX PLANET
today Gold analysis 👆
🟢This Chart includes_ (GOLD market update)
🟢What is The Next Opportunity on GOLD Market
🟢how to Enter to the Valid Entry With Assurance Profit
This CHART is For Trader's that Want to Improve Their Technical Analysis Skills and Their Trading By Understanding How To Analyze The Market Using Multiple Timeframes and Understanding The Bigger Picture on the Charts

GBPNZD: Breakout & Bearish Continuation📉GBPNZD pair formed a distinct descending triangle pattern on the 4-hour time frame.
Breaking below its neckline is a significant bearish indicator, suggesting a strong likelihood of a further decline.
The next support level is at 2.2200.

XLMUSDT Eyes on $0.3109: Breakout Zone Could Ignite Rapid ClimbXLMUSDT is currently forming a bullish reversal structure on the 4-hour chart. After a prolonged downtrend, price has established a support base around the $0.2570 level. This zone has acted as a key support, rejecting downside attempts multiple times, and creating a potential accumulation floor.
The price is now pushing above short-term consolidation, hinting at a possible breakout from the recent range. This range behavior, followed by an early higher low formation, indicates that buyers may be stepping in more aggressively.
Support Zone
The support zone around $0.2570 to $0.2585 is structurally significant. Price dipped into this level twice and was strongly rejected both times. The most recent low around this zone created a long wick, suggesting liquidity grab and potential trend reversal.
This zone now serves as a clear invalidation point for the bullish setup. A break below would likely invalidate the long bias and open the door for a deeper retracement.
Resistance Levels and Take-Profit Targets
The chart identifies two major resistance levels.
The first resistance is around $0.2902, marking Take Profit 1 (TP1). This level acted as resistance multiple times in the past and should be the first area where selling pressure could return.
The second resistance, marked at $0.3109 (TP2), is a higher timeframe resistance zone. It was previously a strong ceiling before the drop in early June. If the momentum is sustained, this area becomes a logical final target for the current bullish swing.
Supertrend Confirmation
The Supertrend indicator has recently flipped green, supporting the bullish bias. The flip occurred after price reclaimed the mid-range, and the price is now consolidating just above the Supertrend baseline.
This is a classic bullish signal on the 4H chart, particularly when it aligns with a structural bottoming pattern and a clean risk-reward setup.
Risk–Reward Setup
The current setup offers a favorable risk-to-reward ratio of 2.49. Entry is positioned near $0.2723, with the stop-loss placed just below the support zone at $0.2570. This limits downside risk to approximately 5.6%.
The upside, on the other hand, stretches up to $0.3109, offering potential gains of around 14%. Even the first target at $0.2902 offers a decent 6.5% return, making this trade attractive for swing traders aiming for a mid-term move.
Momentum Shift and Potential Breakout
What strengthens the bullish case further is the price action attempting to break out of the recent lower high zone. There is a clear effort to reclaim momentum, and a successful 4H candle close above $0.2770 would signal a clean breakout and continuation.
Earlier price action shows signs of accumulation, including a liquidity sweep below $0.2570 followed by strong rejection — a common reversal pattern in crypto markets.

USDJPY InsightHello to all our subscribers!
Please feel free to share your personal thoughts in the comments. Don’t forget to hit the boost button and subscribe!
Key Points
- The Bank of Japan has decided to maintain its policy of reducing government bond purchases beyond April next year. It is expected to officially announce the extension of its bond-buying plan during the Monetary Policy Meeting scheduled for June 16–17.
- The United States and China concluded the first day of trade talks in London. U.S. Treasury Secretary Scott Besant described the talks as “positive,” while Commerce Secretary Howard Lutnick said they were “productive.”
- According to the New York Federal Reserve, 1-year inflation expectations fell by 0.4% to 3.2% from the previous month. Expectations for 3-year and 5-year inflation also showed signs of easing, further fueling hopes of interest rate cuts.
Key Economic Events This Week
+ June 11: U.S. May Consumer Price Index (CPI)
+ June 12: U.K. April GDP, U.S. May Producer Price Index (PPI)
+ June 13: Germany May Consumer Price Index (CPI)
USDJPY Chart Analysis
The 142 level has consistently provided strong support, and the pair has since climbed to the upper range around 144. However, resistance near the 146 level remains, making it difficult to confirm a full bullish trend. While we may anticipate a potential rise toward the 149 level, we’ll be keeping a close watch on how the price behaves around 146.

Solana Wave Analysis – 9 June 2025
Solana: ⬆️ Buy
- Solana reversed from the support zone
- Likely to rise to the resistance level 163.80
Solana cryptocurrency recently reversed up from the support zone between the key support level 141.65 (which has been reversing the price from April), lower daily Bollinger Band and the 50% Fibonacci correction of the upward impulse (1) from April.
The upward reversal from this support zone created the daily Japanese candlesticks reversal pattern, the Piercing Line.
Given the improved sentiment across the cryptocurrency markets, Solana can be expected to rise to the next resistance level 163.80 (top of the previous wave B).

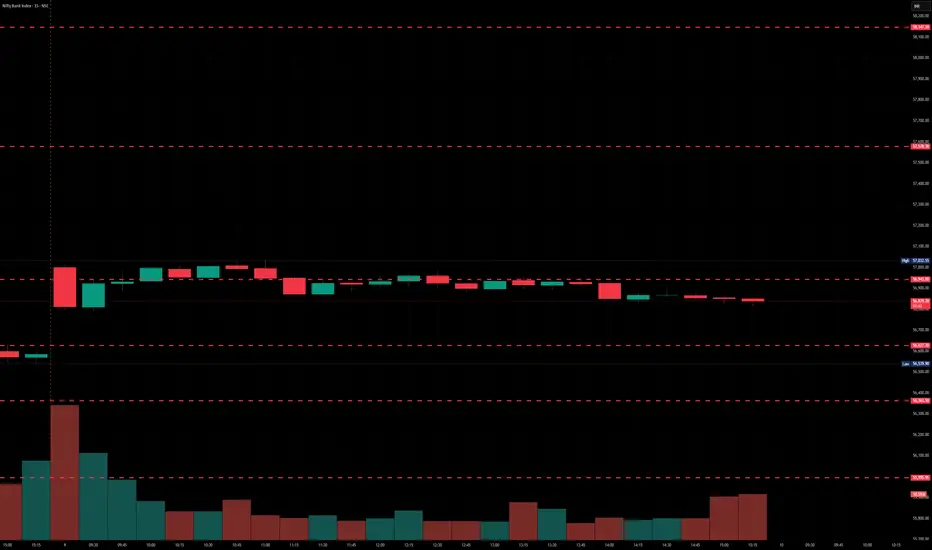
Nifty Analysis EOD – June 9, 2025 – Monday🟢 Nifty Analysis EOD – June 9, 2025 – Monday 🔴
🎯 Stuck at the Top – Expansion Coming Soon?
Nifty opened with a strong Gap-Up of 127 points at 25,127, landing right at the upper resistance cap. But from the very first candle, it was clear that the market was unsure—price action showed indecision, and the index could barely add another 16 points before hitting the day’s high of 25,143.45.
From there, the index retraced about 66 points, marking a low at 25,077.15, before attempting a gradual recovery toward the high. But that breakout attempt was unsuccessful, and Nifty drifted back to the mean and closed the day at 25,103.20—essentially wrapping the entire session within a tight 65-point range.
Buyers fought hard to defend 25,100, while sellers tried to fill the morning gap. The narrow range and mean reversion hint at consolidation, setting the stage for a possible expansion in the coming sessions. Stay patient—the coil is tightening.
🛡 5 Min Chart with Levels
🕯 Daily Time Frame Chart
🕯 Daily Candle Breakdown
Open: 25,160.10
High: 25,160.10
Low: 25,077.15
Close: 25,103.20
Net Change: +100.15 (+0.40%)
📊 Candle Structure Breakdown
Real Body: 56.90 pts → 🔴 Red candle (Close < Open)
Upper Wick: 0 pts (Open = High)
Lower Wick: 26.05 pts
🔍 Interpretation
Price opened at the high and failed to push any higher – showing no strength above the open.
Despite a positive close versus the previous session, the candle is bearish intraday.
The lower wick shows some support, but not enough to flip the bias.
🔦 Candle Type
🟥 Red Inverted Hammer / Bearish Pin Bar– Typically signals weakness or potential reversal, especially when forming near resistance zones.
📌 Key Insight
The structure shows exhaustion or profit booking.
A move below 25,077 could open the door to further downside.
However, holding above 25,100–25,130 will keep bullish hopes alive.
🛡 5 Min Intraday Chart
⚔️ Gladiator Strategy Update
ATR: 262.59
IB Range: 66.3 → Small IB
Market Structure: imBalanced
Trades:❌ No Trade Triggered by the system
📌 Support & Resistance Zones
Resistance Levels
25,116 ~ 25,128
25,180 ~ 25,212
25,285
Support Levels
25,062 ~ 25,070
24,972
24,920 ~ 24,894
24,800 ~ 24,768
💭 Final Thoughts
Today was a pause, not a pullback—yet.With price compressed in a tight band, volatility expansion is likely ahead.
🧠 “Markets don't stay quiet for long. Silence often precedes a scream—watch which direction the breakout takes.”
✏️ Disclaimer
This is just my personal viewpoint. Always consult your financial advisor before taking any action.

S&P 500 Index (SPX) Weekly TF – 2025
Chart Context:
Tools Used: 3 Fibonacci Tools:
1. One **Fibonacci retracement** (from ATH to bottom)
2. Two **Trend-Based Fibonacci Extensions**
* Key Levels and Zones:
* **Support Zone** (Fib Confluence): \~4,820–5,100
* **Support Area (shallow pullback)**: \~5,500–5,600
* **Resistance & TP Zones:**
* TP1: **6,450** (Fib confluence & -61.8%)
* TP2: **6,840** (-27%)
* TP3: **7,450–7,760** (Major Confluence)
Technical Observations:
* SPX is approaching a **critical resistance** near previous ATH (\~6,128) with projected upward trajectory.
* The **green dashed path** suggests a rally continuation from current \~6,000 levels to TP1 (\~6,450), TP2 (\~6,840), and eventually TP3 (\~7,450–7,760), IF no major macro shock hits.
* The **purple dotted path** suggests a potential retracement first to \~5,600 (shallow correction) or deeper into \~5,120 or even 4,820 zone before continuing the bullish rally.
* The major support zone around **4,820–5,120** includes key Fib retracement levels (38.2% and 61.8%) from both extensions and historical breakout levels.
Fundamental Context:
* US economy shows **resilience** amid soft-landing narrative, though inflation remains sticky.
* The **Federal Reserve** is expected to cut rates in **Q3–Q4 2025**, boosting equity valuations.
* Liquidity expansion and dovish outlook support risk assets, including **equities and crypto**.
* However, **AI-driven tech rally** may be overstretched; a correction could follow earnings disappointments or macro surprises (e.g., jobs or CPI shocks).
Narrative Bias & Scenarios:
**Scenario 1 – Correction Before Rally (Purple Path)**
* If SPX faces macro pushback (e.g., high CPI, hawkish Fed), expect retracement to:
* 5,600 = Fib -23.6% zone
* 5,120–4,820 = Major Fib Confluence Zone
* These would act as **accumulation zones**, setting up next leg up toward TP1 and beyond.
* **Effect on Gold**: May rise temporarily due to risk-off move.
* **Effect on Crypto**: Could stall or correct, especially altcoins.
**Scenario 2 – Straight Rally (Green Path)**
* If Fed confirms cuts and macro remains soft:
* SPX breaks ATH (\~6,128)
* Hits TP1 (\~6,450), TP2 (\~6,840)
* Eventually reaches confluence at **TP3 (7,450–7,760)**
* **Effect on Gold**: May struggle; investor preference for equities.
* **Effect on Crypto**: Strong risk-on appetite, altseason continuation.
Indicators Used:
* 3 Fibonacci levels (retracement + 2 extensions)
* Trendlines (macro and local)
* Confluence mapping
Philosophical/Narrative Layer:
This phase of the market resembles a test of collective confidence. Equity markets nearing ATHs while monetary easing begins reflect a fragile optimism. The Fibonacci levels act as narrative checkpoints — psychological as much as mathematical. Will we rally on faith or fall for rebalancing?
Bias & Strategy Implication:
Bias: Bullish with caution
* Strategy:
* Await **confirmation breakout >6,128** for fresh long entries
* Accumulate on dips in the **5,100–5,500** zone if correction unfolds
* Use **TP1, TP2, TP3** as staged exits
Related Reference Charts:
* BTC.D Analysis – Bearish Bias:
* TOTAL:Bullish Bias
*TOTAL3 – Bullish Bias:
* US10Y Yield – Falling Bias Impact:https://www.tradingview.com/chart/US10Y/45w6qkWl-US10Y-10-Year-Treasury-Yield-Weekly-TF-2025/

AVGO heads up at $265: Take Profits at this Major Resistance ?AVGO has hit our target from last idea below.
Golden Covid + Minor Genesis at $264.56-265.27
Likely a dip here, or Break-n-Retest as surprise.
.
Last Plot that caught the BreakOut:
.
Hit the BOOST and FOLLOW to encourage more such a PRECISION
.

BankNifty levels - Jun 10, 2025Utilizing the support and resistance levels of BankNifty, along with the 5-minute timeframe candlesticks and VWAP, can enhance the precision of trade entries and exits on or near these levels. It is crucial to recognize that these levels are not static, and they undergo alterations as market dynamics evolve.
The dashed lines on the chart indicate the reaction levels, serving as additional points of significance. Furthermore, take note of the response at the levels of the High, Low, and Close values from the day prior.
We trust that this information proves valuable to you.
* If you found the idea appealing, kindly tap the Boost icon located below the chart. We encourage you to share your thoughts and comments regarding it.
Wishing you successful trading endeavors!