Gold Continues to rise 1H Analysis Everything explained on the chart as usual. How high can gold keep pushing?
A monumental Bull run offering many great trading opportunities! I do my best to keep trading as simple as possible. The less noise the better.. focusing on execution and consistency.
Supportandresitance

EURAUD at Resistance - Will Sellers Step In?OANDA:EURAUD is testing a strong resistance zone, an area where sellers have stepped in before. If price struggles to break through and we see bearish confirmation—such as rejection wicks, bearish engulfing candles, or decreasing buying volume—I anticipate a move toward 1.6600.
A clean rejection from this level could trigger selling momentum, leading to further downside. However, if buyers manage to break above 1.6800 with strong conviction, it could shift the bias bullish and invalidate the short setup.
This is not financial advice but rather how I approach support/resistance zones. Remember, always wait for confirmation, like a rejection candle or volume spike before jumping in.
Please boost this post, every like and comment drives me to bring you more ideas! I’d love to hear your perspective in the comments.
Best of luck , TrendDiva

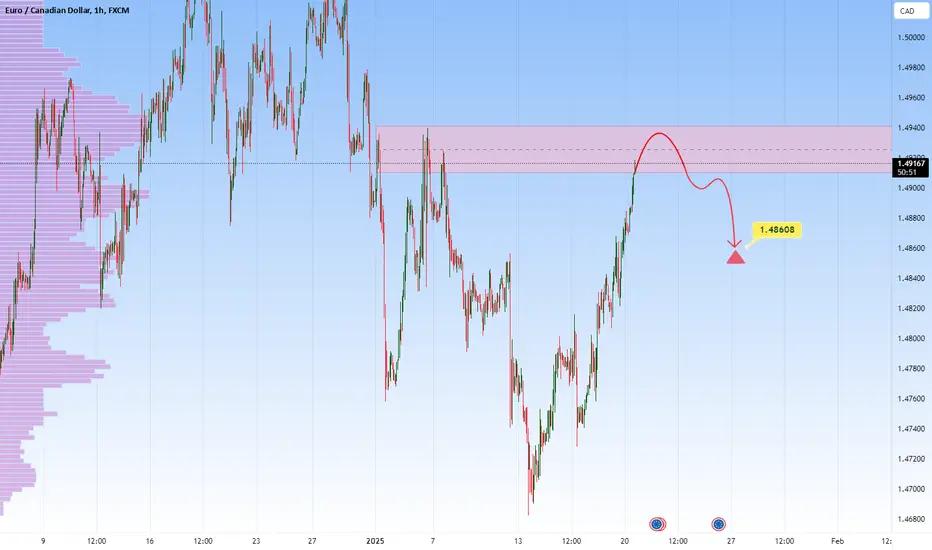
EURCAD - Sell Setup at Clear Resistance ZoneOANDA:EURCAD is approaching a significant resistance zone. This zone has consistently acted as a key area of interest where sellers regained control, leading to reversals. If the price confirms rejection through bearish price action, such as wicks signaling rejection, I anticipate a move downward toward the 1.49600 level.
However, if the price successfully breaks and holds above the zone, this would invalidate the bearish outlook and could open the door for further upside.
Proper risk management is essential, given the possibility of price breaking higher.
This is not financial advice but rather how I approach support/resistance zones. Always wait for confirmation, like a rejection candle or volume spike before jumping in. And let me know what you think of this setup in the comments!

15min - 1 hour short term Day trade Idea for MES15min - 1hr trading idea for short term gain. Thoughts.
After reviewing and studying the chart I found myself pondering on a short term gain for the upcoming trading session. Thoughts and critique welcome.
The use of FVG that has not been mitigated is in play
Oversold on an RSI
Momentum on slowing down on a bear trend
As always. Not offering financial advice. Just food for thought.

Bitcoin: Full February plan (125K shortly)Since the price of bitcoin broke out of the falling wedge formation and was successfully retested twice, its price action is incredibly bullish right now! We may anticipate higher prices over the next few days and weeks because there isn't anything particularly negative about the price action.
Three powerful levels are visible on the chart, which you can utilize to guide your trading selections. The symmetrical triangle's 0.382 FIB and POC mark the initial level, which is located at 105,544 USDT. Following a breakout, this level will probably be tested soon. This implies that Bitcoin may surge above $110,000, then return to test this level before rising further. 110,342 USD is the second level price. Because it is the 0.618 FIB extension from wave 1 to wave 2, this level is likewise quite powerful.
We can anticipate a liquidity sweep above this swing high and a brief downturn since it is also above the prior all-time high. At 118,109 USDT, the third level is located. We also have a 1:1 FIB extension, and as you may know, Bitcoin responds to this extension rather consistently, so this is another important level. It's among the greatest.
The Elliott Wave analysis shows that the price action is likewise bullish. Impulse wave 3 has begun, and we have just completed the ABC correction with a 1:1 FIB extension. The 1:1 FIB extension may also mark the end of this wave 3, but we must watch for trendlines, chart patterns, and maybe RSI bearish divergence.
For the upcoming days and weeks, this is my main strategy. The other strategy is that the ABC correction (wave 2) may become a WXYXZ triple three corrective wave if it is not finished.
I'll provide you with an analysis if you leave a comment with your altcoin. For more inspiration, please hit boost and follow. If you have a skilled coach, trading is easy! Since there is no stop-loss or profit goal, this is not a trade setup. I keep my trades to myself. Thank you, and best of luck with your transactions!


CADJPY: Strong Reversal After Liquidity GrabEducational Insight
The market surged to the upside, targeting liquidity highs to trigger stop losses. Once liquidity was cleared, price stalled and reversed sharply.
By marking key candle highs and lows, we identified swing points to count the market waves. We applied the 2 Data Points Rule to validate the break of support or resistance—this is a crucial concept in confirming true market structure shifts.
Additionally, we analysed the wavesofsuccess wave structure, focusing on the Momentum Low and what to anticipate when price reaches this level.
🚀 If this insight adds value to your trading, smash the boost and drop a comment!
Blessings.

Bitcoin can make correction to support line and then rebound upHello traders, I want share with you my opinion about Bitcoin. Looking at the chart, we can see how the price some time ago rebounded from the support level, which coincided with the buyer zone and started to grow to the resistance level. When BTC almost reached the 106K level, it turned around and made a small correction, after which it rose to the seller zone in a short time. Then the price dropped to the buyer zone, after which made a strong impulse up to new ATH (109K points) and started to trades inside the triangle. In this pattern, the price at once made a correction movement to support line of the triangle and then repeated impulse up to the seller zone. After this movement, BTC made a correction to the support line of the triangle again and then backed up to the seller zone in a short time and even rose to the resistance line of the triangle pattern. Next, the price started to decline and later fell to the support level, exiting from the triangle pattern and also then broke the 100K level and fell below. But then BTC started to grow near the support line and soon broke the 100K level one more time and continued to move up next. Recently it made correction and then continued to grow, so, in my opinion, Bitcoin can correct to support line again. After this, I expect that the price will continue to move up the resistance level. That's why I set my TP at 105K points. Please share this idea with your friends and click Boost 🚀

EURO - Price can little correct and then bounce up to $1.0580Hi guys, this is my overview for EURUSD, feel free to check it and write your feedback in comments👊
A few moments ago price traded inside flat, where it reached $1.0450 level and then dropped to $1.0270 level.
After this, Euro turned around and rose to almost $1.0450 level, after which turned around and started to fall in wedge.
Price fell to support line of wedge and then at once bounced up, breaking $1.0270 level one more time.
Next, EUR some time traded near this level and when it reached support line of wedge, it continued to move up.
In a short time, price reached $1.0450 level, broke it, and rose to resistance line of wedge, after which corrected.
So, I think that price can fall to support area and then bounce up to $1.0580, exiting from wedge.
If this post is useful to you, you can support me with like/boost and advice in comments❤️

GBPZAR - Potential Long to enterOANDA:GBPZAR is approaching a robust support zone, marked by historical bullish reversals and strong buyer interest. The recent bearish pressure has brought the price into this critical area, creating a potential buying opportunity.
I anticipate a move toward 23.1840. However, a breach of this support could invalidate the bullish outlook and lead to further declines.
Make sure to carefully assess price action at this level and ensure proper risk management before taking positions. Agree with this analysis? Let’s discuss further in the comments section!

GBPUSD Week 5 Swing Zone & LevelWelcome back traders.
Swing zone and levels are set in, with predicted path.
As always price action determines trades

Will the support level of 0.31097 be broken ?Breaking the range specified in the previous analysis and correcting the price to the lower range

Bitcoin can turn back to the seller zone from the support lineHello traders, I want share with you my opinion about Bitcoin. By observing the chart, we can see that the price some days ago reached a resistance level, which coincided with the seller zone, and then dropped to the support level, which coincided with the buyer zone, and then started to trades in the range. In range, BTC at once rebounded from the support level and tried to grow, but failed and fell back. After this, the price bounced up and then turned around and declined to the buyer zone, after which started to grow. A short time later, Bitcoin rose to the top part of the range and then dropped to the buyer zone back, making a fake breakout of the support level, and then turning back to the range. Price sometimes traded near the 93200 level and later broke it, exiting from the range also and falling to 90800 points. Then BTC made a strong impulse up from this point and rose to almost resistance level, which coincided with the seller zone, after which corrected to the support line. Then BTC rebounded up from this line and rose to the seller zone, reaching a new ATH (109K), and soon fell back to the support line. But recently price bounced from this line and started to grow. So, for this case, I think that BTC can fall to the support line and then rebound up to the seller zone, breaking the resistance level. That's why I set my TP at 109500 points. Please share this idea with your friends and click Boost 🚀

USDSGD: Potential Short from Key ResistanceThe USDSGD pair is approaching a notable resistance zone around the 1.37160 level, an area that has historically acted as a supply zone, leading to price reversals. The current price action shows signs of hesitation as it tests this zone, which could indicate potential weakness.
If sellers regain control, the pair could reverse downward, with the 1.35041 level being a likely target for the next support zone.

retreat frm ytd 'short bullrun'; look at key support levelPEPPERSTONE:HK50
HSI:HSI
Look at the 4H chart.
MACD - Deadcross curving down
KDJ - Bearish zone.
BB - entering lower band.
Cross-checked with broader tf chart - D chart.
MA20 :19632
MA52 :19738 (MA52>MA20)
KDJ is now at bullish zone; overbought.
Both KDJ and MACD are still below zero. MACD seems to be forming a curve; it may go down if there is no strength to break above the zero line and turn bullish.
We can probably see a sideways movement until the distraction—news announced in February.
Continue to monitor to wait for MACD Signal cross above zero line confirming BULLISH.
Can accumulate and swing trade for 4 wks-6 wks.
Look at the 1H chart.
The pullback is delayed but inevitable.
At point of observed KDJ it's in red bearish zone.
MACD is at bullish area fast line is touching signal line forming a dead cross within Bullish zone.
For day trade: Same strategy, sell at resistance; buy/TP at support.
Monitor the 1H,4H movement with confirmation using MACD & KDJ indicator.
Set your tf, have your entry and exit plan!
Support : 19782 (next 19742, 19300 ; key support level 19545)
Resistance : 19900 (if breaks then 20030)
Sticktoyourplan follow your trading strategy.
Trading to make pocket money isn't that challenging. Although it can be boring, you can make it fun and zen with it.
Let's follow our own strategy and zen with 📙 and 🍵 to let the results realized.
Reminder : to slowly accumulate Hong Kong and China stock/ETF/Index and wait for 12-24months or more to have an exponential capital gain. Check the Month Chart you will notice, is almost there already....
HKEX:2800 HKEX:2823 HKEX:2801
Time frame is important! Prepared for the rollercoaster short-term rider for these two markets.
Time is our friend!
Trend is our friend too, do not go against it.
Happy Trading Everyone! ☺

HSI performance with the 47th president inaguration PEPPERSTONE:HK50
HSI:HSI
Hello everyone! CNY is around the corner, am about to off for celebration.
Hope who celebrate CNY enjoy and welcoming the new wood snake 🐍 coming.
Is gonna to be a challenging and fascinating year to both West and East.
The trade plan.
Look at the 4H chart.
Both MACD & KDJ are arcing again (MACD still within the bearish zone, below zero level)
MACD is at bullish zone but fast line curving down.
KDJ at overbought zone and curving down and turned into red zone indicate Bearish.
Cross-checked with broader tf chart - D chart.
KDJ is now at bullish zone but overbought.
Both KDJ and MACD are still below zero level. Bearish, monitor to wait for MACD Signal cross above zero line confirming BULLISH.
1H chart the Index had soared 440++pts; +2.27% for HK50 yesterday.
Pullback is inevitable today.
At point of observed KDJ it's in red bearish zone.
MACD is at bullish area fast line is touching signal line forming a dead cross within Bullish zone.
For day trade: Same strategy, sell at resistance; buy/TP at support.
Monitor the 1H,4H movement with confirmation using MACD & KDJ indicator.
Set your tf, have your entry and exit plan!
Support : 19895 (next 19778; key support level 19545)
Resistance : 20300 (if breaks then 20350)
Sticktoyourplan follow your trading strategy.
Trading to make pocket money isn't that challenging and it can be boring and you can make it fun and zen with it.
Let's follow our own strategy and zen with 📙 and 🍵 to let the results be realized.
It can be a winning trade or losing trade, it doesn't matter. We are aiming for long horizon; as we are not gambling or speculating.
The markets is always gonna be there.
Reminder
For the East : to slowly accumulate Hong Kong and China stock/ETF/Index (undervaluation) and wait for 12-24months or more to have an exponential capital gain. Check the Month Chart you will notice, is almost there already....
For the West : AI applications, Digital assets for sure but not all in one basket. Diversified.
Time frame is important! Prepared for the rollercoaster short-term rider for these two markets.
Time is our friend!
Happy Trading Everyone! ☺

EURCAD - Potential Sell From Resistance ZoneEURCAD is testing a major resistance zone that has previously led to significant bearish reversals. The recent bullish momentum into this area increases the likelihood of seller interest.
If bearish confirmation emerges, such as rejection wicks, bearish engulfing candles, or increased selling volume, I anticipate a move toward 1.48608. However, a breakout above this resistance could signal further bullish continuation.
Traders should remain cautious and wait for clear signals of rejection before taking positions. Agree with this analysis? Let’s discuss further in the comments section!
AUS200 - Potential SHORT setupPEPPERSTONE:AUS200 is currently in a critical resistance zone that has consistently acted as a barrier for bullish momentum.
Taking this into account I anticipate a move toward at least 8,250. However, if the resistance fails to hold, it may open the door for further upside.
Proper risk management is essential, given the possibility of price breaking higher.
Feel free to share your opinions in the comments.

AUDCHF - Potential Short Opportunity from Key ResistanceOANDA:AUDCHF is currently testing a significant resistance zone. Historically, this area has seen strong selling pressure, leading to notable bearish moves. The recent bullish push into this resistance zone suggests a potential for sellers to regain control.
A bearish confirmation, such as rejection candles, bearish engulfing patterns, or long upper wicks, would increase the probability of a downward move. If this scenario unfolds, the price could head toward the 0.56623 level.
Traders should remain cautious and wait for clear signs of selling pressure before considering short positions. Proper risk management is essential, given the possibility of a break above the resistance zone.
What are your thoughts on this setup?

AUDJPY: Potential Long from Key Support ZoneOANDA:AUDJPY is currently trading near a significant support zone which previously led to bullish reversals. The recent bearish move into this zone suggests a potential for buyers to step in and drive prices higher.
A bullish confirmation, such as rejection patterns, bullish engulfing candles, or long lower wicks, would increase the likelihood of a rebound. If buyers regain control, the price may rise toward the 96.650 level, where sellers could potentially re-emerge.
This setup aligns with a possible short-term recovery within the broader bearish trend. Traders should wait for confirmation of buying pressure before considering long positions.

Procter & Gamble (P&G) Overview and AnalysisProcter & Gamble (P&G) is a global leader in consumer goods, offering a wide range of household, personal care, and health products. Their iconic brands, including Tide, Gillette, Pampers, and Olay, have made them a household name worldwide.
1️⃣ Past Performance: In their last two earnings reports, the stock jumped by ~12% after strong results.
2️⃣ Current Price: The stock has dropped to a key support level ($159), attracting buyers at a discount.
3️⃣ Upcoming Earnings: Set for January 22, 2025—a potential catalyst for movement.
4️⃣ Outlook: Analysts predict a price target of $209 by year-end, highlighting strong growth potential.

is the index in booze again and in breakdance mode? PEPPERSTONE:HK50
HSI:HSI
Hello bello...everyone, may all your trade closed in profit!
As mentioned in yesterday post, the Index was in a bearish mode but be cautious.
Look at the 4H chart, do you see?
Both MACD & KDJ are arcing again (MACD still within the bearish zone, below zero level)
4H chart - Bearish (bullish reversal within bearish zone, temporary -this can be fake rebound 😂)
Cross-checked with broader tf chart - D chart.
KDJ is now at oversold area 20.
Both KDJ and MACD below zero level. Bearish.
1H chart
the Index seems has no mood and strength to move and need quite a long rest...
Mood change overnight, re-adjust and in the action.
MACD - reversal for bullish generating green histogram; although the signal within bearish zone. Hence, for day trade is bullish for the week it could be pullback.
KDJ completed the bearish mode and turned bullish; at the point of observation, it was overbought at KDJ ~75.
MACD arcing up Bullish, KDJ overbought zone - this signal divergence; so cautious of the potential correction. It's likely to pullback. Hence, trade cautiously.
For day trade: Same strategy, sell at resistance; buy/TP at support.
Monitor the 1H,4H movement with confirmation using MACD & KDJ indicator.
Set your tf, have your entry and exit plan!
Support : 18300; today broke the support level hopefully it stays above 19070 level. (if breaks then next 19300)
Resistance :19200-19300 (if breaks then 19450, then 19650)
Sticktoyourplan follow your trading strategy.
Trading to make pocket money isn't that challenging and it can be boring and you can make it fun and zen with it.
Let's follow our own strategy and zen with 📙 and 🍵 to let the results realized. It can be a winning trade or losing trade, it doesn't matter. We are aiming for long horizon; as we are not gambling or speculating.
Rememeber to allocate some of your gained pocket money for long term asset investment.
We should take contrarian strategy. Accumulate Hong Kong and China stock and wait for 12-24months or more to have an exponential capital gain.
Check the Month Chart you will notice, is almost there already....
PEPPERSTONE:HK50 HKEX:2800
Time frame is important! Prepared for the rollercoaster short-term rider for these two markets.
Got your trade plan ready for 2025, or are you still figuring out your moves?
Share your view OR hit the 🚀 , signal that you keen to explore.
Happy Trading Everyone! ☺

GBPCHF - Bullish Setup at Key Support ZoneThe GBPCHF pair is currently testing a key demand zone, where previous price reactions suggest potential for a bullish reversal. This area has historically been a support level, indicating that buyers could regain momentum at this juncture.
A confirmation of bullish sentiment, such as the emergence of a bullish candlestick pattern or a strong rejection wick, would reinforce the likelihood of a rebound. Should this scenario unfold, the price could target the 1.12417 level.
What are your thoughts on this outlook?

MNQ!/NQ1! Day Trade Plan for 01/13/25MNQ!/NQ1! Day Trade Plan for 01/13/25
📈 21074
📉 20660
1/2 way mark 📈 20970.50 & 📉 20763.5
Like and share for more daily NQ levels 🤓
*These levels are derived from comprehensive backtesting and research, demonstrating over 90% accuracy. This statistical foundation suggests that price movements are likely to exceed initial estimates.*
