USDCHF: Turned bullish again.USDCHF is technically bearish on the 1D outlook (RSI = 38.319, MACD = -0.005, ADX = 47.617) and the long term pattern remains a Channel Down but the 1D MACD has formed a Bullish Cross. Since August 2022, 3 out of 4 such formations under 0.000 have initiated strong rises. Consequently, at least on the medium term, we regard this formation more dominant than the Channel Down.
We can see a Channel Up emerging but in order for that to be sustainable, the Channel Down's top needs to break. Thus, we are only going to target its top (TP = 0.8950). This trade gets invalidated if the price crosses under the bottom of the Channel Up (short then TP = 0.8555).
See how our prior idea has worked:
## If you like our free content follow our profile to get more daily ideas. ##
## Comments and likes are greatly appreciated. ##
Swissfranc

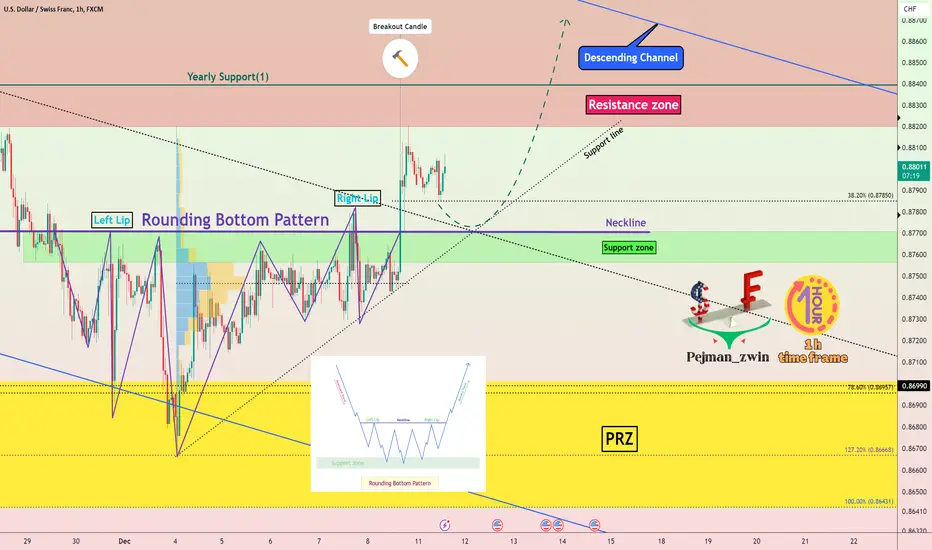
USDCHF is ready to Jump by Rounding Bottom Pattern🚀🏃♂️ USDCHF has been moving in the Descending channel for a long time, but USDCHF started to increase by hitting the 🟡 Price Reversal Zone(PRZ) 🟡and managed to form a Rounding Bottom Pattern .
🔔I expect USDCHF to move at least to the upper line of the descending channel and possibly break the descending channel as well.
U.S.Dollar/Swiss Franc ( USDCHF ) 1-hour time frame⏰.
Do not forget to put Stop loss for your positions (For every position you want to open).
Please follow your strategy; this is just my idea, and I will gladly see your ideas in this post.
Please do not forget the ✅' like '✅ button 🙏😊 & Share it with your friends; thanks, and Trade safe.
CAD-CHF Strong Resistance Ahead! Sell!
Hello,Traders!
CAD-CHF made nice bullish
Move up but a strong
Horizontal resistance is ahead
At 0.6494 from where I think
We will see a bearish reaction
Sell!
Like, comment and subscribe to help us grow!
Check out other forecasts below too!

USDCHF - Price can make retest of support line and continue riseHi guys, this is my overview for USDCHF, feel free to check it and write your feedback in comments👊
Some time ago price started to trades in a falling channel, where it a few time traded near $0.8820 level and then broke it.
After this, price declined to $0.8720 support level, which coincided with support zone, and then bounced up, exiting from channel.
Then price reached resistance line and at once fell to support line, but soon backed up, thereby breaking $0.8720 level.
Next, CHF continued to trades between resistance and support lines, but recently it reached resistance line and broke it.
Now, price trades near this line and I think Swiss Franc can make retest and then bounce up to $0.8860, breaking resistance level.
If this post is useful to you, you can support me with like/boost and advice in comments❤️

USDCHF - BULLISH SCENARIO 📈Hi Traders !
Yesterday, The USDCHF Price Reached a Support Level (0.87270 - 0.86904)
So We Have a Bullish Scenario:
If The Market Breaks The Resistance Line and Closes Below That
We Will See a Bullish Move...
TARGET: 0.88800🎯

USDCHF - BULLISH MOVE 📈
As We Talked in The Previous Analysis:
The USDCHF Price Reached a Support Level (0.87270 - 0.86904)
Currently:
The Resistance Line is Broken
So, I Expect a Bullish Move.
-----------
TARGET: 0.88800🎯

GBPCHF: Important Breakout 🇬🇧🇨🇭
GBPCHF broke and closed below a support of a wide horizontal range on a daily.
To me, it is an important sign of strength of the sellers.
We may expect a bearish movement at least to 1.094
❤️Please, support my work with like, thank you!❤️

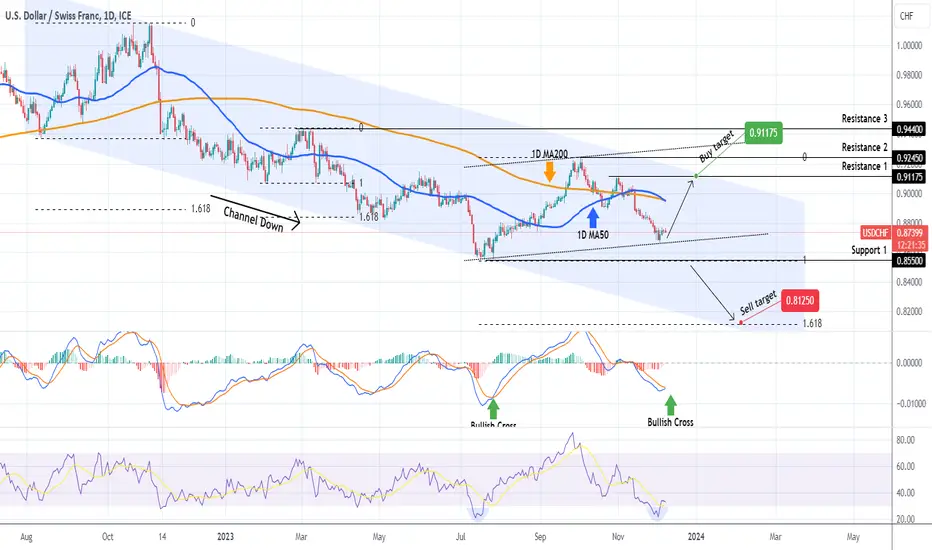
USDCHF Is it experiencing a pattern change?The USDCHF pair has been trading within a Channel Down pattern since the August 11 2022 Low. Such a long-term pattern is difficult to break but according to the 1D MACD and RSI indicators, the pair may be experiencing a pattern change.
As you can see, the 1D MACD is about to form a Bullish Cross, the lowest since July 27, which was soon after the last Lower Low on the Channel Down. Along with the fact that the 1D RSI breached through the 30.00 oversold barrier and rebounded exactly on the same level as the July 13 Low, we have a strong case for a new bottom, which is not consistent with a Channel Down Lower Low.
As a result a new Channel Up (dotted lines) may be emerging and our trading plan involves buying now at the (potential) Higher Low and targeting the top (Lower Highs trend-line) of the long-term Channel Down at 0.91175, which is also Resistance 1.
If on the other hand Support 1 (0.85500) breaks, we will take the loss on the buy and go short instead, targeting the bottom of the Channel Down at 0.81250, which is also the 1.618 Fibonacci extension.
-------------------------------------------------------------------------------
** Please LIKE 👍, FOLLOW ✅, SHARE 🙌 and COMMENT ✍ if you enjoy this idea! Also share your ideas and charts in the comments section below! This is best way to keep it relevant, support us, keep the content here free and allow the idea to reach as many people as possible. **
-------------------------------------------------------------------------------
💸💸💸💸💸💸
👇 👇 👇 👇 👇 👇
AUDCHF: Bearish Outlook & Trading Plan 🇦🇺🇨🇭
AUDCHF is testing a key horizontal supply area.
A bearish breakout of a neckline of a double top pattern on an hourly time frame
gives us a strong bearish confirmation.
We may anticipate a bearish continuation to 0.5733
❤️Please, support my work with like, thank you!❤️

✅EUR_CHF BUYING OPPORTUNITY|LONG🚀
✅EUR_CHF fell again to retest the support of 0.942
But it is a strong key level
So I think that there is a high chance
We will see a bullish rebound and a move up
LONG🚀
✅Like and subscribe to never miss a new idea!✅

USDCHF: Classic Smart Money Pattern?! 🇺🇸🇨🇭
I spotted a classic smc formation on USDCHF.
The price violated a key support. The violation turned out to be a trap
and the market returned above the structure with a strong bullish imbalance.
We may anticipate more growth now.
Goal - 0.873
❤️Please, support my work with like, thank you!❤️

Possible rejectionPair just hit a two years old resistance. I'm opening a small short position and I will add if price action confirms the rejection: a double top or some other bearish pattern on lower timeframes. SL above the next resistance. This could be the beginning of a bearish triangle if the pair breaks down the 0.94 support. But let's see how it goes first.

HelenP. I Swiss Franc can start grow to resistance levelHi folks today I'm prepared for you Swiss Franc analytics. A few time ago price fell to resistance 2, which coincided with the resistance zone and trend line. After this, CHF rebounded from the trend line and tried to rise, but failed and in a short time declined lower than resistance 2, thereby breaking it. Next, the price reached the trend line and at once rebounded to the resistance zone, after which it made a strong impulse down back to the trend line. The Swiss Franc bounced and continued to decline near this line to resistance 1. When the price reached this level, it first declined lower and soon rose back, but not long ago it declined back yet, thereby breaking resistance level 1 too. At the moment, Swiss Franc trades close to the trend line and I think that price can start to rise to resistance level and try to break it. After a breakout, the Swiss Franc can make a retest and then continue to move up, therefore I set my target at the 0.8830 level. If you like my analytics you may support me with your like/comment ❤️

EURCHF - Bearish Double TOP 📉Hello Traders !
On The Daily Time Frame, The EURCHF Reached a Resistance Level.
The Price Formed a Double TOP Pattern.
Currently,
-The Neckline is Broken.
So I Predict a Bearish Move 📉
i'm Waiting for Retest...
-----------
TARGET: 0.94820🎯

NZDCHF - BULLISH MOVE 📈
Currently,
-The Price Pulled Back to 0.5 Fibonacci Retracement Level !
-and Formed a Bullish Falling Wedge
-and Now it Will Continue its Bullish Movement !
-----------
TARGET: 0.54075🎯

✈️CADCHF can go UP by Falling Wedge Pattern✈️🔄 CADCHF re-entered the 🟢 Support zone(0.648CHF-0.645CHF) 🟢 after experiencing a 🐻 Bear Trap 🐻.
💡Also, CADCHF seems to have succeeded in forming a Falling Wedge Pattern , so the upper line of this pattern was broken hours ago.
💡Also, we can see Regular Divergence(RD+) between two Consecutive Valleys .
🔔I expect CADCHF to GO UP in the coming days and may rise to 🔴 Resistance zones 🔴.
Canadian Dollar/Swiss Franc Analyze ( CADCHF) 4-hour time frame ⏰.
Do not forget to put Stop loss for your positions (For every position you want to open).
Please follow your strategy; this is just my idea, and I will be glad to see your ideas in this post.
Please do not forget the ✅' like '✅ button 🙏😊 & Share it with your friends; thanks, and Trade safe.

USDCHF - Descending Triangle 📉Hi Traders !
The USDCHF Price Failed To Create a New Higher High !
The Price Formed a Descending Triangle Pattern.
The Support Level is Broken
So, I Expect a Bearish Move📉
i'm waiting for retest...
-----------
TARGET: 0.87870🎯

EURCHF: Is That a Bullish Confirmation?! 🇪🇺🇨🇭
In comparison to USDCHF, EURCHF looks bullish to me.
The price is trading within a wide horizontal range on a 4H.
Testing its support, the pair formed a tiny cup & handle pattern
and violated its neckline.
I believe that the market will go to the resistance of the range - 0.9678
❤️Please, support my work with like, thank you!❤️

Swiss Franc can rebound up from buyer zone to 0.8900Hello traders, I want share with you my opinion about Swiss Franc. Looking at the chart, we can see how the price some days ago made an upward impulse to the 0.9015 resistance level, which coincided with the seller zone and soon broke it. After this price some time traded near and then rose to the resistance line of the triangle. Then Swiss Franc rebounded from this line and fell to the support line, thereby breaking the 0.9015 resistance level again. Price tried to back up, but failed and made a strong downward impulse to the current 0.8840 resistance level, thereby exiting from the triangle and entering to range as well. In range, CHF declined to 0.8840 level and a not long time ago it broke this level too. And now, the price trades below the 0.8840 level in the buyer zone inside the range. In my mind, the Swiss Franc can rebound up from the buyer zone to the top part of the range, thereby breaking the resistance level. For this case, I set up my target at the 0.8900 level. Please share this idea with your friends and click Boost 🚀

Swiss Frank Future Trade Plan based on CME option trades1.1227 price is the most interesting from a trading perspective because it falls perfectly into the sellers' range.

AUDCHF On the verge of a strong move.The AUDCHF pair has been trading within a Channel Down since February's High and currently sits just below its top (Lower Highs trend-line). Having formed a 1D MA50/ 100 Bullish Cross and tests the Lower Highs for the 3rd time in 2 months, it is highly likely to finally break the bearish trend upwards. We will only buy though above the 1D MA200 (orange trend-line) and aim towards Resistance 1 at 0.61500. Until this break-out, we will follow the long-term bearish Channel Down and short aiming at 0.53500 (-9.09% similar to the two previous bearish sequences).
-------------------------------------------------------------------------------
** Please LIKE 👍, FOLLOW ✅, SHARE 🙌 and COMMENT ✍ if you enjoy this idea! Also share your ideas and charts in the comments section below! This is best way to keep it relevant, support us, keep the content here free and allow the idea to reach as many people as possible. **
-------------------------------------------------------------------------------
💸💸💸💸💸💸
👇 👇 👇 👇 👇 👇

AUDCHF: Important Bullish Breakout 🇦🇺🇨🇭
AUDCHF broke and closed above the resistance of a horizontal trading range on a daily.
We may anticipate a bullish continuation now.
Next resistance: 0.5856
❤️Please, support my work with like, thank you!❤️

EUR/CHF - Swissie looks done! DB + TL breakEURCHF looks like its T-ing up a long term trend reversal after a double bottom and downtrend line break on the daily candle chart.
Trade idea = wait for next 2+ day pullback into 0.955-0.96 zone. Cut losses at 0.95 and get long again if/when Swing high gets taken out.
