Bullish on 2382 ADES TASI Fake breakout on 1H and close daily above Monthly level (orange line)
Wait for retest and target 17.18 price level
TASI

Currently in Bearish Trend. Currently in Bearish Trend.
H&S Pattern in play targeting around 40ish.
Weekly Closing above 70 may be a Positive
sign. However, if the selling pressure continuous,
we may witness 67 & then 63.
In my view, it should test 74 - 75 once before going
down (if it has to).
Important Resistance is around 75 - 76.
Important Supports are 67 - 69 & then around 63.
One positive sign is that there is a double Bullish
Divergence on Shorter Time Frames. If it plays now,
we may see 73 - 75 (which is again a Resistance level).

Double BottomDouble Bottom around 168 -168.50; a bounce
is expected.
Tomorrow's Closing is Important.
Sustaining 168 , may lead it towards 190 - 193.
On the flip side, if 168 is broken, we may
witness further downside; but it should touch
180 - 181 once before going down.
However, for a Trend Reversal, it is important
to cross 201 - 202.

Make it or Break it Situation.
Currently at Rectangular Channel Bottom.
Few Green Candles at Current level may bounce
the price but 254 - 257 is a Resistance area that
needs to be Crossed & Sustain.
Next Important Resistance level is around 288 - 290.
However, if the Current Level is broken, we may
see further selling pressure & it may touch 240 & then
may be the range of 210 - 222 in worst case.

Morning Star formation on Daily TF but..Morning Star formation on Daily TF.
Monthly Closing above 29 would be a Positive Sign.
However, 28 - 29 can be a Good Support Zone.
28.50 should not be broken, otherwise further
Selling Pressure can be witnessed.
On the flip side, 32 - 32.50 is an Important Resistance.
However, only Morning Star formation is not enough, because
it is currently at Strong Resistance around 32 - 32.5, so
let it sustain this level.
Sustaining this level may give 2-4 riyals gain.

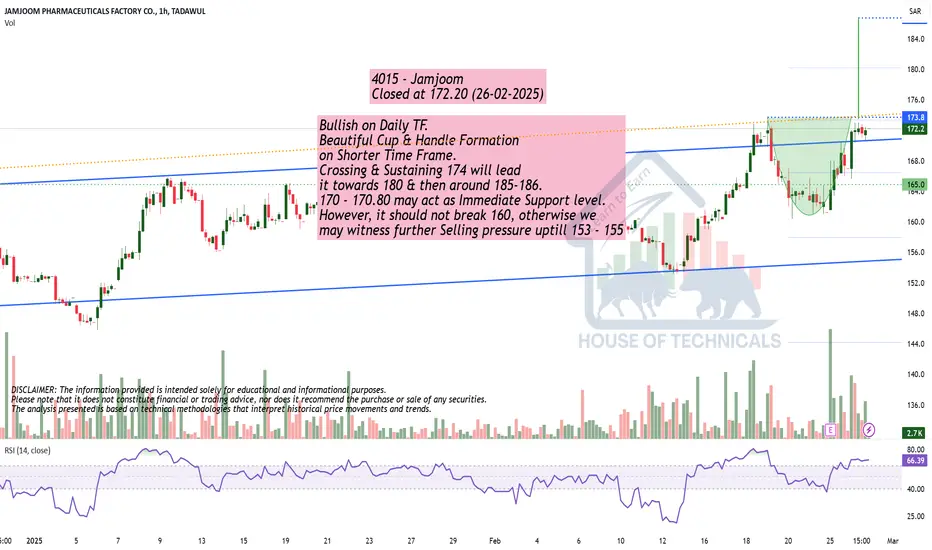
Bullish on Daily TF.Bullish on Daily TF.
Beautiful Cup & Handle Formation
on Shorter Time Frame.
Crossing & Sustaining 174 will lead
it towards 180 & then around 185-186.
170 - 170.80 may act as Immediate Support level.
However, it should not break 160, otherwise we
may witness further Selling pressure uptill 153 - 155
TASI IS GOING BEARISHAs you can notice on the chart, TASI as I told you in older posts, it grabbed the LQ at 12,302.190-12,333.861, gave us an entry point and now it is heading towards the level 11591.374 where it will grab the LQ.
For the people who have already bought, you can close and enjoy your profits, and for those who are willing to buy, the wise thing to do is hold your funds.
For further questions, don't hesitate to ask!
Follow for more!

#3090 #Tabuk CementBased on the pattern identified on the weekly chart, a bullish flag pattern is currently forming. This suggests a continuation of the previous upward trend. Given the characteristics of the pattern, we can plan entries on a medium to long-term timeframe by closely monitoring the identified levels on the chart. Entries only a breakout.
"Non financial advice, do your own research"

2281: Bullish Reversal from POC_Golden Pocket2281
Continuously in downtrend. Earlier estimations of reversal from bearish flag completion and support levels did not sustain (Bears dominated).
However, current price movement (green candles) at POC is confirming the interest of buyers.
This is in confluence with 50% fib (Golden Pocket)
Entry can be taken now (HH) or after formation of HL (conservative)
Keep SL intact as identified.

4031: Penant/Triangle Breakout4031
Triangle Consolidation Breakout
Wait for retest to take new entry (conservative)
Trade with proper SL

2240: Descending Channel Breakout2240 is showing breakout on monthly chart for the first time in a while
Take Entry now or wait for retest
Conservative entry will be after 44
Plan your trade with proper risk management

7202: Weekly Trendline Support7202 has shown reversal from downtrend
Weekly Bullish Divergence on RSI
Trendline support
HH, HL formation on daily time frame
SL or HL or below trendline support
Trade with proper risk management

UPDATE ON TASIA month ago, I posted that TASI will continue going lower to reach 11,439.529, and it came up the grab the LQ at 12182.412 now it will continue lower.
Again this movements fooled some people and bought higher now they're in losses and looking for how to recover.
Don't buy TASI now, wait for it to quit the consolidation level then you can buy.
Follow for more!


TASI-1211: SAUDI ARABIAN MINING COMPANYBullish bias for TASI-1211: SAUDI ARABIAN MINING COMPANY on 4 Dec 2024.
Buy at 50.6 with Stop Loss at 49.
Take profits at 52, 53, 54.5 and 57.

TASI - 8240 : CHUBB ARABIA COOPERATIVE INSURANCE CO - 2 DEC 2024Bullish Bias for TASI - 8240 : CHUBB ARABIA COOPERATIVE INSURANCE CO on 2 DEC 2024.
Buy at 48.4 with Stop Loss at 46.
TP-1 = 50.2, TP-2 = 52.0

TASI-4014: SCIENTIFIC & MEDICAL EQUIPMENT HOUSE - 2 DEC 2024Bullish bias for TASI-4014: SCIENTIFIC & MEDICAL EQUIPMENT HOUSE - 2 DEC 2024.
Buy at 52.1 with Stop Loss at 47.5.
TP-1 AT 56 and TP-2 AT 59.

TASI-1212: ASTRA INDUSTRIAL GROUP - 2 DEC 2024.Bullish bias for TASI-1212: ASTRA INDUSTRIAL GROUP on 2 DEC 2024.
Buy at 168.4 with SL at 165.4.
TP-1 at 153.6 and TP-2 at 156.2.

TASI-4262: LUMI RENTAL COBullish Bias on daily time frame for TASI-4262: LUMI RENTAL CO.
Buy at 75 and 74 with Stop Loss of 72.5.
TP1 = 78, TP2 = 80, TP3 = 82.

TASI-4165: AL MAJED OUDBullish bias for TASI-4165: AL MAJED OUD
BUY LIMIT Orders at 150.60 and 149.0 with STop Loss at 146.6
TP-1 = 153.6 , TP-2 = 156.2

TASI-2350: SAUDI KAYAN PETROCHEMICAL COMPANYShot-term Bullish Retracement for TASI-2350: Saudi Kayan Petrochemical Company
Buy-1 at 6.92 and Buy-2 at 6.87 with Stop Loss at 6.82
TP-1 = 6.98, TP-2 = 7.02

TASI-1830: LEEJAM SPORTSBullish bias for TASI-1830: LEEJAM SPORTS
BUY-1 at 178.8 and BUY-2 at 176.6 with Stop Loss at 173.2
TP-1 = 182.0, TP-2 = 186.2, TP-3 = 190.8

TASI-4007; ALHAMMADI HOLDINGBullish bias for TASI-4007: Alhammadi Holdings.
Buy-1 at CMP 40.70, Buy-2 at 40.05 with Stop Loss of 38.70.
TP-1: 41.20, TP-2: 42.05

TASI: Breakdown_Bears in PowerTASI:
Breakdown and Retest
Bearish Flag Pattern
Seems party is going on somewhere else ;)
Be Careful while taking trades in individual stocks.
some prefer DCA in such situations, some love the slogan "Cash is King" ;) peaceful
