#VOXELUSDT is in an uncertain zone📊 BYBIT:VOXELUSDT.P Scenario – Potential for Movement in Both Directions!
🚀 BYBIT:VOXELUSDT.P is forming a bullish Falling Wedge pattern — a breakout to the upside could provide a great risk/reward long opportunity!
At the current stage, the BYBIT:VOXELUSDT.P market is shaping a scenario where both directions — long or short — are possible, depending on the reaction to key levels.
✅ Overview
➡️ The chart shows two key formations:
🔻 Bearish Pennant – a bearish continuation pattern, which has already played out to the downside.
🔻 Falling Wedge – a potentially bullish pattern, and price is now near the lower boundary of the wedge.
➡️ A weak bounce on volume is visible, and price is approaching a key resistance zone — a potential target if the wedge breaks out upward.
➡️ If the wedge plays out, a bullish impulse is expected.
Timeframe: 1H
📈 LONG BYBIT:VOXELUSDT.P from $0.03406
🛡 Stop loss: $0.03322
🎯 TP Targets:
💎 TP 1: $0.03456
💎 TP 2: $0.03526
💎 TP 3: $0.03586
➡️ This scenario becomes viable if price breaks and consolidates above the $0.03126–$0.03200 zone, opening the path toward the POC zone at $0.03676.
➡️ Volume should increase on the breakout to confirm momentum.
📉 SHORT #VOXELUSDT from $0.03016
🛡 Stop loss: $0.03126
🎯 TP Targets:
💎 TP 1: $0.02960
💎 TP 2: $0.02900
💎 TP 3: $0.02860
➡️ This scenario activates if the price fails to rise and pulls back below $0.03000.
➡️ Volume should confirm seller pressure.
➡️ The chart shows lower highs — risk of further decline remains.
📍 The price is currently in a critical decision zone , between the short entry level and the potential breakout zone for a long.
📍 The support below is strong — it has held the price several times already. No clean breakdown has occurred yet, which increases the chances of the wedge breaking upward.
📍 Avoid rushing into a position — wait for a clear confirmation in either direction (e.g., strong impulse on volume and consolidation above/below key levels).
📢 General advice on this asset:
📢 Wait for direction confirmation — both long and short setups are valid.
📢 Stay flexible and adjust to the move.
📢 Manage your risk carefully — do not enter without a signal.
🚀 BYBIT:VOXELUSDT.P is in an uncertain zone — the signal could play out in either direction. Watch the key levels and enter only after confirmation!
Technical Analysis

Foundation of Technical Trading: What Makes a Chart Tradable?The Foundation of Technical Trading
There is an abundance of information on price charts, technical methods, indicators, and various tools. However, the required first step is to understand basic market structure. Without this foundational knowledge, technical applications risk becoming inconsistent and disconnected from broader market behavior.
It is also important to question whether technical charts and tools are effective at all. What makes the market responsive to a trendline, a pattern, or an indicator? And why, at other times, do these tools seem entirely irrelevant? Is the market random? If certain events are predictable, under what conditions can such occurrences be expected?
Experiment: Random Charts
Here is an illustration of four charts; two showing real price data and two randomly generated. While some visual distortion gives away subtle differences, there are more refined methods to construct this experiment that makes telling the difference between real and random almost impossible.
All these charts show viable patterns and possible applications. When presented with these, even experienced people tend to construct narratives, whether or not structure is present. This raises a fundamental question; how can one distinguish real occurrences from coincidental formations on a chart? In case all movements are considered random, then this should indicate that applied methods perform no better than coincidence?
Bias and Distortion
It’s also important to comprehend the influence our perception. As humans we are wired to find patterns, even in random data, which can lead to various cognitive biases that distort our interpretation. For example, confirmation bias may lead us to focus only on evidence that supports our expectations, while apophenia causes us to see patterns where none exist. Similarly, hindsight bias can trick us into believing past patterns were obvious, which can develop overconfidence in future decisions. Awareness of these biases allows us to approach technical tools and charts with greater objectivity, with more focus on probabilistic methods and calculated risks.
Experiment: Random Levels
Perform the following experiment; open a chart and hide the price data. Then draw a few horizontal lines at random levels.
Then reveal the price again. You’ll notice that price can touch or reverse near these lines, as if they were relevant levels.
The same thing can happen with various indicators and tools. This experiment shows how easy it is to find confluence by chance. It also raises an important question, is your equipment and approach to the markets more reliable than random?
Market Disorder
Financial markets consist of various participants including banks, funds, traders and algorithmic systems. These participants operate with different objectives and across multiple timeframes resulting in a wide range of interpretations of market behavior. Trades are executed for various reasons such as speculation, hedging, rebalancing, liquidation or automation; directional intent could be unclear. For instance, the prior may serve to offset exposure, and portfolio rebalancing could require the execution of large orders without directional intent.
Technical and chart-based trading likely makes up a minor segment of the overall market; even within this subset, there is considerable variation in perception and interpretation. There could be differences in timeframe, reference points, pattern relevance and responses to similar information. The market is broader, more complex and less definitive than it appears. The point is that markets contain a high degree of structural disorder, which means most assumptions should be questioned and perceived as estimative.
The effect of buying and selling pressure on multiple timeframes sets the foundation for oscillation in price movements, rather than linear and monotonic movements. This pattern of rising and falling in a series of waves sets the points for where the current structure transitions between balance and imbalance. An overall equilibrium between buying and selling pressure results in consolidative price movement, whereas dominance leads to trending or progressive movement.
Volatility Distribution
To answer the main question: What differentiates real market behavior and charts from random data, and ultimately makes it tradable, is the distribution of volatility. This forms the basis for the phenomenon of volatility clustering, where periods of high volatility tend to follow high volatility, and low volatility follows low volatility. It is rare for the market to shift into a volatile state and then immediately revert to inactivity without some degree of persistence. Research supports the presence of this volatility persistence, though with the important caveat that it does not imply directional intent.
Volatility Cycles
These phases tend to occur in alternation, known as volatility cycles, which set the foundation for tradable price structures. This sequence consists of a contractive phase, marked by compression in price movements, followed by an expansive phase, characterized by increased volatility and directional movement. The alternation reflects shifts in underlying buying and selling pressure. This behavior offers a practical approach to interpret market behavior. A more detailed explanation of the concept could be explored in a future post.
Conclusion
While the idea of profitability through technical trading is often questioned, it remains a viable approach when based on sound principles. The edges available to the average trader are smaller and less frequent than commonly presumed. The concepts of volatility and the ability to locate areas of imbalance forms the basis for identifying conditions where market behavior becomes less random and more structured. This sets the foundation for developing technical edges.
The content in this post is adapted from the book The Art of Technical Trading for educational purposes.
NZDUSD: Support & Resistance Analysis and Key Levels 🇳🇿🇺🇸
Here is my latest structure analysis and
important supports & resistances on NZDUSD.
Support 1: 0.5506 - 0.5538 area
Support 2: 0.5470 - 0.5479 area
Resistance 1: 0.5644 - 0.5683 area
Resistance 2: 0.5796 - 0.5854 area
Consider these structures for pullback/breakout trading.
❤️Please, support my work with like, thank you!❤️
I am part of Trade Nation's Influencer program and receive a monthly fee for using their TradingView charts in my analysis.

Ripple May Face Another Rally This YearRipple with ticker XRPUSD hit all-time highs for the final blue wave V as expected, so we should be aware of limited upside this year. However, despite recent slowdown, which we see it as an ABC correction within red subwave (IV), there can still be room for another rally this year, at least up to 4-5 area to complete final subwave (V) of V of an impulse on a daily chart.

Gbp/Usd Harmonic PatternFX:GBPUSD
Bearish bat pattern in making TF 30 mins
Market is completing it's C-D leg .
After completion of C-D leg , take sell trade and target for 0.382%

BTC/USD Forming Bullish Falling Wedge – Potential Target📐 2. Technical Pattern – Falling Wedge
A falling wedge forms when the price consolidates between two converging downward-sloping trendlines. It suggests diminishing selling pressure and a likely reversal.
Key Characteristics in This Chart:
Upper Resistance Trendline: Formed by connecting the series of lower highs.
Lower Support Trendline: Formed by connecting the lower lows.
The price respects both boundaries, confirming wedge structure.
Volume generally decreases during the wedge (implied but not shown).
✅ Bullish Implication: Once price breaks above the upper resistance, it often triggers a sharp upward move due to the squeeze of supply and the build-up of demand.
🧱 3. Support and Resistance Zones
🔻 Resistance Zone:
Area: ~100,000 to ~108,000 USD
Marked as a wide horizontal band (beige-shaded area).
Previous price peaks and consolidations suggest this zone is strong supply.
Breakout above this zone could trigger momentum towards the higher target.
🔹 Support Zone:
Area: ~72,000 to ~75,000 USD
Historical reaction level where buyers previously stepped in.
Coincides with the lower wedge boundary and recent bounce points.
Repeated tests strengthen this as a reliable accumulation zone.
🎯 4. Trade Setup Strategy
💼 Entry Strategy:
Trigger: A confirmed breakout above the wedge’s upper trendline (black diagonal line).
Confirmation: A strong bullish daily close above the trendline, ideally with volume spike.
The current price (~77,130) is near the lower boundary—offering a potential early entry or low-risk setup with a tight stop.
📌 Stop-Loss Placement:
Level: 70,916 USD
Below the wedge’s lower support and beneath the broader support zone.
Ensures exit if the pattern fails or bears regain control.
🧭 Target Projection:
Target Price: 114,562 USD
Based on the height of the wedge projected from the breakout point, a standard wedge breakout measurement.
Aligns with historical highs and psychological resistance.
🧮 Risk-Reward Ratio: Assuming entry around 77,130:
Risk (Stop-Loss): ~6,200 points
Reward (Target): ~37,432 points
R:R Ratio ≈ 1:6 – Highly favorable
⚙️ 5. Market Psychology & Price Action Insight
The falling wedge pattern suggests exhaustion of sellers.
Buyers are defending the support zone aggressively—creating higher lows within the wedge.
Each bounce is slightly more aggressive, indicating growing bullish sentiment.
A breakout from the wedge could act as a catalyst for rapid price acceleration as sidelined bulls enter and shorts cover.
📊 6. Summary of the Setup
Component Detail
Pattern Falling Wedge (Bullish)
Timeframe 1-Day Chart
Entry Point Breakout above upper trendline
Stop Loss 70,916 USD
Target 114,562 USD
Support Zone 72,000–75,000 USD
Resistance Zone 100,000–108,000 USD
Risk/Reward Approx. 1:6
Bias Bullish
📌 Final Thoughts
This setup provides a technically sound opportunity with clear invalidation (stop loss) and a well-defined profit target. The risk-to-reward ratio is attractive, and the price structure suggests a bullish reversal is likely, pending a confirmed breakout.

Levi Strauss Drops to $13.5 Despite Strong Q125 Earnings Report Levi Strauss & Co. (NYSE: NYSE:LEVI ) closed at $13.50 on April 7, falling 2.81%. Despite strong Q1 results, macroeconomic pressures and tariff-related uncertainties weighed on the price.
In its Q125 earnings report released on April 07th, 2025, the company reported a 9% organic net revenue growth in Q1 2025. Direct-to-consumer sales rose 12%, driven by strong e-commerce activity. Wholesale revenue increased 5%, with the U.S. segment growing by 8% and international sales rising 9%.
Levi achieved a record gross margin of 62.1%, up 330 basis points from last year. Adjusted EBIT margin expanded by 400 basis points to 13.4%. The adjusted diluted EPS came in at $0.38, marking a 52% year-over-year increase.
SG&A expenses grew 2% to $744 million while inventory levels were up 7% from last year. The company also declared a dividend of $0.13 per share, up 8%.
In regional performance, the Americas led with an 11% increase in revenue. The U.S. segment alone contributed an 8% rise. Europe posted a 3% gain, led by growth in the UK and Germany. Asia saw a 10% revenue increase, with a 14% boost in direct-to-consumer sales.
Despite strong numbers, challenges persist. The company shut down 21 net stores, including 51 franchisee locations in China. The China business was flat year-over-year. Moreover, tariff-related risks remain a concern, potentially impacting pricing and margins.
Technical Analysis: Stock Near Double Support in Descending Channel
NYSE:LEVI is trading within a descending channel from its $24.34 high recorded in June 6th 2024. Price action shows consistent lower highs and lower lows. Currently, the stock is approaching a double support zone around $12.0 to $13.0. This area has acted as a strong floor in past cycles.
Its 3-day RSI currently reads at 26.32, signaling oversold conditions. This could indicate a potential bounce if the support zone holds.
If the price breaks below the $12.0 level, the next downtrend could open and target the $11 or $10 psychological level.
Next Move: Bullish Breakout or Bearish Continuation?
Should the price hold support, a short-term reversal may follow, with resistance at $15.25, and then the descending channel upper band at around $17.00.
A confirmed break above $17.00 would shift momentum to the upside. Until then, the downtrend remains intact. Volume during the recent drop reached 10.7 million shares, showing strong selling interest.
The next earnings report is expected between June 24 and June 30. Watch for signs of reversal or further decline near this key support.

Ethereum Future: Limited Upside Ahead?Ethereum price dropped roughly 25% since April 2 due to an overall market crash following Trump’s tariffs implementation.
Compared to the almost 40% drop back in February after the first tariff announcement, this time the correction wasn’t as harsh or brutal.
So what can we expect next from Ethereum in the coming weeks?
The main hope for ETH price remains the upcoming Pectra upgrade.
Historically, major Ethereum upgrades have acted as bullish catalysts — for example, ETH roughly doubled in price ahead of both the Merge and the Shanghai upgrade.
If history rhymes, we could see a similar pre-upgrade pump this time too.
However, even if that rally materializes, I expect it to be limited to the $3,000–$3,400 range. The market lacks the kind of momentum or macro tailwinds needed to push ETH beyond 4k in this cycle — unless there’s a major shift in sentiment.
Overall, I remain cautious. The broader crypto market seems to be rolling over, and Ethereum hasn't even reclaimed its ATH.
With the next bear cycle approaching, long-term bullish targets might need to be revised — at least for now.
Short-term bounce possible thanks to Pectra hype, but don’t expect miracles. ETH likely capped below 3.4k unless something big changes.

ETH ANALYSIS🔮 #ETH Analysis :: Support & Resistance Trading
💲💲 #ETH is trading between support and resistance area. If #ETH sustains above major support area then we will a bullish move and if not then we will see more bearish move in #ETH then could expect a pullback.
💸Current Price -- $1564
⁉️ What to do?
- We have marked crucial levels in the chart . We can trade according to the chart and make some profits. 🚀💸
#ETH #Cryptocurrency #DYOR

GOLD MARKET OUTLOOK – Investor Panic After Fake News🟡 GOLD MARKET OUTLOOK – Investor Panic After Fake News, Bearish Bias Remains
📉 Current Strategy: Focus on SELL setups at key resistance zones – short-term bearish outlook remains valid
📌 US Session Recap:
Gold saw a sharp sell-off after a fake news report circulated about the US delaying its planned tariff policy.
→ While the White House later confirmed it was misinformation, the damage was done — panic selling hit across global markets.
💥 As a result, gold dropped aggressively and reached the 295x zone, aligning perfectly with AD’s previous short bias.
Meanwhile, US equities also continued to bleed red.
🧠 Market Sentiment: “Cash is King” is Back
With global instability and fear on the rise:
🔹 Investors are hoarding cash
🔹 USD demand increases, along with inflows into US government bonds
🔹 Risk assets like gold, stocks, and crypto are being dumped
💡 This could be part of Trump’s larger play — forcing global capital to flow back into US Treasuries while applying pressure on speculative markets.
🔮 AD’s View:
Unless we see a clear shift in investor sentiment, the base case remains: → Sell rallies through midweek, then reassess.
🧭 Key Technical Zones to Watch:
🔺 Resistance: 3005 – 3016 – 3035 – 3056 – 3076
🔻 Support: 2980 – 2969 – 2956 – 2930 – 2912
🎯 TRADE PLAN:
🟢 BUY ZONE: 2930 – 2928
SL: 2924
TP: 2934 – 2938 – 2942 – 2946 – 2950
🔴 SELL ZONE: 3034 – 3036
SL: 3040
TP: 3030 – 3026 – 3022 – 3018 – 3014 – 3010 – ???
📌 Keep an Eye on DXY:
The US Dollar Index is currently testing a major 3-year support level.
→ If equities fail to recover and fear persists, DXY could bounce — and gold would likely continue its correction lower.
⚠️ Final Note:
We’re in a highly volatile and uncertain environment.
→ Stick to the plan. Respect your SL/TP levels. Avoid emotional decisions.
—
📣 Found this perspective useful? Follow for daily macro-backed trade ideas and real-time market structure breakdowns.
Clarity. Consistency. Risk Management.
— AD | Money Market Flow

Gold Rejects Channel Highs — Retracement to $3,000 Before HigherGold has printed another clean rejection at the upper boundary of a short-term ascending channel on the 6H timeframe. This latest rejection adds further validity to the structure, suggesting that we may now see a healthy technical pullback toward the equilibrium line of the channel — and potentially down to the lower support boundary near the $3,000 psychological level.
Technical Outlook:
Another rejection from channel resistance confirms structural validity.
1:4 risk-to-reward short opportunity with clear invalidation and confluence.
Targets:
– TP1: $3,005 — channel midline + psychological level
– TP2: $2,955 — previous swing high + dynamic quarterly support
$3,000 psychological levels are often retested before continuation.
Fundamentals & Geopolitical Context (as of April 1, 2025):
Gold's Macro Bull Trend Remains Intact
Despite this short-term setup, the broader macro backdrop continues to support gold:
– Central banks accumulating gold amid global de-dollarization
– Real yields remain negative across key regions
– Oil trading above $100 fuels inflationary pressure
Geopolitical Flashpoints Supporting Volatility
– Russia-Ukraine war shows no signs of easing
– Middle East tensions rising (Israel–Hezbollah conflict)
– Taiwan-U.S.-China escalation continues post-military exercises
Bitcoin Weakness = Gold Rotation Potential
– BTC struggling at $70K, showing early signs of distribution
– Miner pressure increasing ahead of halving
– Targeting possible correction to $50K = capital rotation into gold
Conclusion:
Technical rejection at resistance aligns with macro expectations of a short-term pullback.
$3,000 key psychological level likely to be retested before further upside.
Gold remains in a macro bull market; this move is likely corrective within a larger expansion leg.
Long Term Gold Bull Target $4,200:
Previous Long (Target hit and closed at $3,100):
Previous Intra Long (Target hit and closed at $3,100):

GBPUSD: Pullback From Support 🇬🇧🇺🇸
GBPUSD is likely to pull back from a key daily support.
I see a strong bullish pattern on an hourly time frame -
a double bottom formation.
Goal - 1.2825
❤️Please, support my work with like, thank you!❤️
I am part of Trade Nation's Influencer program and receive a monthly fee for using their TradingView charts in my analysis.

#NIFTY Intraday Support and Resistance Levels - 08/04/2025Gap up opening in nifty. After opening if nifty sustain above 22500 level then possible upside move upto 22750+ level in opening session. 22750 level will act a strong resistance expected reversal from this level. If nifty starts trading below 22400 then possible sharp downside rally upto 22050 in today's session.

Tue 8th Apr 2025 USD/CAD Daily Forex Chart Buy SetupGood morning fellow traders. On my Daily Forex charts using the High Probability & Divergence trading methods from my books, I have identified a new trade setup this morning. As usual, you can read my notes on the chart for my thoughts on this setup. The trade being a USD/CAD Buy. Enjoy the day all. Cheers. Jim

Gold (XAU/USD) 4H Analysis – Bullish Momentum Building Up?**Gold (XAU/USD) | 4H Chart | Bullish Bias**
Gold continues to shine as it builds a solid bullish structure on the 4H timeframe. After a healthy pullback, price has bounced back strongly, holding above key support zones and aiming higher.
**What's happening now?**
- Price is forming *higher highs and higher lows*, respecting the bullish trendline.
- Strong demand kicked in around the *$2,950* zone — a key level to watch for potential pullbacks.
- The next resistance lies near *$3,050*, a psychological and technical level that could act as the next target for buyers.
**Technical Confluence:**
- *Fibonacci retracement* aligns with recent pullbacks around $2,950 – offering strong support.
- *RSI* is hovering above 50, confirming ongoing bullish momentum.
- Price remains above the *50-period EMA*, supporting the uptrend.
---
**Bullish Scenario:**
If gold holds above $2,950 and breaks above $3,010 with volume, we could see a push toward *$3,050–$3,070* in the short term.
**Invalidation:**
A confirmed break below *$2,940* could weaken the bullish outlook and shift momentum.
---
**Educational Insight:**
In trending markets, pullbacks to key zones like Fibonacci levels or prior support often offer higher-probability trades. Instead of chasing breakouts, look for *retests* with confirmation.
---
What’s your take on gold right now? Are we headed toward new highs or due for a pause?

Nightly $SPY / $SPX Scenarios for April 8, 2025🔮 🔮
🌍 Market-Moving News 🌍:
🇺🇸📊 NFIB Small Business Optimism Index Release: The National Federation of Independent Business (NFIB) will release its Small Business Optimism Index for March at 6:00 AM ET. This index provides insights into the health and outlook of small businesses, which are vital to the U.S. economy.
🗣️ Federal Reserve Speeches:
San Francisco Fed President Mary Daly is scheduled to speak at 8:00 AM ET.
Chicago Fed President Austan Goolsbee will deliver remarks at 7:00 PM ET.
📊 Key Data Releases 📊
📅 Tuesday, April 8:
📈 NFIB Small Business Optimism Index (6:00 AM ET):
Forecast: 100.7
Previous: 102.8
Assesses the health and outlook of small businesses, which are vital to the economy.
⚠️ Disclaimer: This information is for educational and informational purposes only and should not be construed as financial advice. Always consult a licensed financial advisor before making investment decisions.
📌 #trading #stockmarket #economy #news #trendtao #charting #technicalanalysis

Bitcoin Signal for Short Lets Make Some Real GameThis is an educational trading setup for Bitcoin (BTC/USD), focusing on a short position opportunity between the $82,000 and $80,000 price levels. The analysis is based on technical indicators, price action strategies, and current market sentiment. Please note: this is not financial advice, strictly for learning purposes!
📉 Trade Concept:
Entry Zone: $82,000
Target Zone: $80,000
Setup Type: Short / Sell
Timeframe: Short-term / Intraday
Market Context: After an extended bullish rally, BTC/USD is showing signs of exhaustion near key resistance. High probability retracement expected towards the $80,000 support area.
🔍 Educational Insights:
Technical Indicators: Overbought RSI levels, bearish divergence, and candlestick reversal patterns around $82,000 zone.
Psychological Levels: $80,000 is a major psychological number where buyers may step in.
Risk Management: Always use stop-losses and proper risk-reward ratios in live trades.
💡 Purpose of Sharing:
This setup is shared purely for educational purposes to help traders understand how to spot potential short opportunities in volatile markets like Bitcoin. Learn how to analyze resistance zones, manage risk, and read price action effectively.
📢 Disclaimer:
This is not financial advice. For educational purposes only. Always do your own research and consult with a professional before making financial decisions.
#Bitcoin #BTCUSD #CryptoAnalysis #ShortTrade #BitcoinSignal #PriceAction #Educational #TradingStrategy #TechnicalAnalysis #CryptoEducation #LearnTrading #RiskManagement

Bitcoin Falls Below $75,000, Impacting Crypto-Exposed StocksBitcoin (BTC) slipped under $75,000 on Monday as fresh U.S.-China trade tensions rattled markets. The drop followed President Donald Trump’s announcement of new tariffs on Chinese goods. Beijing responded swiftly, increasing fears of a prolonged trade war.
Bitcoin fell to a daily low of $74,500 before recovering to trade near $79,000. This marked its lowest level since November 2024. Before the drop, Bitcoin had consolidated around $85,000 for several weeks.
The crypto market lost 7% of its total market capitalization in 24 hours. Coinglass data showed $1.61 billion in crypto liquidations. Bitcoin dominance rose slightly to 62.62%.
Ethereum (ETH) and XRP also recorded sharp losses. Ethereum briefly dropped below $1,500 but rebounded above support. XRP fell over 10%, currently trading at $1.8710.
Meme coins and altcoins mirrored the losses. Nearly all top-30 tokens saw double-digit declines. Derivatives traders reduced exposure, with open interest falling 10% to $91.19 billion.
Crypto-Exposed Stocks Take a Hit
Stocks tied to crypto followed Bitcoin’s slide. Shares of Coinbase Global (COIN), Marathon Digital (MARA) and Robinhood (HOOD) all declined. Strategy Inc. (MSTR), formerly MicroStrategy, dropped 9.24% in pre-market trading. The company holds a large Bitcoin treasury, making it sensitive to BTC movements.
However, chipmaker Nvidia (NVDA) rose 3.5% in a minor rebound. The stock had fallen 14% the previous week, its worst since January 2024. Nvidia remains down 27% year-to-date.
Technical Analysis: Bitcoin Retests Key Levels
Bitcoin has remained bearish since hitting an all-time high of $109,000 in January. The recent slide takes BTC back to levels last seen in November 2024. Despite temporary bounces, the market continues to trend downward.
BTC is now hovering above $78,000 but may head toward $71,000 support. This level could provide a base for a potential rally. A move below $71,000 could trigger further declines.
Recovery Depends on Macro Conditions. Traders are watching for new developments and macroeconomic data. The market needs positive catalysts to reverse bearish sentiment. Sentiment remains fragile after Trump’s tariffs and fears of global slowdown. The future of the crypto market under Trump’s administration is uncertain.

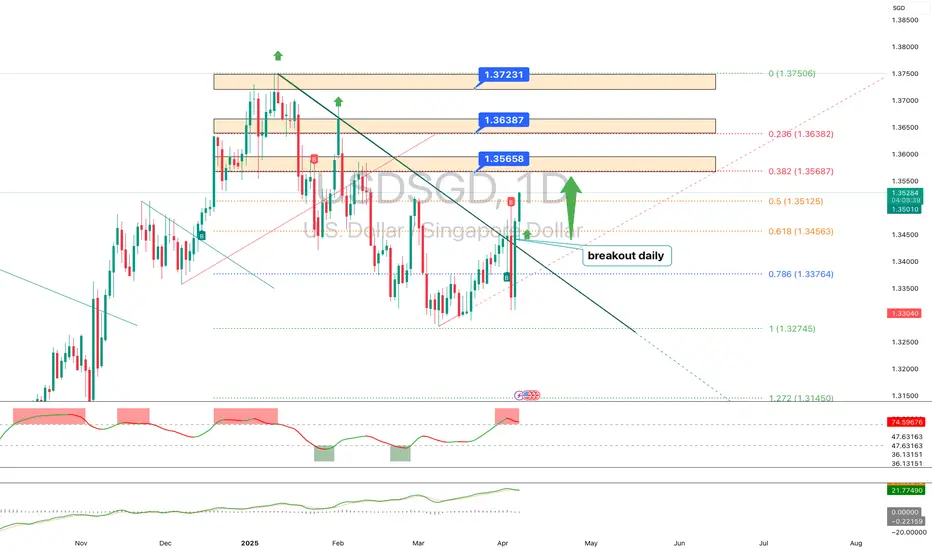
USDSGD – Technical Analysis (1D)USDSGD has broken out of a descending trendline on the daily timeframe – signaling a potential shift in short-term momentum. Price has held above 1.3510, confirming the breakout and opening the door to resistance zones at 1.3565–1.3638 (aligned with 0.382 and 0.236 Fibonacci levels).
If bulls stay in control, next targets lie at 1.3723 and 1.3750. However, a short pullback toward the 1.3450–1.3480 support zone (0.618 Fibo) is also possible.
🔹 Main scenario: continuation to 1.3565 → 1.3638 → 1.3723.
🔹 Alternative scenario: drop below 1.3450 toward 1.3376 or 1.3274.
EURCHF: One More Gap 🇪🇺🇨🇭
One more gap is going to be filled today.
EURCHF violated a resistance line of a narrow consolidation range
on an hourly time frame.
It looks like the price is heading towards a gap down opening level now.
Goal - 0.9429
❤️Please, support my work with like, thank you!❤️
I am part of Trade Nation's Influencer program and receive a monthly fee for using their TradingView charts in my analysis.

AUDCAD: True Bullish Reversal?! 🇦🇺🇨🇦
AUDCAD formed a nice inverted head and shoulders pattern
after a test of a key historic support.
A bullish violation of its neckline with a strong bullish candle
provides a reliable confirmation.
I expect a correctional move at least to 0.8723
❤️Please, support my work with like, thank you!❤️

Bitcoin’s Make-or-Break Moment: Eyes on $70KBitcoin price almost reached the $74k support area, which is critical for the bull run continuation.
This zone has acted as a strong resistance in the past, and a clean bounce from here could signal renewed strength and confidence in the market.
However, if this support fails to hold and BTC closes the weekly candle below the $70k level, it would likely mark the end of the current bull phase and signal the beginning of a distribution phase or even the early stages of a new bear market.
That doesn’t necessarily mean Bitcoin will crash straight to $50k — corrections are rarely that linear. But it would drastically reduce the chances of seeing new all-time highs in this cycle.
The next rally, if it happens, would probably be more muted and shorter-lived.
Hopefully BTC will manage to avoid this scenario and hold above the support area.
On the positive side, if BTC holds above $70k and we see strong demand stepping in, it could set the stage for a healthy bounce and continuation of the uptrend.
Still I expect that BTC will test 70k level and if we see strong buying pressure on that level we can expect some recovery.

Ethereum 20% Crash: Temporary Setback or a Buy Opportunity?Hello, Traders!
Ethereum experienced a significant drop, plunging over 20% in just one day and hitting its lowest point since last August.
ETH price found strong support at $2130 and I don’t expect further downfall beyond this level unless broader market conditions deteriorate.
One of the key technical developments was Ethereum breaking the crucial $2800 support zone, which is a bearish signal for the continuation of the uptrend.
However, a quick recovery above this level could reignite bullish momentum and bring buyers back into the market. W
atching how ETH reacts to this resistance will be crucial in the coming days.
The main catalyst for this sell-off was Trump’s decision to impose tariffs on Canada, Mexico, and China, which triggered a broader risk-off sentiment in global markets.
The crypto space, being highly sensitive to macroeconomic events, saw a sharp reaction, with Ethereum and other major altcoins suffering deep corrections.
Despite the current bearish outlook, there is one major reason why Ethereum is likely to recover quickly — the upcoming Pectra upgrade, set to take place next month.
Historically, ETH has seen strong rallies leading up to major network upgrades, and I expect a similar pattern to unfold this time.
If the market stabilizes and sentiment shifts, Ethereum could reclaim lost ground and resume its long-term bullish trajectory.
For now, the key levels to watch are $2130 as support and $2800 as resistance.
A break above $2800 could signal a strong reversal, while failure to hold $2130 might open the door for deeper corrections
Please don’t forget to boost this idea and leave your comments below.

Bitcoin drops. What's next?Hello, Traders!
Bitcoin price continues to fall towards the next big support area at 74k-70k.
Currently, there is no sign of BTC reversal, and it seems that this correction phase will last long.
Ideally, the faster BTC finds its local bottom, the faster it starts to rise again.
However, the current market conditions suggest that a period of consolidation might be necessary before a meaningful recovery.
I doubt that the BTC price will fall below 70k despite all the negative sentiment surrounding it at the moment.
More likely, we will see strong buying pressure at those levels, as institutional investors and long-term holders step in to accumulate at what they perceive as a discount.
Also, the stochastic RSI on a weekly scale has dropped to 0, which historically indicates that momentum is oversold and a potential reversal could be near.
If we see a bullish cross on the SRSI on a weekly timeframe, this might act as a catalyst for a price rebound, possibly pushing BTC toward new highs.
Another indication of a possible bottom is the Fear & Greed Index, which currently sits at around 20.
This level reflects extreme fear in the market, a condition that has often preceded local bottoms in previous cycles.
Historically, such extreme fear tends to trigger a shift in sentiment, leading to increased demand and a subsequent price recovery.
Furthermore, on-chain metrics suggest that long-term holders remain unfazed by the recent downturn, with exchange reserves continuing to decline. This indicates that a significant portion of BTC supply is being moved to cold storage, reducing selling pressure.
Additionally, open interest in the futures market has seen a decline, which could mean that excessive leverage is being flushed out—a necessary step for a healthier market structure.
If BTC manages to hold the 70k support level and confirms a reversal with increasing volume, we could see a strong recovery phase unfold.
However, if the price breaks below this key support, the next significant area to watch would be around 65k, where additional buying interest might emerge.
Please don’t forget to boost this idea and leave your comments below.
