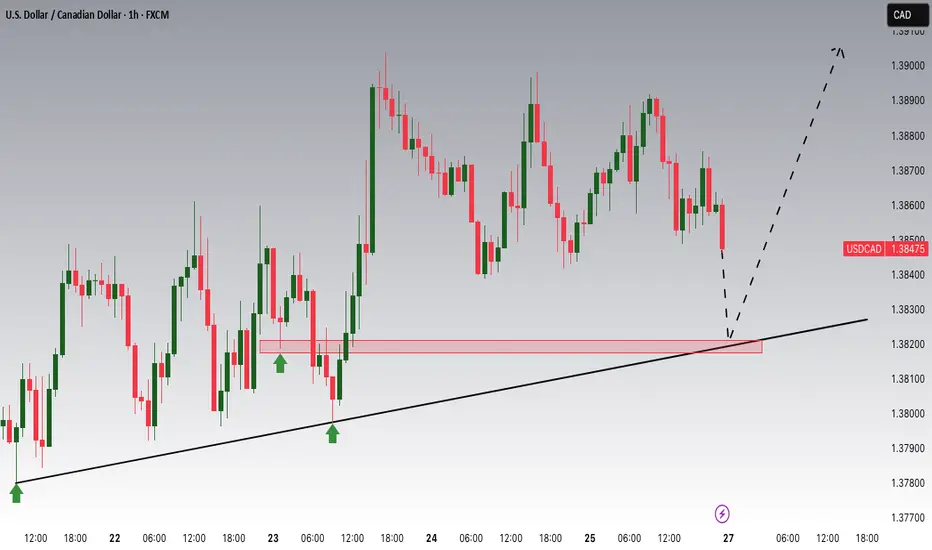
CADCHF: Still Bullish 🇨🇦🇨🇭
Last week, I shared a very bullish outlook for CADCHF
based on a breakout and a retest of a key daily structure.
I keep holding a long trade on the pair and still expect growth.
Goal - 0.602
❤️Please, support my work with like, thank you!❤️
I am part of Trade Nation's Influencer program and receive a monthly fee for using their TradingView charts in my analysis.
Technical Analysis

EURCHF: Pullback From Support 🇪🇺🇨🇭
There is a high chance that EURCHF will bounce
from a recently broken horizontal resistance.
After a breakout, it turned into support with a high probability.
As a confirmation signal, I see a tiny cup & handle pattern
on an hourly time frame and intraday bullish imbalance.
Goal - 0.9422
❤️Please, support my work with like, thank you!❤️
I am part of Trade Nation's Influencer program and receive a monthly fee for using their TradingView charts in my analysis.

XAUUSD Downtrend Continues- Is 3,175 the Next Stop?OANDA:XAUUSD is currently trading within a well-defined descending channel, with price action consistently forming lower highs and lower lows. This structure reflects sustained bearish momentum, and sellers continue to dominate the overall direction.
The recent upward move appears to be a technical rebound, with price approaching a potential resistance zone near the upper boundary of the channel. This area may now serve as a supply zone after acting as previous support, making it an important region for potential rejection.
If the resistance holds, a rejection here could lead to the continuation of the bearish trend, with a potential move targeting the support area around 3,175, aligning with the lower boundary of the descending channel.
However, failure to hold below this level could invalidate the bearish scenario and increase the likelihood of a retest toward the upper boundary of the channel.
Traders should monitor for clear rejection signals at resistance, such as bearish engulfing candles or strong rejection wicks, or alternatively, wait for breakout confirmation before considering a trend shift. As always, proper risk management remains essential.

#NIFTY Intraday Support and Resistance Levels - 28/04/2025Nifty will open gap up in today's session. Expected opening near 24200 level. After opening if 24150-24250 zone will act as a consolidation for today's session. Any strong upside rally only expected if nifty starts trading and sustain above 24250 level. Downside movement expected if nifty starts trading below 24150 level. Below this level downside move expected upto 23850 support level in today's session.

[INTRADAY] #BANKNIFTY PE & CE Levels(28/04/2025)Today will be gap up opening expected in banknifty. Expected opening near 54950 level. After opening it will face immediate resistance at this level and possible downside movement in index. Downside 54450-54550 zone will act as a support for today's session. After breakdown of this support zone can lead banknifty further downside upto 54050 level in today's session. Any strong bullish side rally only expected if banknifty starts trading and sustain above 55050 level.

BTC ANALYSIS (update)📊 #BTC Analysis : Update
✅As we said earlier, #BTC performed same. Around 22% bullish move done after the analysis. Now we can see that #BTC is trading around a mmajor resistance. We could expect around 10% bullish move if it sustain above its major resistance area
👀Current Price: $94,590
🚀 Target Price: $1,04,476
⚡️What to do ?
👀Keep an eye on #BTC price action and volume. We can trade according to the chart and make some profits⚡️⚡️
#BTC #Cryptocurrency #TechnicalAnalysis #DYOR

Weekly $SPY / $SPX Scenarios for April 28 – May 2, 2025🔮 🔮
🌍 Market-Moving News 🌍
🇺🇸 President Trump's 100th Day in Office: Wednesday marks President Trump's 100th day of his second term. His administration's protectionist tariffs continue to influence global markets and political landscapes, with notable impacts observed in Canada, Australia, and the UK.
📉 Trade Tensions and Economic Indicators: Investors are closely monitoring the effects of recent U.S. tariffs on economic performance. Key data releases this week, including GDP and employment figures, will provide insights into the economy's resilience amid these trade policies.
💼 Major Corporate Earnings: This week features earnings reports from major companies, including Apple, Amazon, Microsoft, Meta Platforms, ExxonMobil, and McDonald's. These reports will offer a glimpse into how large corporations are navigating current economic challenges.
📊 Key Data Releases 📊
📅 Monday, April 28:
🏠 Housing Vacancies and Homeownership (10:00 AM ET):
Provides data on rental and homeowner vacancy rates, offering insights into housing market dynamics.
📅 Tuesday, April 29:
📈 Advance Economic Indicators (8:30 AM ET):
Includes data on international trade in goods, wholesale inventories, and retail inventories for March.
📊 Consumer Confidence Index (10:00 AM ET):
Measures consumer sentiment regarding current and future economic conditions.
💼 JOLTS Job Openings (10:00 AM ET):
Reports the number of job openings, indicating labor market demand.
📅 Wednesday, April 30:
📈 GDP (Q1 Advance Estimate) (8:30 AM ET):
Provides an early estimate of economic growth for the first quarter.
💳 Personal Income and Outlays (10:00 AM ET):
Includes data on personal income, consumer spending, and the PCE price index, the Fed's preferred inflation measure.
🏭 Chicago PMI (9:45 AM ET):
Assesses business conditions in the Chicago region, reflecting manufacturing sector health.
📅 Thursday, May 1:
🏗️ Construction Spending (10:00 AM ET):
Reports total spending on construction projects, indicating economic activity in the sector.
📉 Initial Jobless Claims (8:30 AM ET):
Measures the number of new filings for unemployment benefits, reflecting labor market
conditions.
🏭 ISM Manufacturing PMI (10:00 AM ET):
Provides insight into the manufacturing sector's health through a survey of purchasing managers.
📅 Friday, May 2:
👷 Nonfarm Payrolls (8:30 AM ET):
Reports the number of jobs added or lost in the economy, excluding the farming sector.
📉 Unemployment Rate (8:30 AM ET):
Indicates the percentage of the labor force that is unemployed and actively seeking
employment.
🏭 Factory Orders (10:00 AM ET):
Measures the dollar level of new orders for both durable and nondurable goods, indicating manufacturing activity.
⚠️ Disclaimer: This information is for educational and informational purposes only and should not be construed as financial advice. Always consult a licensed financial advisor before making investment decisions.
📌 #trading #stockmarket #economy #news #trendtao #charting #technicalanalysis


EURJPY ANALYSISIn this video we see a break down of the pair coming into a new week after seeing last week close as a bullish engulfing and the structure on the 4hr showing HH and HL which is a confirmation of bullishness.

S&P 500: Key Levels and Potential ScenariosThis analysis of S&P500 will explore both bullish and bearish scenarios, incorporating key levels and considering possible market and crowd psychology.
Bullish Scenario: Potential Uptrend Resumption
From a bullish perspective, if the S&P 500 maintains a position above the 5482 level, it could suggest a potential end to the current correction and a resumption of the major uptrend. A hold above 5482 might reinforce bullish sentiment, encouraging further buying activity, as traders may view this as confirmation of renewed strength. The index could then potentially retest the 5801 level, where it's possible that the index may encounter resistance on the first attempt. A successful break above 5801 would then open the path towards the 6135 zone, which represents a key upside target.
Bearish Scenario: Potential Retest of Support Zones
Conversely, if the S&P 500 fails to hold above the 5482 support level might trigger increased selling pressure, as traders liquidate positions. The index could then potentially retest the 5092 to 4833 support zone. This zone represents a critical area where buyers may step in, but a break below it would signal further weakness.
Concluding Remarks
In conclusion, the S&P 500's price action around the identified key levels will be crucial in determining its short- to medium-term direction. A sustained hold above 5482 could favor a bullish continuation towards 5801 and potentially 6135, while a break below 5482 might lead to a retest of the 5092 to 4833 support zone.

$EBAY $80 EOYA non factor amongst tariff rhetoric. I think the idea of US consumers (even internationally) buying and reselling has never been higher. I think a lot of consumers will start to look for used goods more than ever. I'm eyeing $70 calls for earnings this upcoming week (first week of May 2025) and if it has any pull back I will load the boat for $80 call leaps. I like the structure it's held at this $55-$65 range. I expect new highs on this name maybe earnings can give it a jolt. All the lines you see are 20, 50, 200 SMA and EMA. I could be wrong on earnings as this name tends to dip from earnings even posting beats but that's the gamble of earnings but LONG TERM this name is a good buy. Charts are Monthly and Daily.
WSL.

TAO ANALYSIS📊 #TAOAnalysis
✅There is a formation of Descending Channel Pattern in daily time frame in #TAO .
Also there is a perfect breakout and retest. Now we can expect a bullish move. If the price sustains the major resistance zone then we will see more bullish move
👀Current Price: $349
🎯 Target Price : $460
⚡️What to do ?
👀Keep an eye on #TAO price action and volume. We can trade according to the chart and make some profits⚡️⚡️
#TAO #Cryptocurrency #Breakout #TechnicalAnalysis #DYOR

GOLD WEEKLY - Key Events to Watch: ADP, Core PCE, Non-Farm📌 Weekly Gold Outlook – Key Events to Watch: ADP, Core PCE, Non-Farm Payrolls 📉📈
🌍 Fundamental Overview
Last week, gold faced heavy selling pressure after failing to sustain its rally above the $3,450 level. Easing concerns over the US–China trade tensions and a stronger US Dollar — supported by stronger-than-expected Durable Goods Orders — triggered a sharp correction in Price.
The US Federal Reserve (Fed) continues to adopt a cautious stance, awaiting clearer economic data before adjusting its monetary policy. Meanwhile, recent figures from both the US and China show signs of economic resilience, reducing safe-haven demand for gold in the short term.
Key Events This Week:
ADP Non-Farm Employment Change
Core PCE Price Index m/m
Non-Farm Payrolls (NFP)
Volatility is expected to rise sharply as these major economic indicators are released.
📊 Technical Analysis – XAU/USD 2H Chart
Gold is currently undergoing a corrective phase after its strong rally earlier this month. Price is forming a descending channel and consolidating around critical support and resistance zones.
Immediate Resistance: 3,325 – 3,377
Immediate Support: 3,275 – 3,235
As long as Price remains capped below 3,325, the bearish bias will remain dominant.
🧩 Main Scenarios for This Week
Short-Term Rebound:
Price may retest the 3,275–3,277 area before sellers regain control.
Medium-Term Bearish Pressure:
If Price fails to reclaim the 3,325 resistance zone, it could break lower toward 3,235, 3,197, and potentially deeper into the 3,108 or 3,066 liquidity zones.
Bullish Reversal Scenario:
A sustained breakout and close above 3,377 would invalidate the bearish outlook and suggest a move toward the 3,420 target.
🔍 Key Price Zones for This Week
Resistance: 3,325 → 3,377 → 3,420
Support: 3,275 → 3,235 → 3,197 → 3,108 → 3,066
🧠 Suggested Trading Strategy
Prefer short positions when Price retraces toward the 3,275 – 3,325 resistance zone, aiming for downside targets at 3,235 and 3,197.
Be cautious with long positions: only consider buying if Price drops deeply into 3,108 or 3,066 and shows strong support reaction.
⚡ Note:
Given the upcoming releases of ADP, Core PCE, and Non-Farm Payrolls, the market is expected to experience significant volatility.
Stay disciplined and await detailed intra-week updates around key event times.

#BTC #BTCUSD #BTCUSDT #BITCOIN #Update #Analysis #Eddy#BTC #BTCUSD #BTCUSDT #BITCOIN #Update #Analysis #Eddy
I have identified the important support and resistance areas of the weekly timeframe for you.
I have identified the important resistance prices for the start of the decline with the red line and the important support prices for the start of the growth with the green line.
This analysis is based on a combination of different styles, including the volume style with the ict style.
Based on your strategy and style, get the necessary confirmations for this analysis to enter the trade.
Don't forget about risk and capital management.
The responsibility for the transaction is yours and I have no responsibility for your failure to comply with your risk and capital management.
💬 Note: An important analysis will be presented on the lower timeframe on Bitcoin soon, which, based on the chart and explanations sent in that analysis, you can hunt for Bitcoin's decline by getting confirmation, pay attention to the current chart and consider important liquidity, including the Decision and Extreme areas.
Be successful and profitable.
For altcoins, proceed according to my analysis on the Total 3 chart.
My analysis of the Total 3 chart:
You can also view and review my previous analyses on my TradingView page.
Please don't forget to like and follow, your support encourages me to continue on my path and provide more analysis and updates.

NZDUSD Potential DownsidesHey Traders, in today's trading session we are monitoring NZDUSD for a selling opportunity around 0.60000 zone, NZDUSD is trading in a downtrend and currently is in a correction phase in which it is approaching the trend at 0.60000 support and resistance area.
Trade safe, Joe.

EURUSD: Detailed Support & Resistance Analysis 🇪🇺🇺🇸
Here is my latest support and resistance analysis for EURUSD
for next week.
Consider these structures for pullback/breakout trading.
❤️Please, support my work with like, thank you!❤️
I am part of Trade Nation's Influencer program and receive a monthly fee for using their TradingView charts in my analysis.

Ethereum Up 30% — But Is This the Start of a Trend Reversal..?Ethereum Up 30% — But Is This the Start of a Trend Reversal..?
Ethereum has seen a notable bounce this month, climbing approximately 30% from its local bottom of $1,400 to its current level around $1,800. While this rally might appear promising at first glance, a deeper look at the daily timeframe reveals a more cautious picture.
Despite the recent price surge, Ethereum remains technically in a **downtrend**. A well-respected downtrend continues to hold as resistance, and ETH is currently **retesting this trendline**. This point of contact now sets the stage for two potential scenarios:
**Scenario 1: Rejection from the Trendline**
If Ethereum fails to break above the trendline, it’s likely to face **rejection**, which could send the price back toward the $1,400 level. A revisit to this support zone would form a **potential double bottom**, a classic reversal pattern. If that plays out, we could then start to look for signs of a genuine trend reversal.
**Scenario 2: Breakout Above the Trendline**
On the other hand, if ETH manages to **break through the trendline**, that alone shouldn't be a green light to go long just yet. There’s a significant resistance level sitting around **$2,100**, which has previously acted as a ceiling for price action. A true breakout would require Ethereum not only to cross this level but also to **sustain above it for 2–3 days**. Only then could a long position be considered relatively safer, with upside targets extending to **$2,800** and even **$4,000**.
**Final Thoughts**
While the recent rally is encouraging, it's essential to remain cautious. The downtrend isn't officially over until key technical levels are cleared and held. Until Ethereum breaks above both the downtrend and the $2,100 resistance zone — and proves its strength with sustained movement — the **best strategy may be to sit on the sidelines** and let the market play out.
Patience often pays in crypto — and right now, **watching closely** could be the smartest move.

GOLD(XAUUSD) -Weekly Forecast,Technical Analysis & Trading IdeasMidterm forecast:
2772.38 is a major support, while this level is not broken, the Midterm wave will be uptrend.
TVC:GOLD OANDA:XAUUSD
Technical analysis:
A trough is formed in daily chart at 2956.50 on 04/07/2025, so more gains to resistance(s) 3357.00, 3500.00 and more heights is expected.
Take Profits:
2833.00
2879.11
2955.00
3057.40
3160.00
3257.03
3357.00
3500.00
__________________________________________________________________
❤️ If you find this helpful and want more FREE forecasts in TradingView,
. . . . . . . . Hit the 'BOOST' button 👍
. . . . . . . . . . . Drop some feedback in the comments below! (e.g., What did you find most useful? How can we improve?)
🙏 Your support is appreciated!
Now, it's your turn!
Be sure to leave a comment; let us know how you see this opportunity and forecast.
Have a successful week,
ForecastCity Support Team

INJ Is Nearing An Important SupportHey Traders, in today's trading session we are monitoring INJ/USDT for a buying opportunity around 9.90 zone, INJ/USDT is trading in an uptrend and currently is in a correction phase in which it is approaching the trend at 9.90 support and resistance area.
Trade safe, Joe.

Surge Energy (SGY) Elliott Wave Outlook26/04/25 SGY Update
I’ve been long Surge Energy since Jan 24. Price did move higher initially following my entry but has since ground lower in what looks like an ending diagonal pattern in red C of a larger ABC zig zag correction. There is RSI divergence on the weekly time frame which helps the case that SGY could be bottoming, but that will of course be effected by what the price of oil does.
Any further downside on SGY I will be looking at the yellow zone which contains the 786 retracement at $3.9, measured move target of the red A wave at $3.28 & 886 retracement at $2.64. There is an ending diagonal invalidation level at $3.2, if this is tagged, I will need to adjust the current count.
The completion of Red C will complete the (X) wave of the higher degree (W)(X)(Y) in yellow, from these levels the (Y) wave target will be $16-$17.

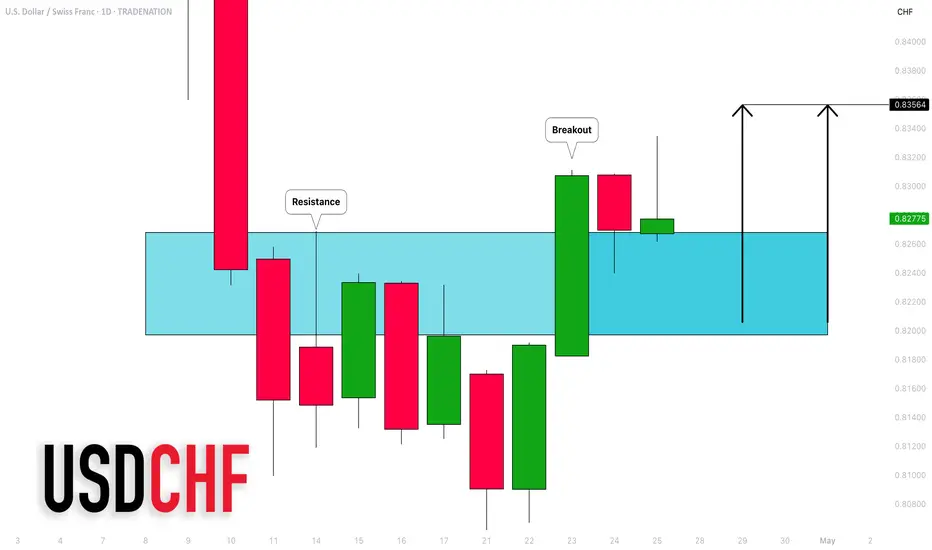
USDCHF: Important Breakout & Bullish Outlook Explained
USDCHF broke and closed above a key daily horizontal resistance area.
The broken structure most likely turned in a strong support.
I expect a bullish continuation from that next week.
Goal - 0.8356
❤️Please, support my work with like, thank you!❤️
I am part of Trade Nation's Influencer program and receive a monthly fee for using their TradingView charts in my analysis.
USDJPY: Bulls Eye Key Support as Trade Optimism Lifts DollarHey Traders, We are currently monitoring USDJPY for a potential buying opportunity as price approaches the 143.200 level, an important area that has acted as both support and resistance in recent sessions. Technically, the pair remains in a well-defined uptrend, and this pullback appears to be part of a healthy correction phase rather than a trend reversal. The 143.200 zone also aligns with a dynamic trendline support, increasing the likelihood of a bullish reaction if price holds above this level. From a fundamental perspective, recent developments have started to tilt in favor of the dollar. News of progress toward a trade agreement between the U.S. and India has sparked optimism, as it may lay the groundwork for similar deals with other key global partners. This has been compounded by unconfirmed reports out of China suggesting potential tariff exemptions in specific sectors, which has further boosted investor sentiment and triggered a broader “risk-on” shift in markets. As geopolitical tensions around trade show signs of easing, the U.S. dollar is regaining strength, fueling the case for further upside in USDJPY. Taken together, the convergence of technical support and improving macroeconomic signals presents a compelling opportunity for bulls, provided we see signs of price stability or a confirmed bounce near the 143.200 area.
Trade safe, Joe.

Bitcoin (BTC/USD) - Cup and Handle Breakout🔍 Pattern Identified: Cup ☕ & Handle 🏆 Pattern
🕒 Timeframe: 1-Hour Chart (1H)
💥 Breakout Level: Around $95,000
🎯 Projected Target: $97,073.75
📈 Technical Overview:
Bitcoin formed a rounded cup showing accumulation at lower levels.
After completing the cup, a small pullback (handle) indicated a healthy consolidation.
A strong breakout above the neckline resistance confirms the bullish pattern.
⚡ Actionable Insights:
As long as the price stays above the neckline, momentum remains positive.
A breakout generally leads to a strong continuation rally towards the projected target.
📊 Watch for volume confirmation for added strength.
⚠️ Caution if price slips back below the neckline – breakout may invalidate.
Disclosure: I am part of TradeNation's Influencer program and receive a monthly fee for using their TradingView charts in my analysis.
