use your tether and buy a cointhe static resistance has broke out but still, there is a dynamic resistance.
Tether

BNB Price AnalysisThe daily candle has violated the 427.6 support level. However, the bulls have fought back and the candle’s market price is tangling with this support. If the candle closes above this support, its sanctity is preserved and there could be an opportunity for a bounce towards 450.9. Any further recovery depends on the break of this resistance, targeting 481.2 and 511.3 in the process.
However, if a penetration close below 427.6 is the case, then the door will be opened for further selling, targeting 388.3 and potentially 328.5. If the bulls can defend this support level at 359.4 (early August 2021 highs), then there may be room for salvation at that level.

LUNAUSDTHello Crypto Lovers,
Mars Signals team wishes you high profits.
We are in the daily time frame. You see the support line S1 which has supported the price in several places where we also had a fake breakout but the price pulled itself back up. There is also the R1 resistance which has held the price down where also here it had a failed breakout but the price came back down. Now the price is back at the S1 line. You see a shadow created which shows the bulls are likely stepping in. You can buy here and set the Stop Loss at the shown area. The price can either go up to the R1 line and get rejected from there or it can break R1 and gradually move to R2.
Warning: This is just a suggestion and we do not guarantee profits. We advise you to analyze the chart before opening any positions.
Wish you luck

ICPUSDTHello Crypto Lovers,
Mars Signals team wishes you high profits.
We are in the daily time frame. We have the R1 line which the price broke and it gave us good profits. There are two scenarios for the price: 1) it will go up and break the R2 resistance and go all the way up to around $48. 2) it will be rejected from the R2 line and will fall back to the S1 line.
Warning: This is just a suggestion and we do not guarantee profits. We advise you to analyze the chart before opening any positions.
Wish you luck

ETHUSDTHello Crypto Lovers,
Mars Signals team wishes you high profits.
We are in the daily time frame. We had a resistance line R2 which the price could not break and it fell down. The price was not supported at the R1 line and it fell even more. The price is likely to fall down to the S1 line and if it stabilizes above it, it can move back up to the R1 line. You can also notice a head-and-shoulder pattern created by the price. If that is the case, then the price should first hit the S1 line, then come back up to the R1 line, and to complete the head-and-shoulder patter, it must fall down further below the S1 line.
Warning: This is just a suggestion and we do not guarantee profits. We advise you to analyze the chart before opening any positions.
Wish you luck

BTCUSDTHello Crypto Lovers,
Mars Signals team wishes you high profits.
We are in the weekly time frame. You see that the price was rejected from the R3 resistance. You can see the yellow line which was our weekly resistance, now acting as the support, which is broken. There is also the S3 line which can be a good area for supporting the price. In the daily time frame you can see the R1 line which the price has broken and also made its pullback. If it goes up, the next target would be $46K. It will do three things there: 1) It will go to $46K, make a pulllback, and then fall more. 2)It will break the resistance and go up. 3) It will range there and then come back to the S3 line. There is also another thing and that is the price has made its pullback to the weekly resistance which is now acting as the support. If this line holds the price up, then we can say that it is very likely for the price to move up to the R2 line.
Warning: This is just a suggestion and we do not guarantee profits. We advise you to analyze the chart before opening any positions.
Wish you luck

CURRENT MARKET ALERT (USDT.D) !!!This a significant caution about the market condition (still down!!!)
Manage your long positions (by adding sl). May have a entire red market tomorrow...!

Long EPIKGood buy zone. coin will 15x imo. Project has good industry relationships - that's going to be everything in the metaverse.

Head and Shoulders Bitcoins had no momentum lately. If a break below the Neckline in the 45,500 range occurs the measured move is 38,900.

Looking negative for the hodlersZoom-in on the right shoulder action, which is getting pressed by the 10 dma.
Next leg down look set to clip right through the head an shoulders neck line.

Massive Bull FlagAs you can see ETH has been Bull Flagging for a few weeks while now, rsi is in a failing wedge. I expect a nice pump in the coming weeks. PT, $6000

Shiba Inu Weekly | Full Chart Analysis After 1636% @AlanSantanaThe weekly chart for Shiba Inu (SHIBUSDT) looks pretty interesting, we have multiple strong signals so let's look at the chart.
Don't worry about hitting LIKE and FOLLOW now, first we have to see what is going on.
Shiba Inu Weekly Chart Analysis with Alan Santana
A low was hit early September for the SHIBUSDT pair.
What followed was a very strong bullish wave.
We saw a total of 1636% from bottom to top, WOW!
This all took place in just 7 short weeks or 49 days.
After a strong bullish move a correction follows.
The SHIBUSDT peak was hit on the 25-Oct. weekly candle and then we had 7 weeks of correction.
Last week we hit a new low and prices starting to bounce/recover.
This week opens above EMA10, which tells us that the short-term potential is now going towards the bulls/GREEN.
We also have a bullish engulfing candle pattern here which is a bullish signal.
The RSI is staying above 50 which is good and there is definitely room to see prices move up.
We might go to new highs or not... Too soon to say, but a bounce is surely to take place.
Feel free to hit like now...
Thanks a lot for your support.
Namaste.

Sushi Can Grow 150%+ vs TetherWe can see the classic "cup pattern" on the SUSHIUSDT chart, this can signal that the trend is about to reverse.
As you can see on the left side, each time this bottom pattern shows up prices tend to grow.
We also have a broken downtrend as we all as increasing volume and bullish indicators (strong RSI).
All these signals support higher prices.
Note: There can be a retrace before higher prices as it happens with the cup & handle pattern.
The targets are marked on the chart.
This is not financial advice.
Namaste.

Key resist coming upbulls are going to need a tweet from Elvis Presley himself to push past the red box.
As Peter Schiff just mentioned, pumping price up to give folks good talking points while they gather with family is happening now.

Exit All LongsObviously price and the MM/whales can do what they want
But this looks terrible lol
I have a bag of doge, which i believe to be a different play
But this would be the start of a long and painful crypto bear market- and might annihilate my doge play also, but that's just a little bet on some memetics
Anyways
This is an action reaction chart
Two pitchforks and resultant action reaction lines
And i believe ultimately price will follow the red arrow
TRADE AT YOUR OWN RISK OF COURSE I MAY BE WRONG

Predictjust a simple analayze.(weekly Time)
pay special attention to stoploss.
if the trend line is broken, we will have more Price correction.

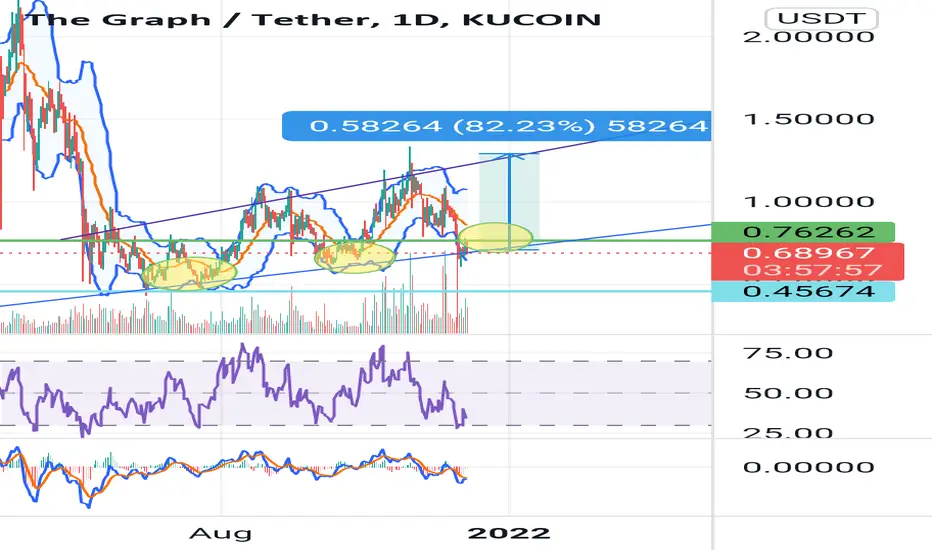
The GraphI think 82% up is coming
Everytime we have a down trend a double bottom appears (in yellow), and after that a new high.
According with this: in the next 5 days we will see the next touching support.
If that happens, time to buy.
Can FETCH recover? Bearish outlook 12/6/2021Target profit = areas of previous support...circled and highlighted in yellow.
SHORT entry at P of .53
Currently just above .51 -- so, ceteris paribus,
next stop ~ .45 followed by ~.38. Then perhaps pullback will cool down?

USDT dominance elliot wave daily Hey Guys
I just published an elliot wave of USDT.D
Please share your ideas

BITCOIN 1D FORECASTGood day guy
L.M is back with our monthly forecast and today we take a look a BITCOIN the mother of crypto. We can it "'the mother of crypto'' not only because it was the first crypto ever but also cause without it leading the way the crypto market would be totally misled. In the beginning of November BTC hit a new ATH of $69025 and mid November it started its correction from +/-$69000 to +/-$42000 which is huge dip.
It headed straight to our critical support of $40933, this support is critical because if BTC continues to drop and we break below this support and retest to confirm incoming drop we could be entering the bear market by following the RED path arrow we could be looking at new ATLs instead of new ATHs and financially its not good for anyone because investors are still waiting on the final bull run up which is going to lead us into Altseason where we get to see altcoin go parabolic.
There it would be great for everyone if the market followed the BLUE path arrow with on more leg up where we might top at $130000 to $140000 per BTC but what we are looking at is a $90000-$100000 BTC in the PURPLE path arrow, when taking a close look at the market and with the necessary calculation +$90000 Bitcoin is possible and realistic.
L.M

BITCOIN FRACTALSWe are seeing the exact same fractals play out time and time again. Trend is up, IMO here is a good time to start layering buys. Bullish divergence forming on daily but not yet confirmed as we need a few more daily closes.

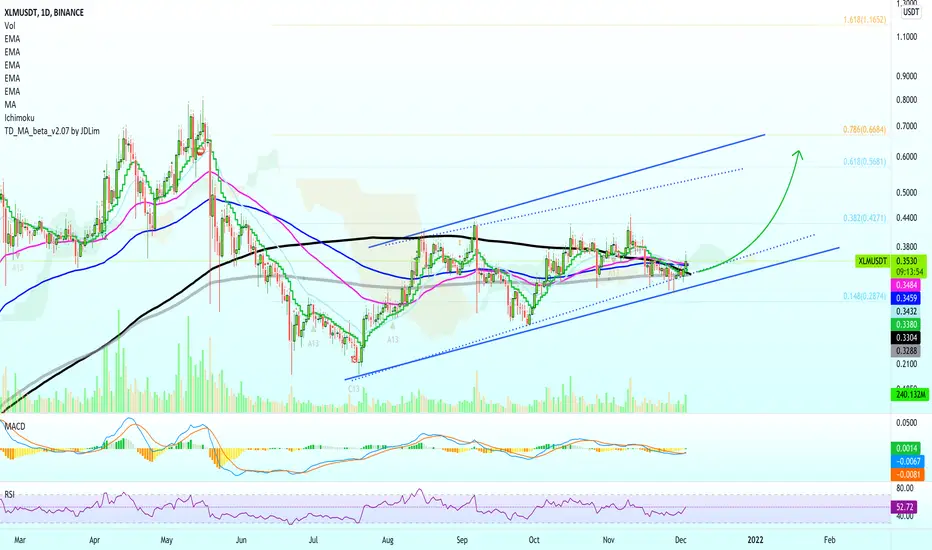
Stellar vs Tether Looks Even BetterThere is no doubt here, XLMUSDT is full blown bullish mode.
Since yesterday, XLMUSDT went from trading below EMA300/100/50/10/MA200 to trading above it.
So today we have a candle above all these levels.
This one looks like the other USDT pairs.
There are no surprises.
We had months of consolidations.
Years to prepare...
Make sure to work on your strategy to maximize profits.
Improve your results.
That's it for now.
Namaste.
DigiByte vs Tether - Lots Of Room Available For Growth!Here we can see that DGBUSDT (DigiByte) is still trading below EMA50, which can be considered bearish.
Also, the MACD is not yet bullish and the RSI below 50, some small bearish signals...
Yet, positive horizon.
The charts can change fast anytime, any day.
DGBUSDT has been printing higher lows since June, which is bullish.
Other Altcoins that tend to move together with this one already moved.
We also have experience with dozens of charts that looked just like this one but now instead of below EMA50 prices are trading high above it.
The bullish sentiment is strong.
DigiByte might just be getting ready to grow.
This is not financial advice.
All the information I share is for learning/entertainment purposes only.
I am so grateful that you are here today again reading.
Thanks a lot for your support.
Namaste.
