Hellena | EUR/JPY (4H): Short to support areaDear colleagues, I anticipate that the price will test the support area at 155.632. After that, I will be looking for long positions.
Manage your capital correctly and competently! Only enter trades based on reliable patterns!
Trendanalyisis

BTC 1H ReviewHello everyone, let's look at the BTC to USDT chart on a one hour timeframe. As you can see, the price moved dynamically above the local downtrend line.
After unfolding the trend based fib extension grid, we see that the first support is at $29623, then the second at $29423, the third at $29263, and then we have a strong zone from $29098 to $28867.
Looking the other way, we see that the price has recovered quickly and is holding just below the resistance at $29,819, then we have strong resistance at $30,136 and then very strong resistance at $31,049.
The RSI indicator indicates that the energy is used, while the STOCH indicator also shows the energy used in this movement, which may result in a price correction.

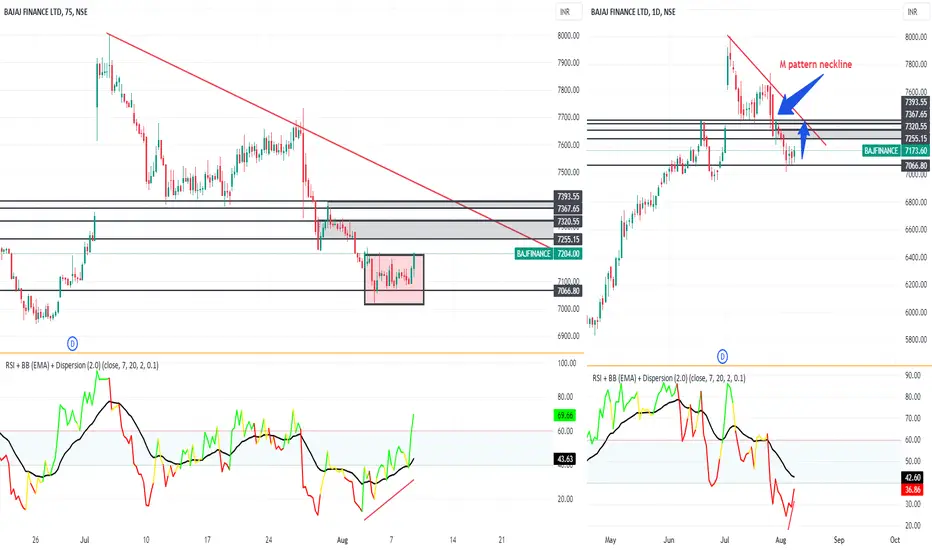
Baja Finance Intraday Trade Levels and AnalysisThe stock is reversing from demand zone after 4 days of consolidation in the same zone, also there is a double top breakdown in Daily time frame, and the stock is poised for a retest of the Double Top neckline area.
75 minutes shows Double bottom very evident with RSI divergence and RSI moving into 70+ strength zone, an up move of odd 7200-7400 levels is possible.
Hence with the above levels, one can consider a long Intraday trade with an RR of min 1:1 or max even 1:2.
Important areas for EURUSDMentioned some key areas for EURUSD and I believe there would be a reversal if a rejection is shown by EURUSD at lower level. Keep it simple and trade with clear minds.

GBPUSD 4H Chart Analysis for Sell!Hello Everyone,
Welcome to FXMYWORLD.
Let's see how this pair will perform based on the analysis.
Make sure you do your research and based on your confluence please look for the entry.
Don't rush your trades without any confirmation.
Thanks in advance for checking my trade idea.

Hellena | GBP/USD (4H): Long to resistanceDear colleagues, regarding this pair, I am considering only long positions. The first target is the resistance area at 1.27885.
Manage your capital correctly and competently! Only enter trades based on reliable patterns!

TeconLab_S1 XAUUSD BullishDear Traders,
The TeconLab team has developed a new research method using price decomposition analysis to forecast future trends for currency pairs.
Our latest analysis of XAUUSD (Gold) indicates a bullish outlook. Please review the attached chart and set take profit levels accordingly.
If the trendline breaks to the upside, after it retest the trendline we get the second long position and hold it for the second take profit.
Then we wait for the drop near wave 4 and take the third position and wait for the third take profit.
We are optimistic this innovative approach can deliver strong profits with high accuracy.
Your likes and feedback provide valuable motivation as we continue improving our models.
Current pairs under research include:
AUDUSD
EURUSD
GBPUSD
NZDUSD
USDCAD
USDJPY
USDCHF
EURGBP
GBPJPY
XAUUSD (Gold)
Please let me know if you have any other suggested pairs for analysis. We aim to provide actionable insights that can drive improved trading performance. Thank you for your interest and support.
Regards,
The TeconLab Team

Hellena | NZD/USD (4H): Long to resistance areaDear colleagues, for this pair, I am considering only long positions. The first target is the resistance area at 0.62215. Before this movement, a small correction is possible.
Manage your capital correctly and competently! Only enter trades based on reliable patterns!

Hellena | AUD/USD (4H): Long to ResistanceDear colleagues, I anticipate that the price will reach the resistance area at 0.66916. The price may test the 100% Fibonacci expansion level at 0.65362.
Manage your capital correctly and competently! Only enter trades based on reliable patterns!

Hellena | GOLD (4H): Short to 78.6%-100% Fibo lvlDear colleagues, I assume that the downward price movement is not yet finished. I expect the price to reach the area of 78.6%-100% Fibonacci extension at 1927.6.
Manage your capital correctly and competently! Only enter trades based on reliable patterns!

Hellena | NZD/USD (4H): Long to resistance area (0.61233)Dear colleagues, I anticipate that the price will reach the resistance area at 0.61233. If the price breaks through this range, I will consider further long positions.
Manage your capital correctly and competently! Only enter trades based on reliable patterns!

Bullish flag pattern breakout in Dixon TechDIXON TECHNOLOGIES LTD
Key highlights: 💡⚡
✅On 1 Day Time Frame Stock Showing Breakout of Bullish flag Pattern .
✅ Strong Bullish Candlestick Form on this timeframe.
✅It can give movement up to the Breakout target of 6076+.
✅Can Go short in this stock by placing a stop loss below 3730-.

Hellena | GOLD (4H): Short to 61.8% Fibo lvlDear colleagues, I anticipate that the price will reach the 61.8% Fibonacci level of 1933.671.
The previous trade had to be closed at breakeven.
Manage your capital correctly and competently! Only enter trades based on reliable patterns!

Bullish Market on USDJPYMonday's daily candle closed bullish as anticipated. I'm still anticipating a bullish market for the rest of the week

Head and shoulder pattern breakout in SIEMENSSIEMENS INDIA LTD
Key highlights: 💡⚡️
✅On 1Hour Time Frame Stock Showing Breakout of head and shoulder pattern.
✅ Strong Bullish Candlestick Form on this timeframe.
✅It can give movement up to the Breakout target of 3858+.
✅Can Go short in this stock by placing a stop loss above 3695-

wedge pattern reversal in MGLMAHANAGAR GAS LTD
Key highlights: 💡⚡
📈On 1Day Time Frame Stock Showing Reversal of wedge Pattern .
📈 It can give movement upto the Reversal Final target of above 1130+.
📈There have chances of breakout of Resistance level too.
📈 After breakout of Resistance level this stock can gives strong upside rally upto above 1270+.
📈 Can Go short in this stock by placing a stop loss below 1044-.

Double bottom pattern breakout in DEEPAKNTRDEEPAK NITRITE
Key highlights: 💡⚡
✅On 1Hour Time Frame Stock Showing Breakout of Double bottom Pattern .
✅ Strong Bullish Candlestick Form on this timeframe.
✅It can give movement up to the Breakout target of 2040+.
✅Can Go Long in this stock by placing a stop loss below 1985-.

GBPUSD 4H Bearish Setup for Sell!Hello Everyone,
Welcome to FXMYWORLD.
Let's see how this pair will perform based on the analysis.
Make sure you do your research and based on your confluence please look for the entry.
Don't rush your trades without any confirmation.
Thanks in advance for checking my trade idea.

APE Analysis: Seizing Bullish Momentum!Macro PVVM (Long-Term):
The range for Macro PVVM in the last seven days is from -83.65 (minimum) to -21.71 (maximum), suggesting a shift from a strong bearish trend towards a less bearish or possibly bullish trend.
Micro PVVM (Short-Term):
The mean Micro PVVM value is 32.33, indicating a bullish movement in the short term. The range for Micro PVVM in the last seven days is from -3.19 (minimum) to 48.83 (maximum), suggesting a strong bullish movement in recent days.
Key Takeaways:
• Despite the overall bearish trend indicated by the Macro PVVM, recent data shows a possible shift towards a less bearish or potentially bullish trend .
• The Micro PVVM indicates a bullish movement in the short term, especially in the recent week. This could be an opportunity for short-term traders.
• The asset seems to be showing signs of strength, making it an ideal scenario for a long entry according to the PVVM rules.
Trade Idea:
Considering the recent bullish movement and a potential shift in the long-term trend, a possible strategy could be to enter a long position on the asset. However, traders should keep a close eye on the Macro PVVM to ensure that the shift towards a less bearish trend continues. If the Macro PVVM starts to decrease again, it may be a signal to exit the long position and possibly consider shorting the asset.
Price Prediction for the Next 7 Days:
Based on recent momentum, we could expect a potential continuation of the bullish short-term movement to hit $2.53.

AUTOLINE INDUSTRIES - A TURNAROUND STOCKHELLO FRIENDS,
Here I am sharing my views on AUTOLINE INDUSTRIES (NSE).
the Stock has given a fresh breakout on 24th July with good intensity of volume suggesting bullish bias in the stock.
Each and every indicator that is helpful in our analysis are also showing bullish bias of which snapshots are given below.
Breakout of downward sloping trendline.
Now we understand the overall past structure of this stock as per ELLIOT WAVE counts.
The stock was in double correction phase in the Wave structure as WXY which is now seems to be completed and now we are in Impulse wave structure of 1-2-3-4-5, in which Wave 1 and 2 are completed and now we are unfolding bigger wave 3 of impulse wave 1-2-3-4-5.
Overall wave structure
At the time of breakout the stock gave a strong closing above significant Exponential Moving Averages i.e. 50-100-200
Our Trend Indicator - MACD is also positive Uptick in daily as well as in weekly time frame
MACD DAILY
MACD WEEKLY
Strength Indicator/Oscillator - RSI is also positive uptick in double time frame and also it is above 60 that indicates strong strength.
Directional movement index - DMI is also showing strong strength as DMI+ line (green) is positive uptick along with DMI line (black)
Price at the time of breakout is also challenging the Upper Bollinger Band
Conclusion/summary
As every parameters are suggesting bullish bias, one may go long with strict stoploss.
Thank You - KARAN DINGRA
Disclaimer-
I am not a SEBI registered analyst.
All my studies are for educational purpose.
I am not responsible for any kind of your profits and losses.

ETH/USDT 4HInterval ReviewHello everyone, I invite you to review the chart of ETH in pair to USDT, also on a four-hour interval. First, we will use the yellow line to mark the local downtrend line from which the price is moving sideways.
Now let's move on to marking the places of support. We will use the Fib Retracement tool to mark the support, and as you can see, we first have a support zone from $ 1904 to $ 1868 where the price is currently located, but when we go lower, the next support is at $ 1825.
Looking the other way, we can also mark the places where the price should encounter resistance on the way to increases. And here we have the first strong resistance at $1932, and then the price will have to break through the strong resistance zone from $1970 to $1997.
The CHOP index indicates that there is a lot of energy for movement. The MACD indicator is close to turning into a local uptrend. On the other hand, on the RSI we moved back to the lower end of the range, which may give room for price increase.

EURAUD 4H Bullish Setup for Buying!Hello Everyone,
Welcome to FXMYWORLD.
Let's see how this pair will perform based on the analysis.
Make sure you do your research and based on your confluence please look for the entry.
Don't rush your trades without any confirmation.
Thanks in advance for checking my trade idea.

COINBASE Victory lapCoinbase wins decision over SEC lawsuit pushing the stock here this is a big accomplishment and win for the company. With blackrock wanting to create a bitcoin ETF and coinbase being a potential part of that and Earnings coming up this can ROCKET!
Short term watching for a break out of the wedge and a 59% gain up to $100.
This stock was once at a high at $430
