BITCOIN → Sale on positive news? What to expect? 100K or 130K?BINANCE:BTCUSDT.P unsuccessfully ended another attempt to break through the 112K-113K zone. The positive background (NFP) did not affect the price, and a bearish setup formed on D1...
D1 is forming a pin-bar relative to the strong resistance zone of 112K - 113K, positive news is quickly sold off, and the price, rebounding from the resistance of the trading range, closes near the bearish trigger of 110500. Bitcoin looks quite uncertain as it faces selling pressure in the 112K-113K zone. The price cannot consolidate above this area despite the previously broken correction resistance. There is logic in this maneuver... The market is betting on a more than 90% chance of interest rate cuts, and by that point, the price of Bitcoin may fall to the maximum permissible limits before further growth. Areas of interest may be 107K - 105K - 100K
Resistance levels: 111.9K, 113.3K, 117K
Support levels: 110.5K, 107.4K, 105.0K
A breakdown of the 110.5K support could trigger further sell-offs towards the support of the key trading range. Within the current downward cycle, the price may well test 105,000, which is a fairly strong liquidity zone. The fundamental background is positive, and the current sell-off may be manipulative movement before the emergence of a bullish driver...
Best regards, R. Linda!
Trend Analysis

XAUUSDHello Traders! 👋
What are your thoughts on GOLD?
Following the release of the U.S. Non-Farm Payrolls (NFP) data on Friday, gold surged to the 3600 level before entering a corrective phase from that resistance.
We expect this pullback to extend further, potentially reaching lower support zones in the short term.
If gold finds support and reacts positively, a new bullish wave may begin.
A confirmed breakout above the 3600 level would open the door for a move toward the next key resistance around 3700.
As long as gold holds above the key support area, this bullish scenario remains valid.
Don’t forget to like and share your thoughts in the comments! ❤️

GOLD 1H CHART ROUTE MAP UPDATE & TRADING PLAN FOR THE WEEKHey Everyone,
Please see our updated 1h chart levels and targets for the coming week.
We are seeing price play between two weighted levels with a gap above at 3593 and a gap below at 3562. We will need to see ema5 cross and lock on either weighted level to determine the next range.
We will see levels tested side by side until one of the weighted levels break and lock to confirm direction for the next range.
We will keep the above in mind when taking buys from dips. Our updated levels and weighted levels will allow us to track the movement down and then catch bounces up.
We will continue to buy dips using our support levels taking 20 to 40 pips. As stated before each of our level structures give 20 to 40 pip bounces, which is enough for a nice entry and exit. If you back test the levels we shared every week for the past 24 months, you can see how effectively they were used to trade with or against short/mid term swings and trends.
The swing range give bigger bounces then our weighted levels that's the difference between weighted levels and swing ranges.
BULLISH TARGET
3593
EMA5 CROSS AND LOCK ABOVE 3593 WILL OPEN THE FOLLOWING BULLISH TARGETS
3613
EMA5 CROSS AND LOCK ABOVE 3613 WILL OPEN THE FOLLOWING BULLISH TARGET
3638
EMA5 CROSS AND LOCK ABOVE 3638 WILL OPEN THE FOLLOWING BULLISH TARGET
3658
BEARISH TARGETS
3562
EMA5 CROSS AND LOCK BELOW 3562 WILL OPEN THE FOLLOWING BEARISH TARGET
3528
EMA5 CROSS AND LOCK BELOW 3528 WILL OPEN THE SWING RANGE
3492
3470
EMA5 CROSS AND LOCK BELOW 3470 WILL OPEN THE SECONDARY SWING RANGE
3438
3408
As always, we will keep you all updated with regular updates throughout the week and how we manage the active ideas and setups. Thank you all for your likes, comments and follows, we really appreciate it!
Mr Gold
GoldViewFX

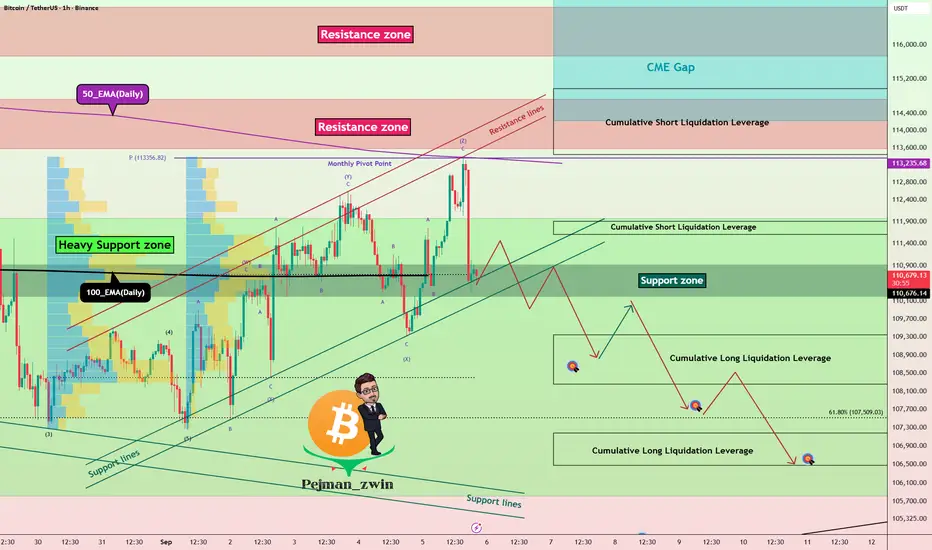
Bitcoin Roadmap – Breakdown Toward $107K or Bounce?Bitcoin ( BINANCE:BTCUSDT ) has been moving with high momentum this week , with the US indexes and Gold ( OANDA:XAUUSD ) bullish .
Bitcoin is currently trying to break the Support lines , Support zone($110,920-$110,200) and 100_EMA(Daily) .
In terms of Elliott Wave theory , it seems that the waves that Bitcoin has made this week have been in the form of a Triple Three Correction(WXYXZ) .
I expect Bitcoin to decline to at least $109,133(First Target) AFTER the Supports are broken.
Second Target: $107,740
Third Target: $106,660
Stop Loss(SL): $114,108(Worst)
Note: As I said at the beginning of this analysis, the financial markets have been a bit emotional and sudden with their movements this week, so always be prepared for any scenario and pay more attention to capital management.
Note: Generally, trading volume is low on Saturdays and Sundays. Perhaps it is a bit far-fetched to expect a break of the Heavy Support zone($111,980-$105,820) during the weekend. What do you think?
Cumulative Short Liquidation Leverage: $114,976-$113,440
Cumulative Short Liquidation Leverage: $111,907-$111,607
Cumulative Long Liquidation Leverage: $109,346-$108,259
Cumulative Long Liquidation Leverage: $107,181-$106,479
CME Gap: $117,235-$113,800
Please respect each other's ideas and express them politely if you agree or disagree.
Bitcoin Analysis (BTCUSDT), 1-hour time frame.
Be sure to follow the updated ideas.
Do not forget to put a Stop loss for your positions (For every position you want to open).
Please follow your strategy and updates; this is just my Idea, and I will gladly see your ideas in this post.
Please do not forget the ✅' like '✅ button 🙏😊 & Share it with your friends; thanks, and Trade safe.
Lingrid | GOLD Weekly Market Outlook: Fed Cut Bets Drive Rally ?OANDA:XAUUSD surged Friday after disappointing payroll data showing just 22K jobs added versus 75K expected, solidifying Fed rate cut expectations at 87.8% probability for September's meeting. The precious metal has already hit record highs above $3,500, gaining over 30% year-to-date as weakening labor conditions fuel aggressive easing bets.
The 4-hour chart reveals gold touched above the $3,600 resistance zone with bullish momentum intact. If the market pulls back then there's 38.2% fibo retracement level to consider. Overall gain of 4.75% in one week suggests minor consolidation might occur before targeting the upper resistance around $3,650. The ascending channel remains unbroken, supporting continued upward movement.
The broader perspective shows gold emerging from a prolonged consolidation phase, with the recent breakout confirming a major $3,500 level. Gold initially demonstrated its first impulse leg, then moved sideways for four months, and is now in the process of forming its second impulse leg, which will end at around $3,660.
Some economists now debate whether the Fed might deliver a jumbo 50-basis-point cut given consecutive weak employment reports, which could propel gold toward the $3,660-3,700 correction zone upper boundary. Key support lies at $3500-3530, while sustained weakness could test the major trendline near $3,450.
If this idea resonates with you or you have your own opinion, traders, hit the comments. I’m excited to read your thoughts!

Bitcoin: Sell Signal Points To 106K AREA.Bitcoin has rejected the 113K as a resistance with a clear bearish pin bar close. The low of that pin bar has been broken which qualifies as a sell signal on the daily time frame. 113K was previously a key support, and now a resistance which further adds to the broader corrective argument that I have been writing about for weeks. So what does this mean?
The next support is the 105K area and that is where I am anticipating a test either this week or next. Besides CPI, this month also features the next FOMC meeting which can act as a major catalyst bullish OR bearish. These economic events are big enough to affect Bitcoin in a major way which makes it within reason to test the 105K area. IF 105K breaks, the next support after that is the 102 to 100K area.
These support references serve as important potential pivot points for day trades and swing trades. You have to evaluation the price action for reversals along with utilizing a realistic reward/risk framework. For example, since Bitcoin has proven to no longer be in an impulse wave (trend) it is more likely in a consolidation. In practice this means LOWER expectations are warranted. Instead of placing take profit objectives on highs or new highs, it is within reason to choose a higher probability objective like 1:1 or whatever the next resistance is at the time of the reversal. Like 113K can be used as a resistance for a profit objective now (UNTIL OR UNLESS IT BREAKS).
Using wave counts helps immensely when it comes to forming expectations that are in line with market intent. Since the 108K overlap I am anticipating more of a range bound type of environment which means both RANGE support and resistance levels are significant. This is in contrast to expecting the market to continue to trend which is a common mistake among the less experienced. This thought framework is relevant to swing trades and day trades as the market character changes more frequently over shorter time frames. Even as an investor, the wave counts can help you to recognize much higher quality buying opportunities rather than buying at any price.
Thank you for considering my analysis and perspective.

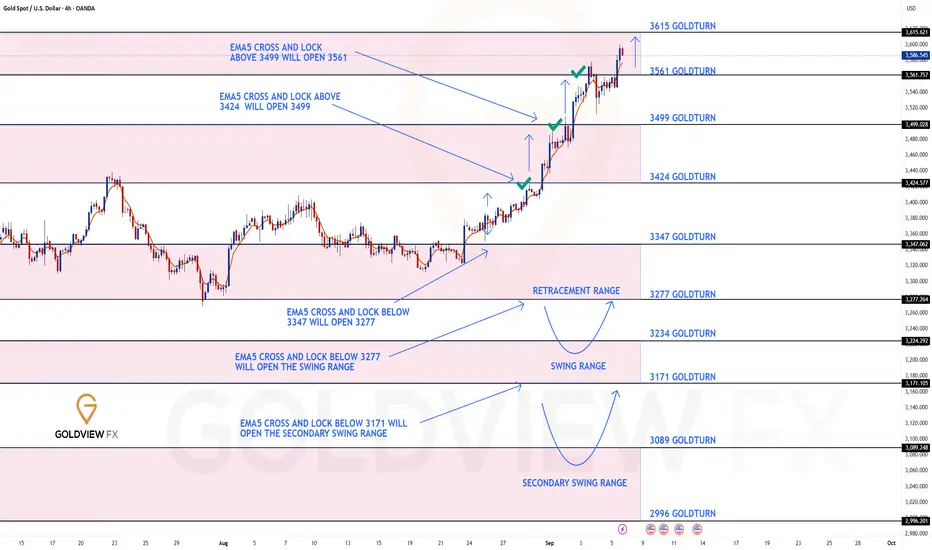
GOLD 4H CHART ROUTE MAP UPDATE & TRADING PLAN FOR THE WEEKHey Everyone,
This is still a follow up update on our 4chart idea which is still valid and in play with the final gap still in range.
Previously we had our Bullish target 3424 and finished off with ema5 cross and lock above this level opening 3499. This gap was filled last week just like we analysed followed with another cross and lock above 3499 opening 3561, which was also hit.
We now finished off last week with a cross and lock above 3561 leaving 3615 open. Failure to test this final target will see lower Goldturns tested for support and bounce.
We will keep the above in mind when taking buys from dips. Our updated levels and weighted levels will allow us to track the movement down and then catch bounces up.
We will continue to buy dips using our support levels taking 20 to 40 pips. As stated before each of our level structures give 20 to 40 pip bounces, which is enough for a nice entry and exit. If you back test the levels we shared every week for the past 24 months, you can see how effectively they were used to trade with or against short/mid term swings and trends.
The swing range give bigger bounces then our weighted levels that's the difference between weighted levels and swing ranges.
BULLISH TARGET
3424 - DONE
EMA5 CROSS AND LOCK ABOVE 3424 WILL OPEN THE FOLLOWING BULLISH TARGETS
3499 - DONE
EMA5 CROSS AND LOCK ABOVE 3499 WILL OPEN THE FOLLOWING BULLISH TARGET
3561 - DONE
EMA5 CROSS AND LOCK ABOVE 3561 WILL OPEN THE FOLLOWING BULLISH TARGET
2615 -
BEARISH TARGETS
3347
EMA5 CROSS AND LOCK BELOW 3347 WILL OPEN THE FOLLOWING BEARISH TARGET
3277
EMA5 CROSS AND LOCK BELOW 3277 WILL OPEN THE SWING RANGE
3234
3171
EMA5 CROSS AND LOCK BELOW 3171 WILL OPEN THE SECONDARY SWING RANGE
3089
2996
As always, we will keep you all updated with regular updates throughout the week and how we manage the active ideas and setups. Thank you all for your likes, comments and follows, we really appreciate it!
Mr Gold
GoldViewFX
Euro will rebound from seller zone and then start to fallHello traders, I want share with you my opinion about Euro. The price action for the Euro has been methodically developing within the confines of a large upward channel for several weeks, creating a clear structure of higher highs and higher lows. This pattern has been anchored by the major buyer zone near the 1.1580 support level and capped by a dynamic resistance line. The market has just completed a full upward rotation within this structure and is now at a critical inflection point. Currently, the price of EUR is directly testing the upper boundary of the channel, which forms a powerful confluence of resistance with the horizontal seller zone located at the 1.1720 - 1.1740 area. The primary working hypothesis is a short, rotational scenario, based on the expectation that sellers will successfully defend this significant resistance confluence. A confirmed rejection from this seller zone would validate the integrity of the upward channel and likely initiate a new corrective swing to the downside. This move would first need to break the current support Level at 1.1720. Therefore, the TP for this scenario is logically placed at 1.16150, a target that aligns perfectly with the ascending support line of the channel and represents the most probable objective for this bearish rotation. Please share this idea with your friends and click Boost 🚀

Understanding Consolidation & Trading itWhat Consolidation Is
Consolidation is a market phase where price moves sideways within a defined range, showing indecision or balance between buyers (bulls) and sellers (bears).
Characterized by low volatility, overlapping candles, and no clear trend direction.
Often occurs after strong moves (as the market pauses) or before breakouts (accumulation/distribution).
Impact on Bulls & Bears
Bulls: View consolidation near highs as accumulation (buyers building positions before a breakout upward).
Bears: View consolidation near lows as distribution (sellers unloading before a breakdown).
Both sides place stop orders outside the range → creating liquidity pools that smart money hunts.
How Traders Can Take Advantage
Range Trading – Buy near support of the range, sell near resistance, until breakout occurs.
Liquidity Strategy – Wait for fakeouts beyond consolidation, then trade in the opposite direction (stop hunt setup).
Consolidation Across Timeframes
Lower Timeframes (1m–15m):
Looks like noise but is often where scalpers range trade.
Breakouts can give small but quick moves.
Mid Timeframes (1H–4H):
Shows clear accumulation/distribution phases.
Useful for intraday & swing traders.
Higher Timeframes (Daily–Weekly):
Represents major market indecision.
Breakouts from these zones often fuel massive trend moves.
✅ Summary:
Consolidation = sideways range = balance of bulls & bears.
Inside range → fade the extremes.
Outside range → trade support & resistance or liquidity sweep.
On different timeframes → the same consolidation can be noise on 5M, but a critical accumulation on the Daily chart.

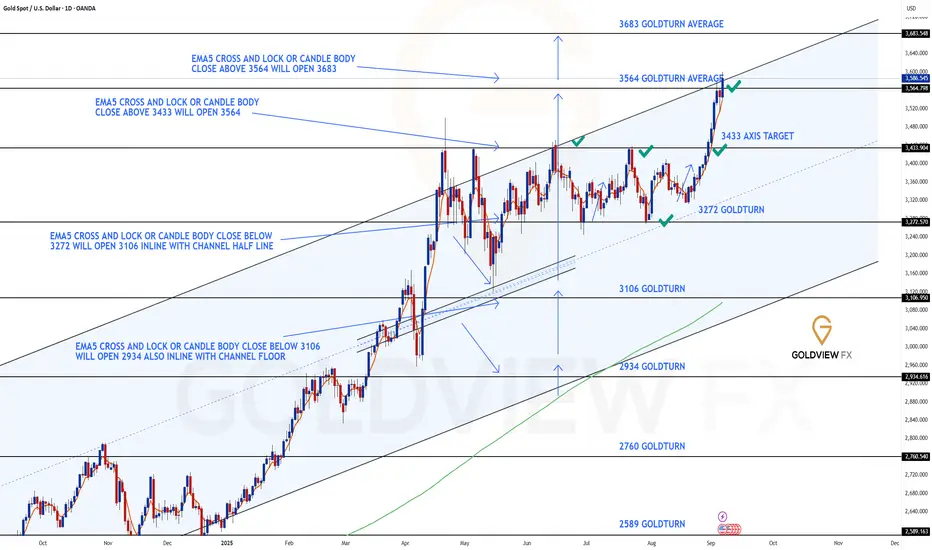
GOLD DAILY CHART ROUTE MAPDaily Chart Update
Range Break, Gap Confirmation & Next Target Achieved
As anticipated in our previous update, price finally pushed through for a test of 3433, confirming the strength of the upside momentum we discussed. This test produced a candle body close gap open for 3564, which has now been successfully achieved just as projected.
The close above 3564 further unlocks 3683 as the next long-term upside target. An EMA5 lock will serve as added confirmation for continuation toward this zone. Meanwhile, both 3564 and 3433 now transition into key support levels for this chart idea.
Current Outlook
🔹 3564 Target Reached
Our gap target has now been completed with a decisive candle body close above. This confirms bullish continuation and shifts focus to the next zone.
🔹 Next Objective – 3683
The successful 3564 break opens a fresh long-term target at 3683. EMA5 lock confirmation will strengthen the case for this move.
Updated Key Levels
📉 Support – 3272 (pivotal floor)
📉 Short Term Supports – 3433 & 3564
📈 Resistance / Next Upside Objective – 3683
Thanks as always for your continued support,
Mr Gold
GoldViewFX
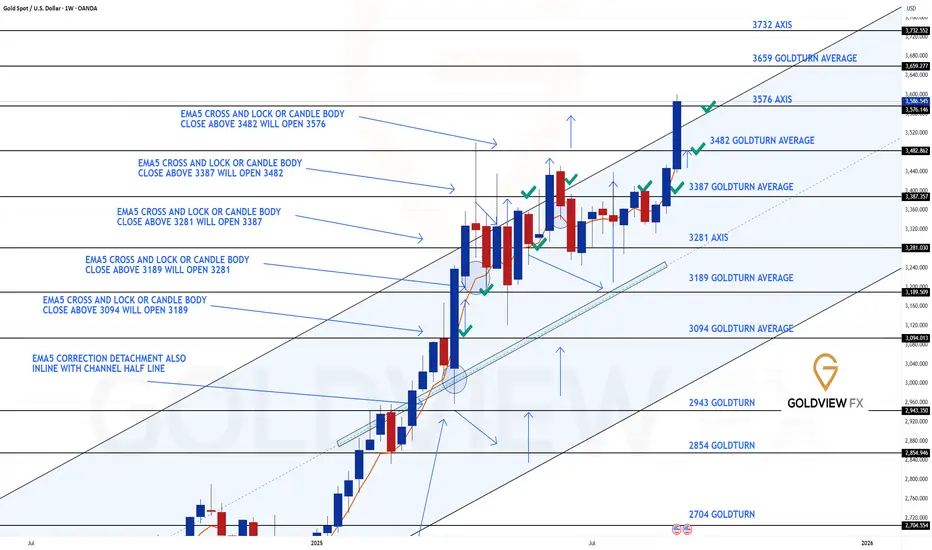
GOLD WEEKLY CHART MID/LONG TERM ROUTE MAPWeekly Chart Update
As anticipated, we got the 3482 gap target hit just as projected. Momentum carried further into the final channel top target at 3576, completing the upper channel move.
Current Outlook
🔹 Gap Targets Achieved
Both 3482 and 3576 have now been met. Price action delivered cleanly into these objectives, validating the prior bullish structure.
🔹 Candle Body Close Above 3576
The weekly body close above the channel top at 3576 has now opened the door to the larger 3659 long-term gap target. EMA5 would provide further confirmation if momentum sustains.
🔹 Channel Top Now Key Test
We need to see 3576 - 3482 (channel top) hold as support to confirm the new range zone play. If it holds, the 3659 - 3732 range becomes the next bullish zone. Failure to provide support above 3482 - 3576 will mean the breakout is short-lived, with risk of a swift correction back down.
🔹 Range Support Levels
3576 and 3482 now act as layered support levels to keep the bullish case intact within this range.
Updated Levels to Watch
📉 Support – 3482 & 3576
Key supports for this new range. Holding above 3576 strengthens the case for continuation toward 3659. A failure back below 3576 puts 3482 into play as the next defensive level.
📈 Resistance – 3659
The newly opened long-term gap target. This becomes the next upside objective if structure holds above 3576.
Plan
With 3482 and 3576 achieved, focus shifts to the 3659 gap. The bullish continuation depends on 3576 holding as support. If buyers defend it, the range extends upward into new territory. If not, expect a sharp corrective move back into the prior range.
Thanks as always for your support,
Mr Gold
GoldViewFX
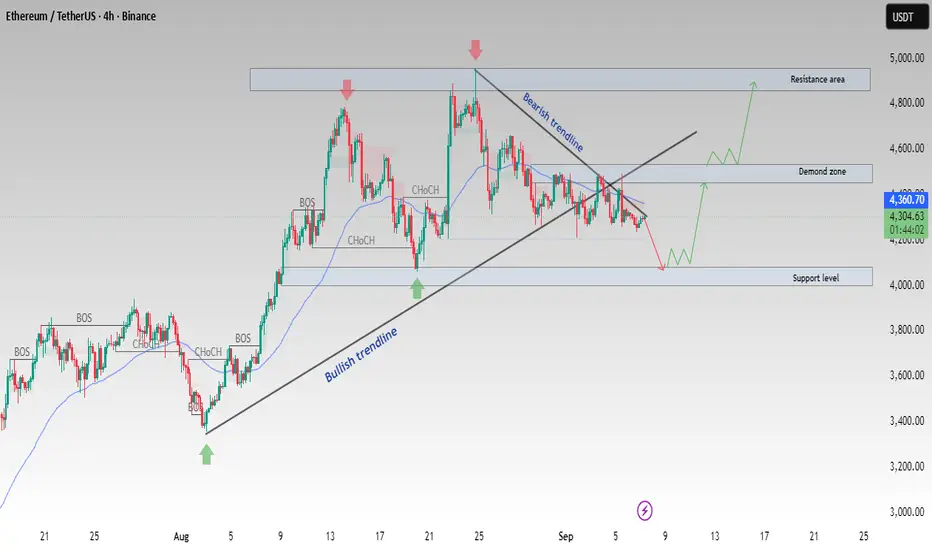
ETH/USDT at Key Demand Zone–Bullish Reversal or Deeper Pullback?Ethereum (ETH/USDT) on the 4H timeframe is trading near a critical demand zone after pulling back from resistance.
Key technical notes:
Bullish trendline supported recent upward moves
Bearish trendline currently limiting upside momentum
Price is consolidating between demand zone (4,200 – 4,300) and resistance (4,600 – 4,800)
If demand holds, ETH could rally back toward 4,600 – 4,800 resistance
A breakdown below demand may lead to a retest of the 4,000 support level
📌 The structure suggests a potential bullish reversal, but confirmation is required with a break of the bearish trendline and demand reaction.
This analysis is for educational purposes only. Always use proper risk management and do your own research before trading.
BTC - Bullish continuation in the makingMarket Context
BTC has recently broken out of a long-standing descending trendline, marking a significant shift in sentiment. This breakout signals the end of the controlled downtrend and sets the stage for a possible bullish continuation. At the same time, the chart shows a clear sweep of sell-side liquidity at the lows, which often serves as the fuel for a reversal.
Trendline Breakout & Liquidity Sweep
The bullish breakout of the old upper trendline is an important technical event. Combined with the earlier sell-side liquidity sweep, this suggests that downside liquidity has been cleared and that the path of least resistance could now be higher. Such a combination often marks the start of a new leg in the trend.
Market Structure Shift Retest
Following the breakout, price has pushed higher and printed a market structure shift (MSS). The current retest of this MSS zone will be key — if it holds, it provides the ideal spot for bulls to reload positions. This retest acts as confirmation that the breakout is valid, not just a short-lived deviation.
Next Liquidity Grab & Upside Targets
Above the current range sits a clear buy-side liquidity pool. The next logical move would be a grab of that liquidity, which could extend into a more aggressive bullish expansion toward higher levels. The structure suggests a stair-step move higher: liquidity grab, retest, and then continuation toward 115k–117k zones.
Final Thoughts
The sell-side liquidity sweep, trendline breakout, and market structure shift all point to a bullish shift in momentum. The key lies in how price reacts to the retest — hold it, and the next liquidity levels are likely to be taken.
If this breakdown helped clarify the setup, a like is much appreciated — and let me know in the comments: are you playing the retest, or waiting for the liquidity grab above?

THE KOG REPORTTHE KOG REPORT:
In last week’s KOG report we said we would be watching the open for a support level to form below and price to attempt the red box, which worked well. It’s that red box we said needed to be watched for the break, which if happened would see us attempt higher price starting with 3468 and above that 3485-90. Again, we broke, hit our targets on the chart and the red box targets early week.
We then released the NFP Report which gave the key level and the bias for the move. As you can see on that report, we managed to get almost a pip prefect move from the key level upside, nearly into the target level where we suggested the opportunity to short may come from this week
So, what can we expect in the week ahead?
For this week we have Cpi and PPi midweek so there is potential for this to either range up here, or, like we suggested in the NFP Report, a tap above and a move downside. What we would ideally like to see here is support attacked, defended, a move upside in to the 3606-10 region with extension into the 3620 level and a rejection from above. So, in this scenario, due to the stretch, we’re happy to test these levels with sensible risk but due to that stretch and the mean being way below, if we break above that 3620 level, we’re happy to let it go to where it wants before looking for a reversal.
We’re going to keep it simple, lets see how we open and then we’ll have a better idea of what to expect for the rest of the week.
As usual, we’ll update traders through the week with our plans and trades.
As always, trade safe.
KOG

Bitcoin (BTCUSDT) –> Double Top Playing OutHello guys!
On the 4H chart, Bitcoin has completed a double top formation. After failing to break above the 122,000 zone twice, the price rolled over and eventually broke below the neckline support.
Currently, BTC is pulling back toward the broken neckline area (112,000–113,000). This level may now act as resistance, setting up a bearish retest before continuation lower.
Key Technical Points
Double Top: Confirmed by two failed attempts to push higher.
Broken Neckline: Now turned into resistance.
Target of the Pattern: Based on the structure, the projected move points toward 105,000–105,500, which also aligns with a strong demand zone.
Scenario
If price rejects at the neckline retest, we can expect a move down toward the 105K region . A sustained break below 105K could accelerate bearish momentum, while reclaiming 113K would invalidate the pattern.
📌 Bias: Bearish below 113K, looking for continuation toward 105K.

Gold (XAU/USD) –> Two Scenarios Hello guys!
Gold has been moving strongly inside an ascending channel on the 1H chart, showing consistent bullish momentum. Price is currently testing a key resistance area around $3,585 – $3,590. From here, one of two scenarios is most likely to play out:
Scenario 1: A short-term pullback toward $3,563 support, followed by a bounce that could fuel another leg higher. target will be near $3,630 – $3,650.
Scenario 2: A short-term pullback toward $3,580 support, pushing price toward the upper channel resistance near $3,630 – $3,650.
Both scenarios remain bullish as long as gold trades above $3,560. Only a clean break below this level would weaken the structure.
Overall, gold is set for further upside; the path depends on whether we see a retest first or an immediate breakout.
Disclaimer: As part of ThinkMarkets’ Influencer Program, I am sponsored to share and publish their charts in my analysis.

EUR/USD – Approaching Key ResistanceHello traders,
FX:EURUSD continues its strong recovery, breaking above 1.1700 and moving toward multi-week highs. The main driver is the weakening U.S. dollar, after August’s Non-Farm Payrolls came in at just 22K jobs, far below expectations of 75K and the previous 79K.
On the D1 chart, the pair holds a solid uptrend with strong support from the rising trendline and EMA34/EMA89. The next key challenge lies in the 1.1800 resistance zone. A clear breakout could open the way toward 1.2000 in the medium term.
As long as price stays above the trendline, the bias remains bullish. Waiting for a confirmed breakout offers a safer entry for buyers.
👉 What’s your view on EUR/USD’s next move?

SILVER (XAGUSD): Consolidation & Bullish MovementThe price of SILVER is currently exhibiting trading behavior within a broad horizontal range.
Following a test of its support level, an inverted head and shoulders pattern was formed.
It is anticipated that this consolidation will persist, with a probable price increase towards the range's resistance level.

GAMMA SQUEEZE: Why Gold Prices will hit 5 000 + USDBottom line
If 1% of Treasuries ($278B) rotates into gold, $5,000/oz is not only plausible—it sits inside the low end of what flow math + today’s market microstructure can deliver. The path (and whether we print $8k+ spikes) hinges on how much of that flow shows up as short-dated calls—because that is what turns steady demand into a self-feeding gamma loop.
________________________________________
Executive summary
• A 1% rotation out of U.S. Treasuries is roughly $278B of new gold demand (using SIFMA’s latest estimate that Treasuries outstanding ≈ $27.8T).
• At today’s context (gold ~$3.53k/oz on Sep 2–5, 2025), $278B buys ~79.4M oz ≈ 2,471 tonnes; at $5k/oz it buys ~55.6M oz ≈ 1,729 tonnes. For scale, annual mine supply ≈ 3,661 t and total above-ground stocks ≈ 216,265 t (bars/coins+ETFs ≈ 48,634 t).
• That flow is huge relative to both quarterly demand value (Q2’25 ≈ $132B) and typical daily trading turnover (~$290B/day across OTC, futures & ETFs). Even spread out, it materially tilts the tape; if concentrated and routed via options, it can produce dealer hedging feedback—i.e., a gamma squeeze.
• Price targets (framework, not prophecy):
o Conservative flow-only: +40–60% → $4,900–$5,600/oz
o Base case (flow + some options reflexivity): +70–110% → $6,000–$7,500/oz
o Squeeze/overshoot window (short-dated calls heavy): episodic spikes >$8,000/oz possible, but hard to sustain without continued flow.
These bands come from scaling prior ETF-driven episodes (notably ~877 t ETF inflow in 2020 alongside a ~+36% price run) and sizing against current market depth, while layering a realistic options-hedging multiplier (details below).
________________________________________
1) What a “gamma squeeze” in gold means (and why it can happen)
Definition (in one line): When call buying concentrates near-dated, near-the-money strikes, dealers short gamma must buy futures as price rises (and sell if it falls) to keep neutral—this feedback accelerates upside (“gamma squeeze”).
Why it’s plausible in gold right now:
• The listed derivatives stack is large. As of Fri, Sep 5, 2025, CME’s daily bulletin shows COMEX gold options open interest ~0.80M contracts (calls ~0.49–0.69M; puts ~0.30–0.38M depending on line item), each on 100 oz—i.e., option OI notionally ties to ~2,400–2,800 t of gold. That is the powder keg a call-wave can act on.
• Implied vol is moderate (GVZ ~18 for 30-day GLD options), so vega is “affordable,” gamma is punchy in the front end.
• CME’s CVOL framework and open-interest tools confirm where strikes/expiries cluster; when OI stacks close to spot and near expiry, market-wide gamma becomes most sensitive.
Back-of-envelope hedging math (illustrative):
For a 30-day, at-the-money option with σ≈18%, the Black-Scholes gamma is about
Γ≈ϕ(0)SσT≈0.399S⋅0.18⋅30/365\Gamma \approx \frac{\phi(0)}{S\sigma\sqrt{T}} \approx \frac{0.399}{S\cdot 0.18 \cdot \sqrt{30/365}}.
At S=$3,500/oz, that’s ~0.0022 per $. A +1% move (+$35) bumps delta by ~0.077 per option. If just 150k near-ATM front-tenor calls are held by customers (dealers short gamma), hedge buying ≈ 150,000 × 100 oz × 0.077 ≈ 1.16M oz ≈ 36 t—per 1% price pop. That’s only a slice of total OI; a broader crowding raises this number. Compare with ~2,500 t/day of global turnover and you can see how concentrated dealer hedging can move price intraday.
________________________________________
2) Sizing a 1% Treasury → gold rotation
Treasury base: latest SIFMA comment put U.S. Treasuries outstanding ≈ $27.8T (Q1’25). 1% → $278B.
Gold the rotation would buy:
• At $3,500/oz: $278B → ~79.4M oz → ~2,471 t
• At $5,000/oz: $278B → ~55.6M oz → ~1,729 t
For scale:
• Annual mine supply (2024): ~3,661 t; total supply (incl. recycling): ~4,974 t. A $278B buy ticket equals 47–67% of a year’s mine output (depending on price), or ~35–50% of total annual supply.
• ETF precedent: In 2020, ~877 t net ETF inflow (~$48B) coincided with a ~+36% move from Jan→Aug 2020. Today’s $278B is ~5–6× that dollar size (and ~2–3× the tonnes, depending on price), hinting at large flow-driven upside even before any options reflexivity.
• Turnover lens: WGC puts average daily trading across OTC/futures/ETFs at roughly $290B/day recently. A $278B program is ~one day’s global turnover. Pushed quickly (or skewed to options), that’s impactful; stretched over months, the price impact softens but still accumulates.
Futures-only lens (capacity check):
At $3,500/oz, one COMEX GC contract notionally = $350k (100 oz). $278B equals ~794k GC contracts. Current futures OI is ~0.49M contracts, so this exceeds all COMEX OI—you cannot push that much via futures quickly without major repricing. Even at $5,000/oz (~$500k/contract), it’s ~556k contracts, still comparable to the entire OI.
________________________________________
3) Price-target framework (with the math that gets you there)
Think of the price in layers: (A) base flow impact + (B) options-gamma reflexivity + (C) second-round effects (short-covering, momentum, FX, central banks).
A) Flow-only impact (calibrated to 2020)
• 2020 anchor: 877 t ETF inflow ↔ ~+36% price. Using a simple proportionality, 1,729–2,471 t (your $278B) maps to ~+71% to +101%.
• Apply to spot ≈ $3,532/oz (early Sep 2025):
o +71% → ~$6,050/oz
o +101% → ~$7,100/oz
Caveat: 2020 had unique macro tailwinds, so I treat this as upper-middle of base range.
B) Options reflexivity / gamma squeeze overlay
If 20–30% of the $278B rotation expresses via short-dated calls (common for levered macro expressions), dealer hedging can amplify flow impact:
• From the OI math earlier, a mere 1% up-move can demand ~20–40 t of dealer hedge buying if near-ATM OI is thick. A 3–5% multi-day grind can easily cascade into 100–200 t of incremental buying from hedgers alone. That’s non-trivial vs. mine supply pace, and it pulls forward upside.
• Result: add another +10–20% to the flow-only levels during a squeeze while it lasts.
C) Second-round effects
• Central banks: still persistent net buyers (>1,000 t/yr pace in recent years), tending to fade dips rather than rallies—a structural bid.
• FX & rates: the GVZ ~18 regime means bursts of vol aren’t “expensive”; a weakening USD or policy shocks can tilt the target higher.
Putting it together—scenario bands
Scenario Assumptions Implied move Target
Conservative $278B spread over 6–9 months, mostly physical/ETFs; limited options +40–60% $4,900–$5,600
Base case 50–70% to physical/ETFs, 30–50% to futures/options; moderate dealer short-gamma +70–110% $6,000–$7,500
Squeeze / overshoot Short-dated call concentration, dealers persistently short gamma; flow bunches in weeks +120–>150% (episodic) >$8,000 (brief spikes)
$5,000 target is well within the conservative band if any meaningful fraction of the $278B pushes through quickly, even without a full-blown gamma loop.
________________________________________
4) Why the market could mechanically gap higher
• Market size vs. flow: Q2’25 total demand value = $132B. Dropping $278B into this ecosystem is a 2× quarterly shock.
• Trading capacity: $278B ≈ one full day of global turnover; price impact is convex when the risk-absorption (dealers, miners, recyclers) cannot scale linearly day-by-day.
• Derivatives gearing: With ~0.8M options contracts OI outstanding and futures OI ~0.49M, even a partial shift into calls forces hedge-buys on the way up, the hallmark of a squeeze.
________________________________________
5) Key risks / reality checks
• Time profile of the rotation matters. A slow, programmatic shift spreads impact; a front-loaded move can overshoot then mean-revert as gamma decays.
• Elasticity is asymmetric. Jewelry/fabrication falls at high prices (demand destruction), recycling rises, both cushioning extremes. That moderates how long >$7k can persist without continued flow.
• Volatility regimes change. If GVZ spikes to high-20s/30s, option premia jump, slowing new call demand; conversely, put demand can flip net gamma long for dealers, dampening squeezes.
________________________________________
References (most load-bearing)
• Treasury base: SIFMA—Treasuries outstanding $27.8T (Feb 2025).
• Gold supply & stocks: WGC—Above-ground stock 216,265 t (end-2024); bars/coins+ETFs 48,634 t; mine supply 2024 ≈ 3,661 t.
• Trading turnover: WGC—gold trading ≈ $290B/day.
• ETF precedent: WGC—2020 ETF inflows 877 t (~$47.9B) alongside major price rise.
• Current price context: Reuters—record highs $3,532/oz set in early Sep 2025. (
• Options/hedging plumbing: CME daily bulletin (Sep 5, 2025) showing gold options OI ~0.8M contracts; CME CVOL/tools; Cboe GVZ ~18 as 30-day IV.
________________________________________

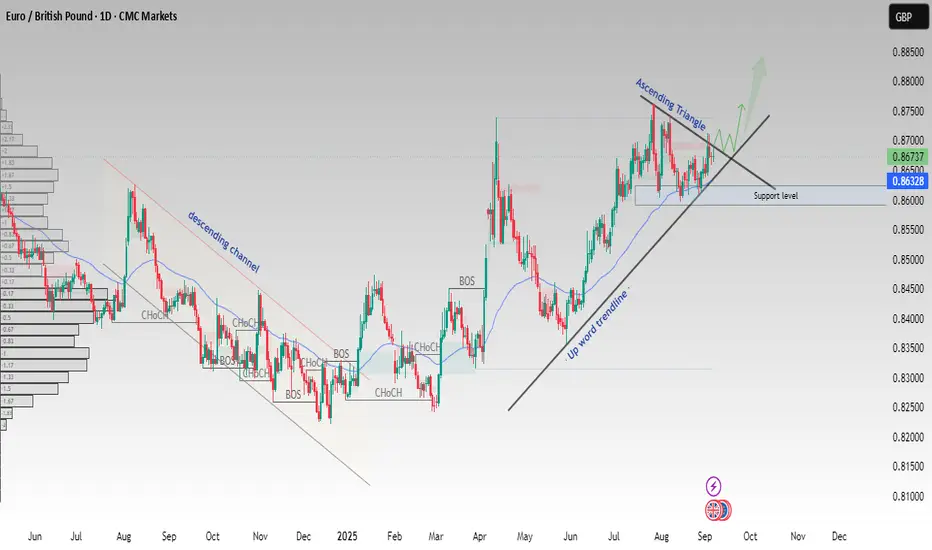
EUR/GBP Forming Ascending Triangle – Bullish Breakout PotentialEUR/GBP on the daily timeframe is showing strong bullish structure. After breaking out of the descending channel, price has respected the upward trendline and is now consolidating inside an ascending triangle pattern.
Support zone holding around 0.8600 – 0.8620
Upward trendline acting as dynamic support
A breakout above the triangle resistance could open the way toward 0.8750 – 0.8800
If support fails, price may retest the lower zone before continuing higher
📌 This setup suggests bullish continuation if the ascending triangle confirms with breakout and volume.
Always apply proper risk management. This analysis is for educational purposes only, not financial advice.
BTC: Profit-Taking Pressure and September RisksHello everyone, Bitcoin has faced strong volatility recently, influenced both by news flow and seasonal patterns.
From a fundamental perspective, the weak US NFP report initially supported a bounce as USD and yields eased. Yet, much of this reaction was already priced in, leading to quick “sell the news” behaviour. Meanwhile, spot ETF flows remain inconsistent, alternating between inflows and outflows, providing no lasting support. Historically, September tends to be a challenging month for BTC, and growing investor caution has further weakened the recovery.
Technically, BTC remains below the H4 Ichimoku cloud, indicating short-term bearish bias. Immediate resistance lies at 111.8–112.2k, and only a decisive H4 close above this zone could unlock a move towards 113.5–114.0k. On the downside, 110.3–110.9k is key; breaking this level could see BTC slide quickly to the 109k area, potentially 108.8k. Until 112k is reclaimed, the base scenario remains a sideways drift with bearish inclination, where short-term rallies are likely capped by profit-taking.
How do you see BTCUSD unfolding next? Share your view below.

Understand This, and You Will Always Be the Winner👋Welcome, everyone!
Have you ever wondered what causes the market to rise and fall? You may have seen in my analysis that I always refer to the news, and yes, that’s the answer. In addition to technical analysis, news always plays a crucial role as a catalyst, driving stronger trends. Let’s explore more!
TOPIC: Identifying The News Groups That Strongly Affect Gold Prices
Not all news is important. Gold often fluctuates strongly due to the following factors:
-Interest rates & FED policies (FOMC, FED chairman’s speech)
-Inflation data: CPI, PCE, Core CPI
-USD strength: DXY index, employment report (NFP)
-Geopolitics: Conflict, war, financial crisis
➡️ If the news falls into these 4 groups, pay close attention.
💡 Understand the basic logic of USD and gold
🔼 When the USD strengthens (due to good news about the U.S. economy, the FED raising interest rates) → gold usually decreases.
🔽 When the USD weakens (bad news, the FED loosens, high inflation) → gold usually increases.
🚫 When there is instability (crisis, war, risk) → safe-haven money flows into gold.
➡️ By understanding this logic, you don’t need to memorize too much.
📢 Read the news in 3 steps
When the news is released:
-Compare the actual results with the forecast and previous period.
-Place gold in the logic above to speculate on the initial direction.
-Combine with the chart to find a reasonable entry instead of entering immediately when the news is released (avoid getting stopped out).
⭐️ Real example: OANDA:XAUUSD A strong rally to 3600 USD.
Cause: Non-Farm Payrolls (NFP) released on September 6.
📊 The data showed:
-Actual: 22K
-Forecast: 75K
-Previous: 79K
This is a strong bullish signal: the number of jobs created was much lower than expected, showing a weakening U.S. labor market → USD weakens → gold surges, providing a great buying opportunity.
📌 In conclusion: Reading the news doesn’t have to be complicated. Just remember:
✅ Important news that affects gold.
✅ USD and gold are almost opposites.
✅ Always combine news + technical analysis for safe entries.
Now, it’s your turn to put the knowledge into practice. Please like this post if you understand everything and are looking forward to the next lessons, it will be a great encouragement for me.
Wishing you all the best on your way to becoming an expert!

ETH eyes on $4488: Proven Genesis Fib holding up new ATHETH has been consolidating near its highs.
Banging its head into a Genesis Fib at $4488,38
Break could be VIOLENT, rejection could be DOOM.
See "Related Publications" for previous charts that NAILED key levels.
===========================================================
.
