ETH/USD....2h chart pattren..MY signaling a short position on ETH/USD at $1,630, with targets at $1,500 and $1,400. Here's a quick breakdown:
Trade Setup:
Entry: 1,630 (Sell)
Target 1: 1,500
Target 2: 1,400
Stop-Loss: (You didn’t specify — want to include one?)
Considerations:
Is this a scalp, swing, or position trade?
Are you basing this on technical analysis, market sentiment, or fundamentals?
If you'd like, I can:
Pull up recent ETH/USD chart trends
Help you set a risk-reward ratio
Provide TA like resistance/support or RSI/MACD insights
Want a quick chart read or market sentiment check?
Trend Analysis

ADA/USDT | Multi-Month Breakout Brewing — a 10x play ?Cardano is quietly mirroring its previous macro cycle — but this time, the structure looks tighter, cleaner, and potentially more explosive.
The multi-month chart reveals a consistent uptrend forming off the 2022 lows, contained within a well-respected ascending channel. The price action shows strong similarities to the 2018–2020 accumulation phase, followed by the breakout that led ADA to its all-time high in 2021.
The current price structure is forming higher highs and higher lows within a channel — a strong bullish continuation pattern.
Volume has been increasing steadily during the up-moves, signaling real demand building underneath.
Fibonacci Extensions from the previous cycle highs and lows show key long-term resistance zones:
1.618 – $4.91
2.618 – $7.79
4.236 – $12.47
These levels could act as major psychological targets if the trend continues to evolve similarly to the last cycle.
⏳ Current Price (~$0.64) is still significantly below previous all-time highs and long-term extension zones — offering a potentially favorable risk/reward setup for patient investors.
⚠️ As always, nothing moves in a straight line — but if you're a macro-mind investor, you’ll start to notice more straight lines than most. Zooming out often reveals the patterns that noise hides.

NQ Short (04-16-25)Staying with the Short, NAZ with a Gap up and a Gap down move in the off session (very little in the Reg). When the moves in the markets seem manufactured and happen in the O/N or off session, look Short. Looks like 18,400-300 is the Danger Zone here and below could be the express way lower. Should we get there, look Long 1st as the will U Turn it away (Gap, off session, Holiday, Dead Zone or any low volume period).

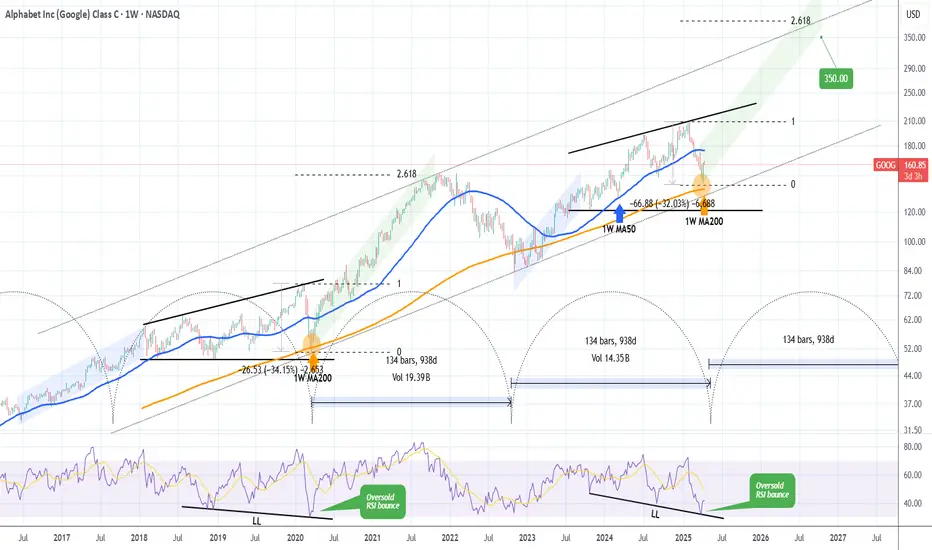
GOOGLE's generational bottom made. This is how it reaches $350.Alphabet Inc. (GOOG) almost tested last week its 1W MA200 (orange trend-line). That level has been holding for more than 2 years (since March 13 2023) and it's been the main Support of the Bull Cycle that followed the November 2022 Inflation Crisis bottom.
The pattern is almost like the Ascending Triangle that led to the March 2020 COVID crash, which was the most recent time before the late 2022 bottom that the stock made contact with the 1W MA200. As you realize, all those times have been what we call 'generational bottoms', thus extremely good long-term buy opportunities. And as you see they've been on extremely tight time symmetry, all took place roughly every 2.5 years.
If the pattern continues to repeat itself, then we may witness a rally (green Channel Up) similar to the one that peaked on November 2021 and reached the 2.618 Fibonacci extension. As a result, setting a $350 Target would be more than realistic based on this pattern.
-------------------------------------------------------------------------------
** Please LIKE 👍, FOLLOW ✅, SHARE 🙌 and COMMENT ✍ if you enjoy this idea! Also share your ideas and charts in the comments section below! This is best way to keep it relevant, support us, keep the content here free and allow the idea to reach as many people as possible. **
-------------------------------------------------------------------------------
💸💸💸💸💸💸
👇 👇 👇 👇 👇 👇
Litecoin (LTC): Seeing 15% Drop Incoming | Wait For BOSLitecoin has a good chance of downward movement to happen anytime where we are seeing the pressure from sellers had formed a nice MSB where now we expect the price to fall at least 15%.
More in-depth info is in the video—enjoy!
Swallow Academy

USDCAD Selling not over yet.Last time we looked at the USDCAD pair (March 21, see chart below), we got the most optimal sell entry that easily hit our 1.4000 Target:
As the price broke below its 1D MA200 (orange trend-line) having made a significant correction since the February 03 High, we believe there is more selling to be made at least on the short-term.
That is because the Higher Lows Zone that started on the May 2021 market bottom, hasn't yet been tested and since December 2023, the market always broke inside it before rebounding.
As a result, we expect a new rejection on the 1D MA200, delivering a 1.38200 Target.
-------------------------------------------------------------------------------
** Please LIKE 👍, FOLLOW ✅, SHARE 🙌 and COMMENT ✍ if you enjoy this idea! Also share your ideas and charts in the comments section below! This is best way to keep it relevant, support us, keep the content here free and allow the idea to reach as many people as possible. **
-------------------------------------------------------------------------------
Disclosure: I am part of Trade Nation's Influencer program and receive a monthly fee for using their TradingView charts in my analysis.
💸💸💸💸💸💸
👇 👇 👇 👇 👇 👇

EURCHF Bullish IdeaI expect the price to continue going up based on where we are on HTF (The lows that created the most recent push on D/W Timeframe)
The 2 zones are my entry points if i see nice price action around the zones.
First will be an 1m BOS that im waiting from the 15m poi.
Second will be price action confirmation or 1m BOS from the lows.
My overall targets are the HTF EMA and Imbalances.

Expecting to reach 23412In order to balance price, buyers must offer fair value at 23,412 on the 4H timeframe. If that level is reached, a decline may follow; otherwise, we may see a run on liquidity.If you see the 1H candle wick down into the 1H IFVG , then in my view, buyers are likely planning to seek or trigger a run on liquidity at 23,412.

#16 April Nifty50 trade zone
#Nifty50
99% working trading plan
👉Gap up open 23418 above & 15m hold after positive trade target 23482, 23640
👉Gap up open 23418 below 15 m not break upside after nigetive trade target 23262, 23188
👉Gap down open 23262 above 15m hold after positive trade target 23418 , 23482
👉Gap down open 23262 below 15 m not break upside after nigetive trade target 23188, 23084
💫big gapdown open 23188 above hold 1st positive trade view
💫big Gapup opening 23482 below nigetive trade view
📌 Trade plan for education purpose I'm not responsible your trade
More education following me

US30selling us30
sl 40.736
tp 39.929
1% risk
like an follow
i will be posing more us30 trades,
short on us30

BTCUSDT:Remain bullish and keep going long on rebounds. Today, Bitcoin continued to make some breakthroughs. Its highest price approached 86,500, and it has been moving sideways at a high level, maintaining a bullish trend. Wait for the rebound and then go long.
Trading Strategy:
buy@84000-84500
TP:86000-87000
The signals last week resulted in continuous profits, and accurate signals were shared daily.
👇 👇 👇 Obtain signals👉👉👉

BTC/USDT Analysis – Shorts in FocusHello everyone! This is CryptoRobotics’ trader-analyst with your daily analysis.
Yesterday and today, Bitcoin continued to trade sideways and even attempted to break the local high, but was met with market selling pressure.
At the moment, we still prioritize the short scenario. Around the ~$84,700 level, we observed a battle between buyers and sellers. If the price consolidates below this level, it will confirm the bearish scenario and we’ll look for a move down to the next buy zone.
If buyers strongly defend this level, we may retest the local high.
Sell zones:
$85,600–$88,000 (absorption of aggressive buying),
$95,000–$96,700 (accumulated volume),
$97,500–$98,400 (pushing volumes),
$107,000–$109,000 (volume anomalies).
Buy zones:
$82,700–$81,400 (volume zone),
Level at $74,800,
$69,000–$60,600 (accumulated volume).
What do you think will happen first?
A full breakout through the sell zone and continuation of the uptrend, or a correction?
Share your thoughts in the comments — would be interesting to compare views!
This post is not financial advice

TESLA BULLISH 14th April 2025Do not blindly trade anything without maanging your risk.
If market supports then I am expecting a green candle in Tesla.
Again please do not blindly trade anything ever. Hope this helps and yes I am long

Bitcoin's latest strategy analysisUpon analyzing the daily chart, I spotted a falling wedge pattern and a confirmed breakout above its upper boundary.
The final hurdle for buyers is the resistance level between 8,7478 and 88799 on a daily chart.
If the bulls are able to surpass and close above this level, it will be a significant bullish signal.
This could lead to a continuation of the bullish trend, possibly reaching the next resistance level.

ENAUSDT 1DENA ~ 1D Analysis
#ENA The main support that you might be able to consider to start buying back from here with a short -term target of at least 10%+ from here.

TESLA LONGWe are going long here, good place to jump in and we expect some decent upside. Combo of FA and TA

TradeCityPro | AAVE: Key Triggers in DeFi Lending Giant's Trend👋 Welcome to TradeCity Pro!
In this analysis, I want to review the AAVE coin for you. The AAVE project is one of the largest DeFi projects, operating in the lending sector, and holds the highest TVL among all projects in this category.
✔️ Currently, the coin of this project has managed to achieve a $2 billion market cap and with this market cap, it ranks 39th on CoinMarketCap.
📅 Daily Time Frame
In the daily time frame, as you can see, after a long-term uptrend that reached up to 383.59, the price entered a corrective phase and, following the break of the 278.56 zone along with a descending trendline, dropped to the 124.31 level.
💫 The 124.31 support is a very strong one, and the price has reacted well to it. The buying candle volume has increased after the price reached this zone, which indicates the strength of this support.
💥 If this support breaks, the price could begin its next bearish leg. The next support that AAVE has in this time frame is at 77.45, which could prevent further decline in case of a sharp bearish move.
📈 For a long position or spot buy, we first need to wait for the descending trendline to break, and for the price to form a higher low and high above this trendline to confirm a trend reversal.
🔼 Currently, the main bullish trigger is at the 194.97 level, and if this level breaks, the price could move back toward the 278.56 and 383.59 zones.
📉 For a futures position, the 148.17 level is a suitable trigger and can offer a risky long position. However, the spot buy and main position trigger is the 194.97 level. A break of the 50 level on RSI would bring bullish momentum into the market and can serve as a good confirmation for a long position.
🧩 For a short position, breaking the 124.31 level is a good trigger, and if this level breaks and RSI enters the oversold zone, the price could make a sharp bearish move.
📊 But more important than all is the market volume, which currently doesn’t have a clear trend. We’ll have to see whether, upon breaking 124.31 or 148.17, sufficient volume enters the market or not.
📝 Final Thoughts
This analysis reflects our opinions and is not financial advice.
Share your thoughts in the comments, and don’t forget to share this analysis with your friends! ❤️

Bitcoin Elliott Wave AnalysisHello friends
On the Bitcoin chart, we see the formation of a complete Elliott wave pattern. These waves from 1 to 3 or C are quite clear and we can even count its sub-waves.
Now a 3-wave ABC has formed. We cannot be exactly sure that this is a complete zigzag because wave C can be extended and the price will fall further.
But we consider it wave 4 assuming that this zigzag is completed.
So we will wait for the formation of an upward wave in the form of wave 5.
The target is first $86,500 and then $88,000.
Good luck and be profitable.

XAUUSD Analysis todayHello traders, this is a complete multiple timeframe analysis of this pair. We see could find significant trading opportunities as per analysis upon price action confirmation we may take this trade. Smash the like button if you find value in this analysis and drop a comment if you have any questions or let me know which pair to cover in my next analysis.

.DXY (U.S.DOLLAR INDEX) M30 ANALYSIS UPDATES
🔍 **Chart Overview:**
- The chart shows a recent **bearish movement** after a double top pattern, indicated by the red arrows.
- Price has dropped significantly and is approaching a **key support zone** around **99.209 – 99.253**.
- A potential **bullish reversal** is anticipated from this support zone.
---
🧠 **Trade Idea:**
✅ **Bullish Scenario (Primary Setup):**
1. **Wait for price action** confirmation around the support area **(99.209 – 99.253)**.
2. Once bullish confirmation appears (e.g., bullish engulfing, pin bar, or double bottom), look for **buy entries**.
3. **First target:** **99.839** (minor resistance zone).
4. **Final target:** **100.607** (major resistance & previous high).
❗️**Invalidation:**
- If price breaks and closes **below 99.209** with strong bearish momentum, the bullish idea becomes invalid and further downside may be expected.
. 🧩 **Strategy Notes:**
- This setup assumes a potential **V-shaped recovery** after a liquidity grab below the recent low.
- Watch for **U.S. economic data releases**, as marked on the chart – they may trigger volatility and impact DXY movement.

Super Short then Super Long!Hello all. I think market is making subwaves for a big picture. Market passed some very important levels and needs to go higher. A Critical zone can push the price lower and then a Node can cause the price to jump. be happy and have a nice life* (wink)

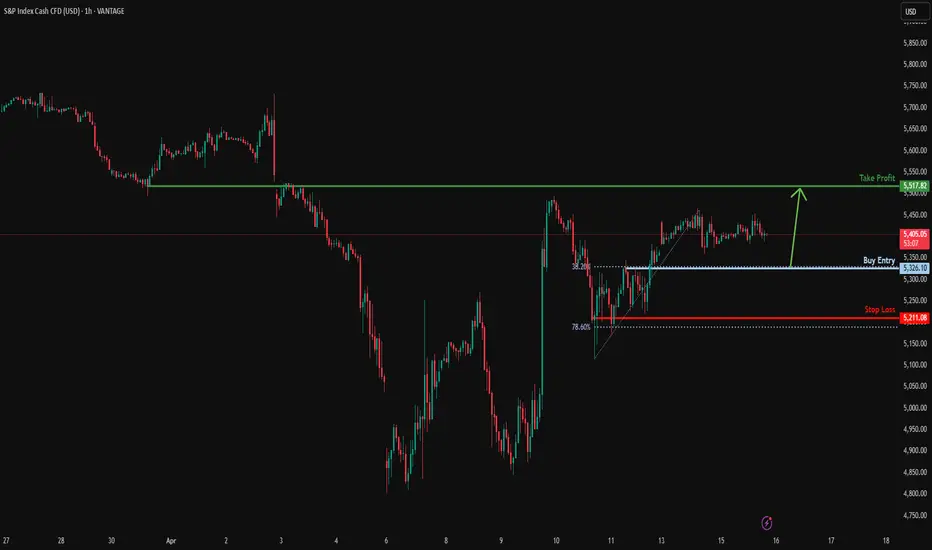
Bullish bounce off pullback support?S&P500 is falling towards the support level which is a pullback support that lines up with the 38.2% Fibonacci retracement and could bounce from this level to our take profit.
Entry: 5,326.10
Why we like it:
There is a pullback support level that aligns with the 38.2% Fibonacci retracement.
Stop loss: 5,211.08
Why we like it:
There is a pullback support level that lines up with the 78.6% Fibonacci retracement.
Take profit: 5,517.82
Why we like it:
There is an overlap resistance level.
Enjoying your TradingView experience? Review us!
Please be advised that the information presented on TradingView is provided to Vantage (‘Vantage Global Limited’, ‘we’) by a third-party provider (‘Everest Fortune Group’). Please be reminded that you are solely responsible for the trading decisions on your account. There is a very high degree of risk involved in trading. Any information and/or content is intended entirely for research, educational and informational purposes only and does not constitute investment or consultation advice or investment strategy. The information is not tailored to the investment needs of any specific person and therefore does not involve a consideration of any of the investment objectives, financial situation or needs of any viewer that may receive it. Kindly also note that past performance is not a reliable indicator of future results. Actual results may differ materially from those anticipated in forward-looking or past performance statements. We assume no liability as to the accuracy or completeness of any of the information and/or content provided herein and the Company cannot be held responsible for any omission, mistake nor for any loss or damage including without limitation to any loss of profit which may arise from reliance on any information supplied by Everest Fortune Group.
Bullish bounce?USO/USD has bounced off the support level which is an overlap support and could potentially rise from this level to our take profit.
Entry: 60.95
Why we like it:
There is an overlap support level.
Stop loss: 60.01
Why we like it:
There is a pullback support level that lines up with the 61.8% Fibonacci projection.
Take profit: 63.27
Why we like it:
There is a pullback resistance level.
Enjoying your TradingView experience? Review us!
Please be advised that the information presented on TradingView is provided to Vantage (‘Vantage Global Limited’, ‘we’) by a third-party provider (‘Everest Fortune Group’). Please be reminded that you are solely responsible for the trading decisions on your account. There is a very high degree of risk involved in trading. Any information and/or content is intended entirely for research, educational and informational purposes only and does not constitute investment or consultation advice or investment strategy. The information is not tailored to the investment needs of any specific person and therefore does not involve a consideration of any of the investment objectives, financial situation or needs of any viewer that may receive it. Kindly also note that past performance is not a reliable indicator of future results. Actual results may differ materially from those anticipated in forward-looking or past performance statements. We assume no liability as to the accuracy or completeness of any of the information and/or content provided herein and the Company cannot be held responsible for any omission, mistake nor for any loss or damage including without limitation to any loss of profit which may arise from reliance on any information supplied by Everest Fortune Group.

OM scalp long to $0.6751 areaJust now opened a scalp long on OM. Markets moving slow so testing the lower tf with my DTT strategy.
Lets see.
