Tesla - Major Breakout BrewingTesla has been going through the wringer, between Robotaxi news, tariffs and the ongoing feud between the most powerful man in the world (Trump) and the richest man in the world (Elon). No doubt the news has had its fair share of impact on the stock. But Technicals will always hold more weight than news. I'll breakdown a few reasons why I believe this stock is due for a major run to ATHs
As you can see on this 4H chart, a nice falling wedge is forming and PA is respecting it, even with the wild gaps. On top of this being a bullish pattern, TSLA is also in a crucial area of support within the $290s . If you look back to Jun 9th 2025, you can see Tesla bounced from the 281 level to the 330s which is another indicator of strong support. Not to mention, a the 50 MA crossed the 200 MA on the daily on July 1st which is another bullish indication. The wedge looks to bottom out at the 280 level but I don't see this stock going that low. $290, 291 is an optimal entry to go long.
The long term trend line from April 21st 2025 has not been completely invalidated as of yet. If it retests at 310 and falls back within the wedge, I am still bullish. If price falls under $280, I am bearish. But until then, load up because the next stop is $350 after breakout, then $400, then ATHs. I'm expecting the breakout to happen by earnings or potentially before if this unnecessary feud between Trump and Elon ends.
P.S. I didn't get a good entry on this trade but I have a long position due to expire on the 25th.
Good luck trading.
-AceBoogieWitMe
Trend Analysis

July 10th Market Outlook –Charted Waters & Uncertain Momentum🗓️📊 July 10th Market Outlook – Charted Waters & Uncertain Momentum 🌊⚠️
Today’s breakdown is a reality check for traders navigating a market full of setups but short on clarity. Resistance is stacking across the board, but that doesn’t mean we can’t break through — it just means we need to stay sharp and keep our charts close.
🔎 Highlights from the 19-minute video:
Bitcoin is approaching a third and crucial resistance test. A breakout could trigger ultra-FOMO, but failure here could send us lower.
Ethereum is in a pressure zone — the "Symplegades" setup from Greek mythology reflects today’s narrow trading path.
Bitcoin Dominance is clinging to support — if it breaks, altseason could be on. If it holds, alts may stay sidelined.
NASDAQ & Nvidia have delivered massive runs, but signs of exhaustion and reversal risk are showing.
Dollar Index (DXY) showing a Golden Cross, but unresolved rate expectations could catch markets off guard.
💬 I also speak candidly about market manipulation, being someone else’s exit liquidity, and why we might be heading toward a formative trap before any true breakout.
🎥 Watch the full video to catch all the details — from long-term setups to real-time chart reactions.
📌 Stay tuned for detailed updates today on Bitcoin, Ethereum, Bitcoin Dominance, NASDAQ and more.
One Love,
The FXPROFESSOR 💙
Disclosure: I am happy to be part of the Trade Nation's Influencer program and receive a monthly fee for using their TradingView charts in my analysis. Awesome broker, where the trader really comes first! 🌟🤝📈

AUDCAD Eyes Key Resistance: Will It Break or Bounce?AUDCAD Eyes Key Resistance: Will It Break or Bounce?
AUDCAD is approaching a significant resistance zone near 0.8980—the same level that capped price action in early July.
While the pair is showing signs of hesitation with small candles, this indecision may be tied to broader market uncertainty, including renewed concerns over Trump-era tariffs.
If we monitor for potential reversal signals around this level, it could present a solid trading opportunity.
🎯 My targets: 0.8930; 0.8905 ; 0.8870
You may find more details in the chart!
Thank you and Good Luck!
PS: Please support with a like or comment if you find this analysis useful for your trading day
Disclosure: I am part of Trade Nation's Influencer program and receive a monthly fee for using their TradingView charts in my analysis.

Gold Looks Bullish: technical and fundamentalHi Guys!
Gold is starting to flash major bullish signals, and this time, it’s not just about the chart. The technical setup is clean, but we’re also seeing fundamental tailwinds that could fuel a bigger move.
Let’s break it down
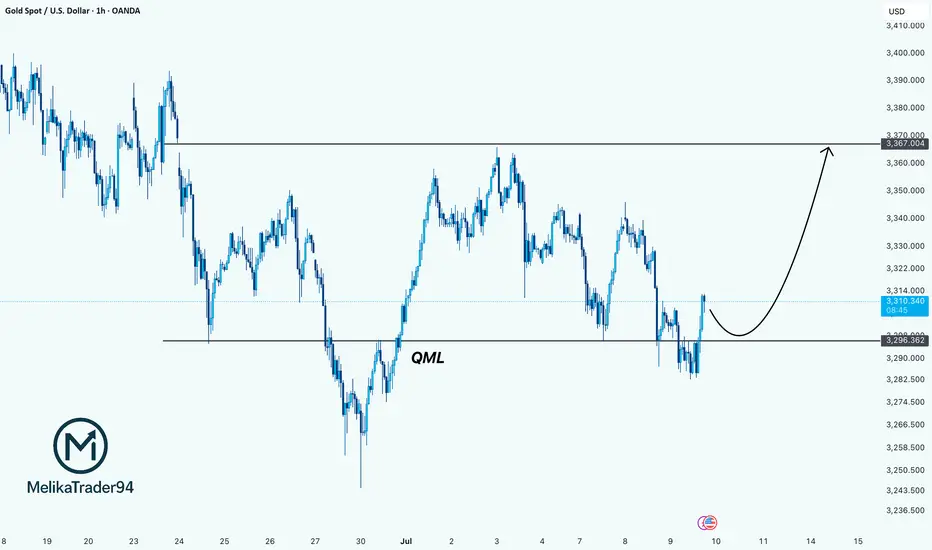
1. Technical Setup: The QML Reversal Is In Play
On the 1H chart, Gold is showing a textbook Quasimodo (QML) reversal pattern. Price made a lower low, then reversed up to break structure, and now it’s pulling back and respecting the key QML zone around $3,296.
This zone has turned into strong support. As long as we stay above it, the structure suggests a continuation toward $3,367 — a clean upside liquidity target and the previous high.
Strategy: Look for pullbacks into $3,296 for potential long entries with targets around $3,367 or higher.
2. Fundamental Tailwinds: Why Gold Is Gaining Strength
The fundamentals are stacking up in Gold’s favor right now. Here’s what’s fueling the move:
- Weakening USD & Rate Cut Expectations
With the Fed increasingly signaling rate cuts by late 2025, the US dollar is losing steam. Lower interest rates reduce the opportunity cost of holding non-yielding assets like Gold, making it more attractive to investors. Traders are already pricing this in.
- Softening Economic Data
Recent U.S. data, including weaker-than-expected job growth and declining manufacturing numbers, points to a slowing economy. That puts more pressure on the Fed to pivot dovish, which historically sends Gold higher.
- Central Bank Demand
Global central banks (especially in Asia) continue to accumulate physical Gold as part of their long-term reserve strategy. That institutional demand provides strong support at lower levels.
Technical + Fundamental = Strong Bullish Bias
We’re seeing a solid confluence here:
Chart says long (QML + bullish structure)
Macro says long (dovish Fed + weaker dollar + safe haven demand)
Drop your thought here!
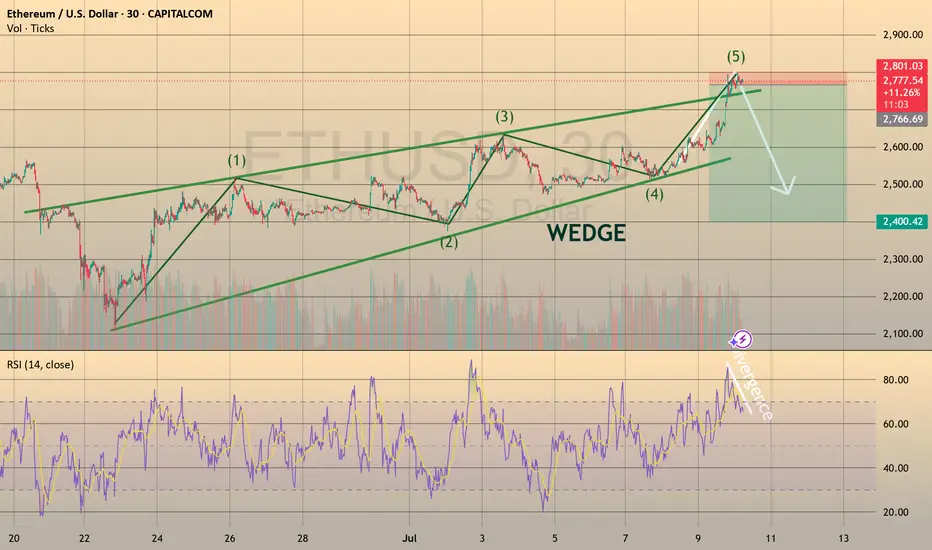
TRADING IDEA - ETHUSD SHORT
ETHUSD rose towards 2,700.00 level and reached the take profit. And even went further towards 2,800.00 resistance level despite my 2,700.00 retest predict! (pic 1)
So, congrats to everyone, who stayed long here, we took the cash!💵
I am preparing for the next trade. Here is the plan: if the price rises once again towards 2,800.0 resistance level and retests it, I will open the short position with
🔽 a pending sell stop order at 2796.84 with
❌a stop loss at 2818.86 and
🤑a take profit at 2740.05
Additionally, the RSI shows divergence on 30-m timeframe.
I suppose this to be quick trade. Will see how it will work out.
GOLD (XAUUSD): Classic Breakout Trading📈GOLD has surpassed and closed above a significant intraday resistance level.
After retesting this level, the price created a small ascending triangle on the hourly chart, and we've observed a confirmed breakout of its neckline.
I plan to go long on the pair during the retest, anticipating further growth, with the next resistance target at 3327.

GBPUSD: Two Strong Bullish Area To Buy From ?GU is currently in a bullish trend when examined on a daily time frame. There are two potential areas for purchase. The first area is currently active, as we anticipate a price reversal from this point. There is a significant possibility that price could decline to the second area and subsequently reverse from there directly. The sole reason we believe price could drop to the second area is if the US Dollar experiences corrections, which could cause GU to drop to our second area and subsequently rebound.
If you appreciate our analysis, we kindly request that you consider the following actions:
-Liking the Ideas
-Commenting on the Ideas
-Sharing the Ideas
We extend our sincere gratitude for your continuous support. We trust that our insights have provided even a modicum of assistance.
Team Setupsfx_
❤️🚀

SOL/USD 2H chart PATTERN.SOL/USD 2H chart, the price is forming a bullish ascending triangle breakout, and it's approaching the upper resistance trendline. If it breaks out with volume, a strong move upward is expected.
📈 Bullish Target Points:
1. First Target:
✅ $157.80 — This is the first horizontal resistance and initial breakout target.
2. Second Target:
✅ $162.00 — A higher resistance level based on previous highs and projected breakout momentum.
---
🔎 Additional Notes:
Support Level: Around $149.90 — also near the ascending trendline.
A confirmed breakout above the triangle with a daily candle close and strong volume would validate these targets.
Consider using a stop-loss below $149.00 if you're trading this setup.
Let me know if you want a trade entry suggestion or risk management strategy.

Lingrid | XRPUSDT Potential Upside BreakoutBINANCE:XRPUSDT is currently retesting its upward trendline and support near 2.20 after failing to hold above the June high. The asset remains in a higher-low structure with repeated attempts to break resistance around 2.35, indicating bullish accumulation. If the price holds this trendline, an upside breakout toward the 2.45 target zone becomes more likely.
📈 Key Levels
Buy zone: 2.20–2.17 (trendline + horizontal support)
Sell trigger: break and close below 2.15
Target: 2.45 resistance, followed by potential toward 2.60
Buy trigger: bullish reversal above 2.20 confirming trendline defense
💡 Risks
Breakdown below 2.20 opens downside risk to 1.92 support
Flat momentum may lead to range-bound movement
Resistance at 2.45 could stall rallies without volume support
If this idea resonates with you or you have your own opinion, traders, hit the comments. I’m excited to read your thoughts!

#EURNZD: Price Is Almost At The Buying Area! The EURNZD approaching buying zone will determine the future trend of the pair. We recommend waiting for the price to reach this area for strong confirmation. Using a smaller timeframe can provide a secondary perspective.
Good luck and trade safely!
Team Setupsfx_

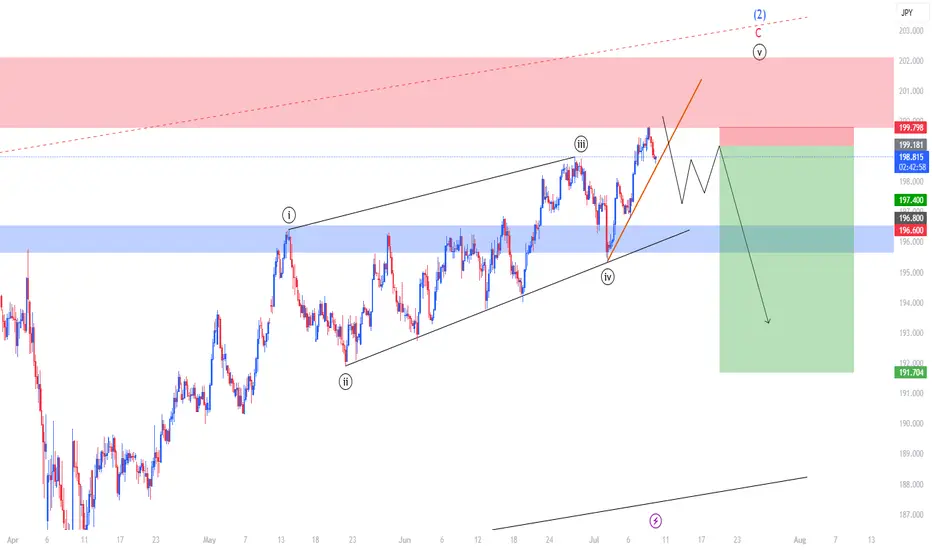
My View On GBP/JPYWhy I think the tops in
Elliott Wave Structure Completed
We’re now at the conclusion of a 5‑wave impulse (i→v) that tops off within wave (1), followed by an A‑B‑C corrective sequence. Wave C peaks right inside a major supply zone — classic exhaustion of bullish momentum.
Resistance & Trendline Rejection
Price hit a red supply/resistance area, tested it, and has already broken back below the short‑term upward trendline. That break is a reliable early signal that the uptrend is losing steam.
Bearish Continuation Pattern Forming
The drawn schematic suggests a sequence of lower highs is setting up—then a break toward the blue support zone near 196.60–197.40. All signs point to a deeper correction or even a fresh downtrend for wave (3).
Technical Confluence at Wave (2)
Wave (2) ends within multiple layers of resistance: a price zone, a wave count, and a rising wedge. Combined, this quadruple confluence is a textbook reversal scenario.
Macro factors support a top:
Central bank divergence is flattening
Yen may rebound on global uncertainty
Sterling faces domestic fragility
TradeCityPro | Bitcoin Daily Analysis #124👋 Welcome to TradeCity Pro!
Let’s dive into the analysis of Bitcoin and key crypto indicators. As usual, I’ll review the futures triggers for the New York session.
⏳ 1-Hour Timeframe
On the 1-hour timeframe, as you can see, Bitcoin made a bullish move yesterday after stabilizing above the 109391 level and managed to register a new ATH around the 112000 level.
⭐ The resistance at 111747 has effectively held back further price increases, and the price has reacted to it and entered a corrective phase.
✔️ I believe the correction could continue down to 110256. The next lower support levels are 109391 and 107853.
📈 If you already have a long position open, I recommend holding it. If the 111747 resistance breaks, a strong bullish trend could begin, and having an open position from earlier could have a big positive impact on your account.
🔼 If 111747 is broken, we can consider opening new long positions. If this level breaks, I’ll post a higher timeframe analysis to identify the next major resistance levels.
💥 RSI entering the Overbuy zone and rising volume would provide strong confirmation for this position.
👑 BTC.D Analysis
Bitcoin Dominance is still dropping. Yesterday, after breaking 64.81, it continued its downward move and is now approaching the 64.49 level.
🔍 If this level breaks, the drop could continue further, but in my opinion, after the recent drop, it's time for BTC.D to enter a correction phase.
📅 Total2 Analysis
Total2 has also had a bullish move, breaking through the 1.18 and 1.2 levels, and continues to rise.
🎲 The next resistance is at 1.24, which the price may target. However, I think there’s a high chance of a correction or consolidation phase starting soon.
📅 USDT.D Analysis
Looking at Tether Dominance, after the recent drop and the break of 4.72, it reached the 4.63 level and has formed a base there.
✨ If 4.63 breaks, USDT.D could head toward 4.56. In case of a pullback, the first level to watch is 4.72.
❌ Disclaimer ❌
Trading futures is highly risky and dangerous. If you're not an expert, these triggers may not be suitable for you. You should first learn risk and capital management. You can also use the educational content from this channel.
Finally, these triggers reflect my personal opinions on price action, and the market may move completely against this analysis. So, do your own research before opening any position.

THE KOG REPORT - UpdateEnd of day update from us here at KOG:
We wanted that lower level 3285 to hold which it did and give the move upside following the red box target levels which have worked well for today. As you can see, we're at red box here so there is a chance we may see a retracement in to the level shown below. It's that 3306-4 level that is the flip now and will need to break to go lower.
Support 3304 with key level resistance 3320. Below 3320, we're still bearish with another attempt on the 3300 level for the break.
From Camelot this morning:
Price: 3285
RED BOXES:
Break above 3290 for 3304✅, 3306✅, 3310✅, 3320 and 3324 in extension of the move
Break below 3279 for 3254, 3246 and 3240 in extension of the move
As always, trade safe.
KOG

Dollar I Daily CLS I KL - OB I Model 1Yo Market Warriors ⚔️
Fresh outlook drop — if you’ve been riding with me, you already know:
🎯My system is 100% mechanical. No emotions. No trend lines. No subjective guessing. Just precision, structure, and sniper entries.
🧠 What’s CLS?
It’s the real smart money. The invisible hand behind $7T/day — banks, algos, central players.
📍Model 1:
HTF bias based on the daily and weekly candles closes,
Wait for CLS candle to be created and manipulated. Switch to correct LTF and spot CIOD. Enter and target 50% of the CLS candle.
For high probability include Dealing Ranges, Weekly Profiles and CLS Timing.
Trading is like a sport. If you consistently practice you can learn it.
“Adapt what is useful. Reject whats useless and add whats is specifically yours.”
David Perk aka Dave FX Hunter
💬 Don't hesitate to ask any questions or share your opinions

What is Dynamic Support and Resistance Levels & Zones in Forex
Dynamic supports and resistances play a crucial role in technical analysis.
Unlike classic supports and resistances, these zones change and adapt to a market price action in real time.
Learn what is dynamic support and resistance in Forex, Gold trading and how to find it easily.
Discover its main types and real market examples.
Let's start with the basics.
There are 2 major types of supports and resistances in technical analysis.
The first type is called static .
Such supports and resistances are fixed and don't change with time.
It should be strictly horizontal key levels or the zones.
Market price action and momentum beyond them do not affect these supports and resistances.
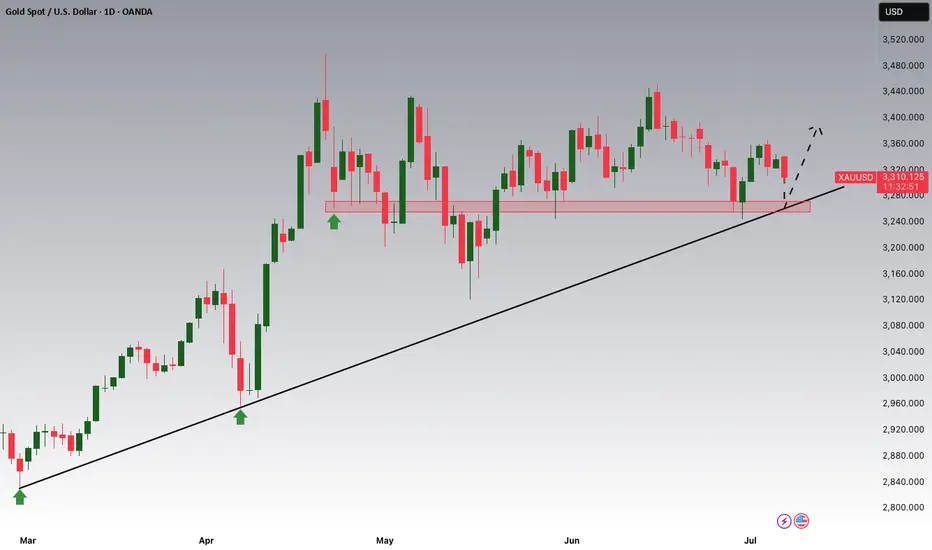
In the example above, you can find static supports and resistances on Gold. The market may return to one of those levels or the zones today, tomorrow or in a month, but it will not move.
In comparison to static supports and resistances, the dynamic ones shift with time. They constantly change and adjust as the time flies.
One of the obvious types of dynamic supports and resistances is a trend line.
Above is the example of a dynamic rising support based on trend line.
As the time goes, a support shifts and becomes higher and higher.
I found a great example of a dynamic resistance on Dollar Index.
Depending on the moment when the price tests that, the resistance will be on different levels.
The later the price tests the trend line, the lower is the resistance.
When newbie traders learn dynamic supports and resistances, they usually stop on trend lines.
But it is just a beginning.
Really significant dynamic supports are resistances will be the zones .
The areas based on static horizontal supports and resistances and trend lines.
Examine a price action on GBPCHF forex pair.
We have a static horizontal support area and a dynamic rising trend line.
Two supports intersect, composing a contracting dynamic support zone.
With time, it will become narrower, accumulating buy orders within.
On NZDCAD forex pair, I underlined a contracting dynamic resistance zone that is based on an intersection of a static horizontal resistance area and a falling trend line.
Selling orders will be distributed within.
The 2 dynamic support and resistance zones that we discussed are narrowing , but that is not always the case.
A dynamic support zone that I found on GBPNZD is expanding and broaden with time.
It is based on a dynamic falling trend line and a static horizontal support.
With time its boundaries will be wider and a bullish reaction may initiate from any level within that.
A dynamic resistance area that I spotted on EURCAD forex pair is a great example of an expanding resistance.
It is based on a static horizontal resistance and a rising trend line.
We can easily recognize how it grows with time.
Of course, another types of dynamic supports and resistances exist. But they are more nuanced and rare.
As soon as you learn to recognize the clusters that we discussed in this article, you will be able to recognize the less obvious ones as well.
Next time, when you execute a support and resistance analysis, try to find a dynamic zone. You can find it on any time frame, and forex pair and gold, and it will completely change your perspective on the market.
❤️Please, support my work with like, thank you!❤️
I am part of Trade Nation's Influencer program and receive a monthly fee for using their TradingView charts in my analysis.

GOLD: Long Trade with Entry/SL/TP
GOLD
- Classic bullish formation
- Our team expects pullback
SUGGESTED TRADE:
Swing Trade
Long GOLD
Entry - 3315.7
Sl - 3312.0
Tp - 3322.6
Our Risk - 1%
Start protection of your profits from lower levels
Disclosure: I am part of Trade Nation's Influencer program and receive a monthly fee for using their TradingView charts in my analysis.
❤️ Please, support our work with like & comment! ❤️

Ethereum Analysis – Vitalik’s Gas Cap Proposal Adds PressureToday, I want to show you the possible moves for Ethereum ( BINANCE:ETHUSDT ) this week.
Please stay with me .
Let’s first take a look at the important news that has come for Ethereum in the last 24 hours :
Ethereum’s Gas Cap Proposal Sparks Concerns
Ethereum co-founder Vitalik Buterin recently proposed EIP-7983 , introducing a gas limit cap to prevent potential DoS (Denial of Service) attacks on the network.
Bearish Takeaways:
This proposal reveals a current vulnerability in Ethereum’s infrastructure. If gas limits grow unchecked, nodes may fail to sync, leading to possible network instability.
Imposing a gas cap could temporarily reduce transaction throughput, affecting DeFi protocols and NFT platforms that rely on Ethereum’s scalability.
The market tends to react cautiously to core protocol changes, and this uncertainty could trigger short-term selling pressure.
Bullish Counterpoints:
The cap aims to strengthen the network’s long-term stability against spam and DoS attacks.
It’s still in the proposal stage, with no immediate impact on users or network performance.
Conclusion:
While the long-term impact may be positive, the short-term uncertainty and exposed risks provide a bearish narrative for Ethereum, especially amid growing competition from alternative chains.
--------------------------------------
Now let's take a look at the Ethereum chart on the 4-hour time frame .
Ethereum is currently trading near the Heavy Resistance zone($2,929-$2,652) and Resistance lines , and is also trying to break the Support line .
In terms of the Elliott Wave theory , it seems that Ethereum has completed the Zigzag Correction(ABC/5-3-5) , so we can expect the next bearish wave .
I expect Ethereum to fall to at least $2,433 AFTER breaking the Support line, and if the Support zone($2,491-$2,323) is broken, we should expect further declines.
Second Target: $2,374
Note: Stop Loss (SL) = $2,689= Worst Stop Loss(SL)
Please respect each other's ideas and express them politely if you agree or disagree.
Ethereum Analyze (ETHUSDT), 4-hour time frame.
Be sure to follow the updated ideas.
Do not forget to put a Stop loss for your positions (For every position you want to open).
Please follow your strategy and updates; this is just my Idea, and I will gladly see your ideas in this post.
Please do not forget the ✅' like '✅ button 🙏😊 & Share it with your friends; thanks, and Trade safe.

Floki (FLOKI): Looking For Buy Entry | Aiming For +22%Floki has been in a healthy bullish trend here after buyers overtook the zone of EMAs. With current momentum on markets, we might see a proper breakout from the local resistance area, which is marked as our entry as well.
As soon as we see a breakdown there, we are going to go into a long position, but keep in mind—there is a huge bearish CME gap that we have to pay attention to, as if we see any strong sell-off, then this would be our target for short.
Swallow Academy

Gold is Nearing The Daily TrendHey Traders, in today's trading session we are monitoring XAUUSD for a buying opportunity around 3,260 zone, Gold is trading in an uptrend and currently is in a correction phase in which it is approaching the trend at 3,260 support and resistance area.
Trade safe, Joe.
BITCOIN - SELL TO $86,000 (8H UPDATE)Bitcoin spiked up last night, but just about missed our 'Invalidation Zone' of $112,140 by a few pips. As long as this level can hold & sellers move back down, this sell analysis is still valid.
A lot of whipsaw price action in the markets right now, so use stick risk management.

GBPNZD CUP and handle PatternGBPNZD is currently trading within a range-bound structure. The price was recently rejected from the resistance area near 2.2700, but found strong support at the 0.618 Fibonacci retracement level, indicating bullish interest at lower levels.
The pair has now formed a cup and handle pattern—typically a bullish continuation signal—which suggests a possible retest of the 2.2700 resistance zone in the near term.
A breakout above this level, if supported by volume and momentum, could signal the beginning of a larger upward move. Until then, the range remains intact, and traders may look for buying opportunities on dips, with stops below the handle's low.

Hellena | GOLD (4H): LONG to resistance area of 3397 (Wave 3).Dear colleagues, my previous forecast remains valid, but I have decided to update it.
At the moment, I still think that wave “3” of the medium order continues its upward movement.
At the moment, I think that the small correction in wave “2” is ending and we will see a continuation of the trend. I see the resistance area of 3397.94 as the target. The main thing is to overcome the local level of the small wave “1” at 3366.37.
Manage your capital correctly and competently! Only enter trades based on reliable patterns!

USD/CHF Breakout Done , Long Setup Valid To Get 100 Pips !Here is my opinion on USD/CHF , We have a clear breakout and the price now above my support area , i`m waiting the price to go back to retest it and then give me any bullish price action and i will enter a buy trade , the reason for cancel this idea , if we have a daily closure again below my area.

USDJPY : More Upside Ahead?USDJPY : More Upside Ahead?
USDJPY remains firmly in a bullish trend, largely driven by renewed tariff concerns.
The yen weakened sharply after U.S. President Donald Trump reaffirmed plans to impose 25% tariffs on Japanese goods starting August 1st.
Since that announcement, USDJPY has rallied nearly 200 pips before encountering some profit-taking.
Despite the brief pause, the broader trend remains intact, and the pair appears poised for further gains.
Key upside targets to watch:
146.95
147.80
148.40
You may find more details in the chart!
Thank you and Good Luck!
PS: Please support with a like or comment if you find this analysis useful for your trading day
Disclosure: I am part of Trade Nation's Influencer program and receive a monthly fee for using their TradingView charts in my analysis.
