Sep 5, 2025 - BTCUSDT Multi Time Frame Chart Analysis-04Intro
Today I want to approach the market from the top down — starting with the higher timeframes and gradually moving lower — to refresh my overall outlook. Ideally, I’d do this after each weekly candle close, but I’ve decided to try it today as part of my decision-making process.
I generally prefer to react to the market rather than predict it, but in order to prepare my reactions ahead of time, I want to see whether Bitcoin shows any signs of correction in the weekly timeframe. Of course, September’s fundamental events could heavily influence market direction, but for now, I’ll stick to the technical picture.
1️⃣ Weekly Timeframe
The weekly chart clearly shows Bitcoin in a strong uptrend . Price remains above the rising trendline, consistently printing higher highs and higher lows.
* One observation: the percentage growth after each rally is slowing, but the absolute growth remains relatively constant at around $45,000 per leg. This suggests that if price rejects from the trendline again, the next potential target could be around $150,000, which also aligns with Fibonacci extensions.
So far, there are no signs of a trend reversal .
⚠️ However, according to Dow Theory , volume should confirm the trend — yet Bitcoin’s weekly volume has been declining. This is an early signal of potential weakness.
➡️ For now, the weekly structure doesn’t indicate a correction, but if the weekly trendline breaks, we’ll reassess.
2️⃣ Daily Timeframe
Currently, Bitcoin is ranging between 101,000 and 123,600 . Despite the broader bullish bias, both lower highs and lower lows have appeared recently, signaling weaker bullish momentum.
* With the latest correction from 123,000 to 112,300 , the price is now closer to its long-term trendline than ever before.
* We don’t yet have confirmation that the correction is finished, but there are hints:
1- Momentum on the downside has slowed. We’re even seeing the first equal high formation — if a higher low + higher high follows, that would confirm a trend shift.
2- Inflows: During the last bullish leg in the 4H chart, Bitcoin dominance also made a bullish leg, suggesting fresh money entering Bitcoin. But since dominance is still in a larger downtrend, this could just be a corrective bounce.
📌 With today’s important news release, if data favors crypto, we could see a continuation to the upside. If not, I expect Bitcoin to revisit its long-term trendline first before deciding the next move.
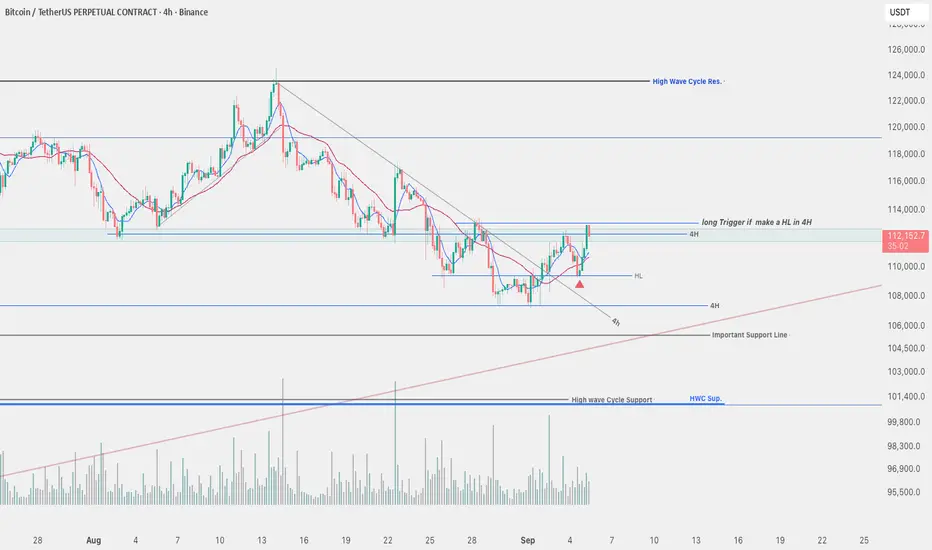
3️⃣ 4H Timeframe
The daily correction looks like a clean descending trend on the 4H chart, with clear lower highs and lower lows.
* This channel has now been broken.
* A higher low has already formed.
➡️ If today’s long trigger breaks, it could be a good long opportunity provided BTC dominance rises alongside Bitcoin.
Otherwise, it may be more reasonable to look for long setups in altcoins.
Trend Lines
How to find the best entry point in the gold market?Today's non-farm adjustment idea is bearish on gold and bullish on the US dollar. Each time ADP is the opposite of non-farm. The current market expectation is also bearish for gold and the opposite of ADP. Technically, the continuity of the bull market in gold is indeed not as strong as before, and the daily K price has gradually returned to the track. There was no continuity in the breakthrough near 3560 in the morning and it still fluctuated and fell. In the morning, I made 150 pips by shorting at 3560. During the European session, I shorted at 3555-3565 and looked at the range of 20-30 US dollars.

Gold before NFP (what are the new targets?)Gold has recently reached a new all-time high at $3,578. In my view, today's NFP and Unemployment Rate generally favor the U.S. dollar, which could initially push gold lower toward the $3,500 level — a key psychological round number. However, in the bigger picture, gold still looks bullish both technically and fundamentally, especially with the Federal Reserve expected to start cutting interest rates soon. This could eventually drive prices higher, potentially toward $3,600 and beyond to new record highs.
short term targets: 3535 - 3527 - 3510
keep an eye on news...
Do not forget risk management.
good luck

Darvas Box Breakout or Breakdown – $NLRThe VanEck Uranium and Nuclear ETF (NLR) is consolidating in a Darvas Box range between $107–122 while holding its broader rising channel. This zone is key for the next directional move:
A breakout above $122 would confirm bullish momentum, with upside potential toward the channel’s upper boundary around $135–145.
A breakdown below $107 would invalidate the current uptrend structure, exposing downside toward the next major support around $98–100.
Trade Plan:
Bullish Entry: Daily close above $122
Target: $135–145
Stop Loss: Below $118
Bearish Breakdown: Close below $107
Target: $98–100
Stop Loss: Above $112
This setup provides clear breakout and breakdown scenarios, making AMEX:NLR a key ETF to watch for trend continuation or reversal.

Trade idea update on GBPUSDMarket has been choppy but that’s the importance of a good SL placement. The good position we placed our SL helped us survive the noise in the market till Tp

GBPUSD InsightHello to all our subscribers,
Please share your personal opinions in the comments. We appreciate your boosts and subscriptions.
Key Points
- Eurozone retail sales in July, seasonally adjusted, fell 0.5% from the previous month, missing market expectations of -0.2%.
- U.S. Department of Labor reported 237,000 initial jobless claims on a seasonally adjusted basis, higher than the market forecast of 230,000.
- The ISM Services PMI for August came in at 52.0, beating market expectations of 51.0, marking three consecutive months of expansion and easing concerns over an economic slowdown.
Major Economic Events This Week
+ September 5: U.S. August Nonfarm Payrolls, U.S. August Unemployment Rate
GBPUSD Chart Analysis
After briefly breaking below the 1.34000 line, the support level was breached, but it successfully rebounded near the 1.33000 line, showing that the upward momentum is still intact. A rise toward the 1.36000 level can be anticipated. Upon reaching that zone, we will observe price action and establish a new strategy accordingly.

Looking for $20 pullback to $35I'm waiting for PRM to pullback to $20, with a target of $35.
Good luck!

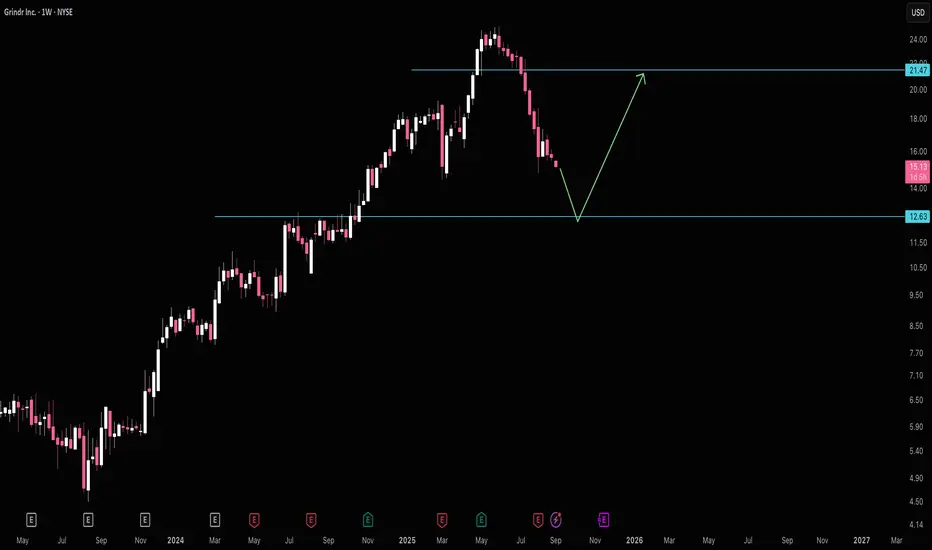
Grindr Searching for Support near $12Grindr is middle of the range right now looking for $12 support to hold. If so we should head back up to $21.
Good luck!
Follow and make money, the latest analysis ideas for the dayLast night, I shared my swing trading strategy for everyone to consider. I started holding short positions around 3565 and gradually increased my position as the price rose. Gold prices fell over $60 today, and anyone who followed my strategy will surely see good returns.
ADP data will be released tonight, which will also provide some reference for tomorrow's NFP data. Gold has been rising continuously recently, which is obviously to expand the price range of gold and prepare for the subsequent waterfall. Judging from the hourly chart, if gold cannot effectively return to above 3550 in the short term, then I think gold will continue to fall. First, it will touch the previous top and bottom conversion range of 3520-3500 to test the effectiveness of the support below. At present, we should not blindly follow the voices from outside the market, but just stick to our own trading ideas. The real big change should be in tomorrow's NFP data. If the NFP data and the interest rate cut basis points are lower than expected, the market will continue to fall.

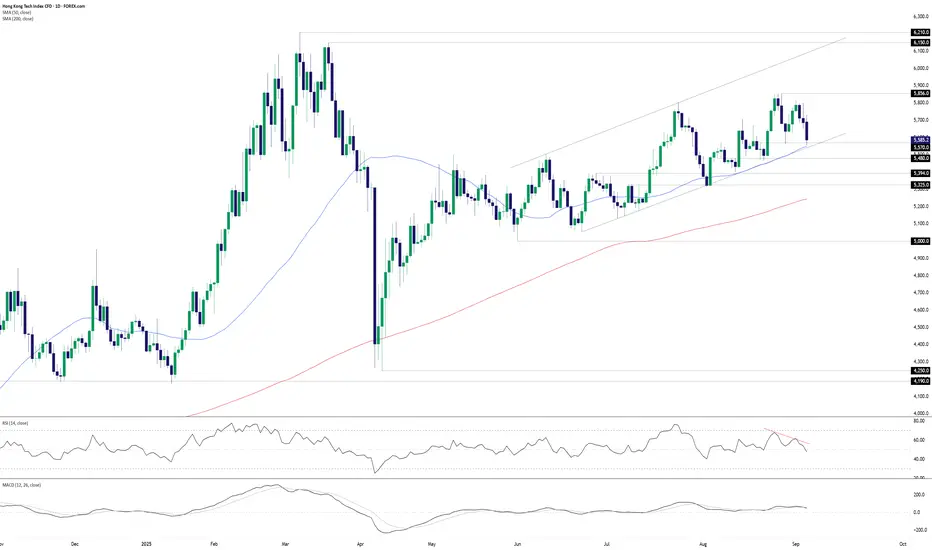
Hang Seng Tech: Bulls and bears face off at key supportThe downside we were looking for in Hang Seng Tech has played out quickly, with the trade hitting its initial target in less than three days. Price is now sitting at a known support level, creating the opportunity to assess both bullish and bearish setups depending on how it closes the session.
If it can finish above the 50DMA and channel support, longs could be established with a tight stop beneath the uptrend for protection. 5700 is the first obvious target given it’s a big figure, with a push through that improving the odds of a retest of resistance above 5800.
If it closes beneath the 50DMA and channel support, the setup flips. Shorts could be established on the break with a stop above the 50DMA for protection. Downside targets include 5480, 5394, or 5325 — pick the one that best matches your preferred risk-reward profile.
Momentum signals are leaning bearish. RSI (14) has slipped below 50 and continues to trend lower, while MACD has staged a bearish crossover, though it remains in positive territory — more a cautious warning than a definitive bearish tilt.
That said, the broader bias remains bullish with both the 50 and 200DMAs still trending higher despite the recent pullback.
Good luck.
DS
Silver on the path of growth and developmentAs I mentioned in the previous article, silver is moving towards the desired target, which is around $40 per ounce of silver. As you can see, this three-month chart and the uptrend drawn and reproduced shows the desired price target near the top of the channel.
If there is a change and an update is needed, I will definitely check and publish it again.
Good luck.
MJ .REZAEI

Trendline Break — SHORT SetupOn the 15-minute chart, Gold has been in a steady uptrend, supported by a rising trendline. Price recently tested the 3579 level but has since shown signs of rejection and is now breaking below the trendline support.
This breakdown suggests that bullish momentum may be fading, opening the possibility for a short-term pullback. The immediate downside target is around 3545–3550, which aligns with both the 200 EMA and a prior support zone.
Trade Setup:
• Entry: Below trendline break (~3569)
• Stop Loss: Above recent high (~3579.7)
• Target: 3545–3550 zone
If the price reclaims and holds above the recent high, this bearish idea will be invalidated. Until then, the bias favors a corrective move lower.

It is the right time to arrange short positions.Gold is clearly showing signs of stagflation at a high level, and there is a certain need for adjustment in the short term. Against this background, participating in short orders with light positions at high levels is a relatively reasonable response strategy. However, it needs to be emphasized again that one should not be too aggressive during the operation, especially when profits are gradually emerging. Protective measures should be taken in a timely manner to ensure that existing profits are secured while maximizing the profit space within the controllable risk range.
Judging from the current trend, if trading discipline is strictly enforced, short-term traders can try shorting with a light position in the 3575-3585 area, but remember not to blindly pursue excessive profit margins. Steady profit-taking is the core principle. After completing the phased operations, the focus should be on the support performance of the 3550-3530 area, and new layout opportunities should be considered based on the stabilization of the market.

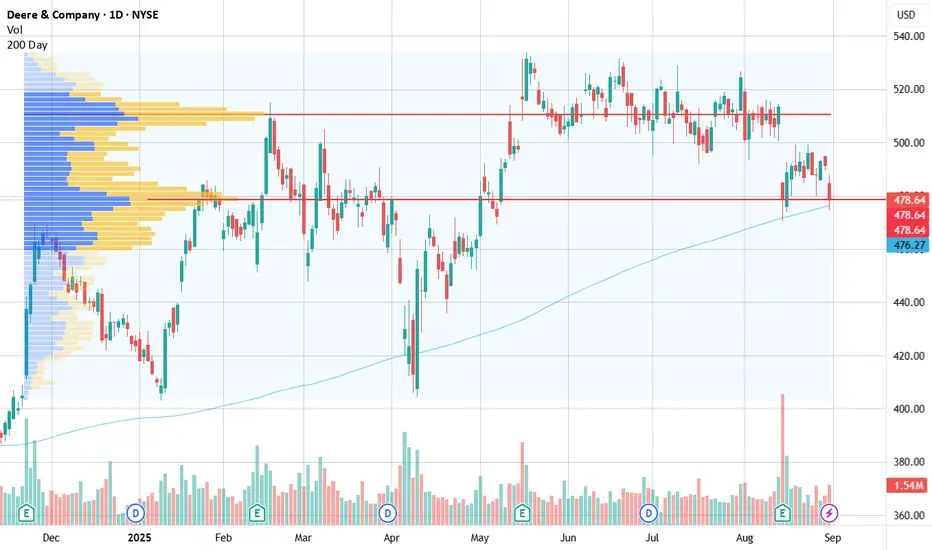
DE and it Potential Fall in PriceDE touched its 200 SMA on 08/14 and 08/29. It is also sitting on its volume profile node at $478.64. Momentum could swing this stock price down and fast
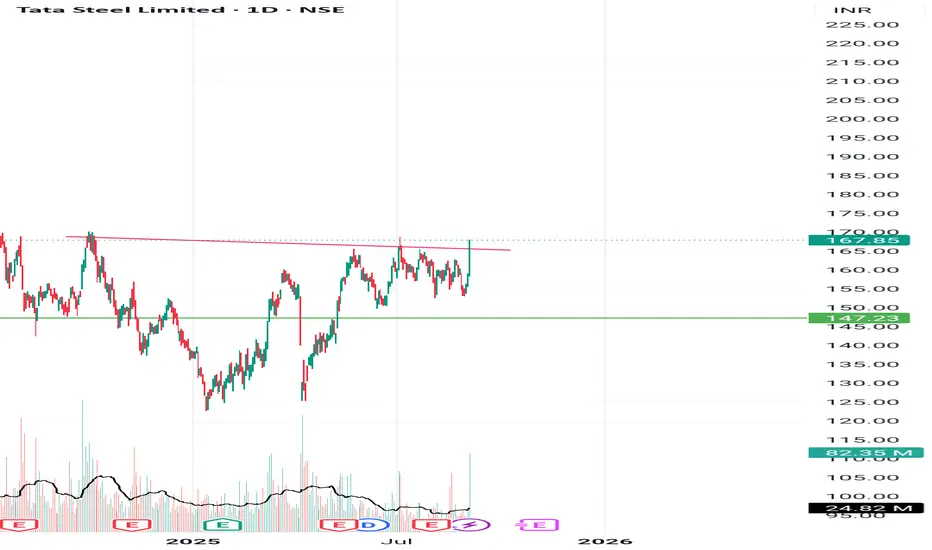
Clear breakout with good volume Breaked a clear trendline cum cup and handle pattern with decent volume indicates to go up. Do your own analysis and take up your trade
***Educational purposes only***
ISRG Looking for $404I'm hoping to catch Intuitive Surgical at $404 support and looking for a move to $687.
ISRG doesn't always make it to support so this might not actually hit $404, but one can hope.
Good luck!

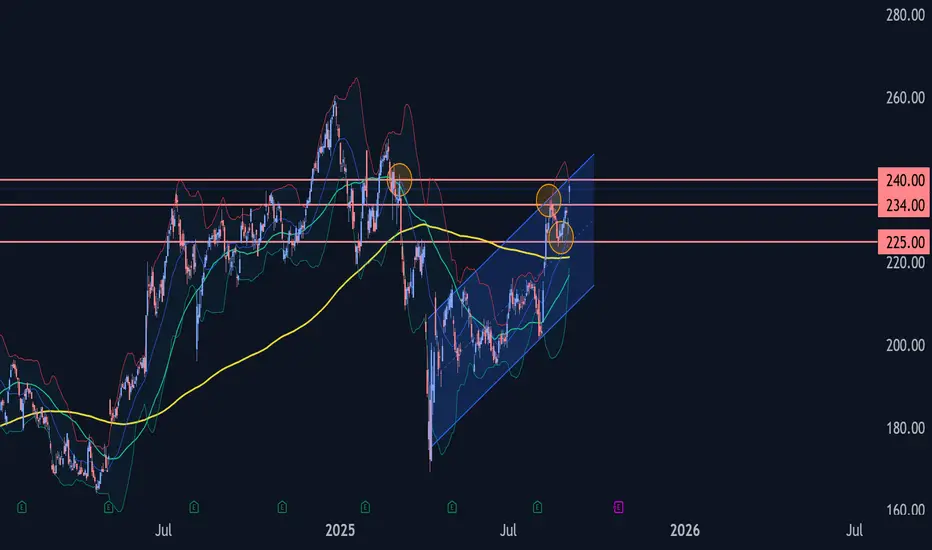
Apple Wave Analysis – 3 September 2025- Apple broke the resistance level 234.00
- Likely to rise to resistance level 240.00
Apple recently broke with the upward gap above the resistance level 234.00, which stopped the previous minor impulse wave 1 at the start of August.
The price earlier reversed from the support level 225.00 (former strong resistance from March and April).
Given the multi-month uptrend, Apple can be expected to rise to the next resistance level 240.00, former resistance from the start of March.
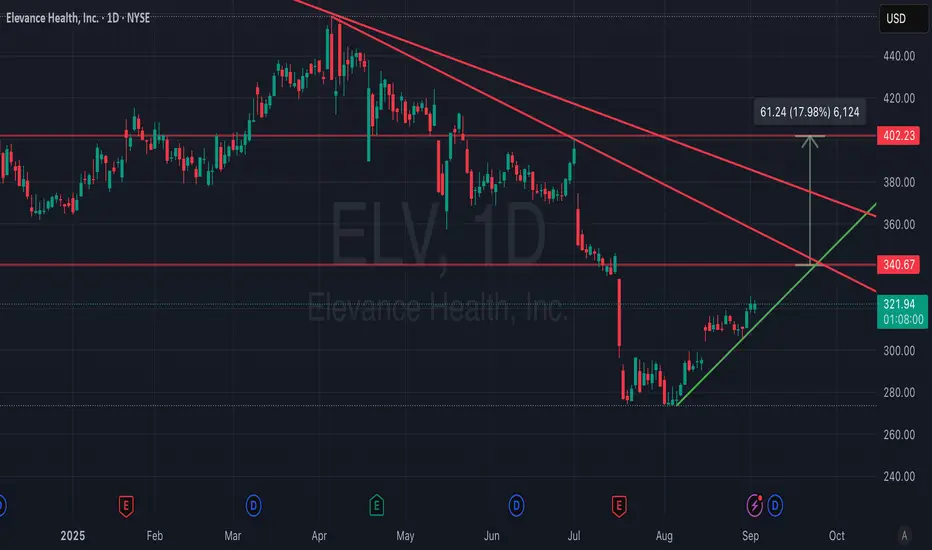
Elevance Health (ELV) – Trendline Reversal and Breakout SetupElevance Health ( NYSE:ELV ) is pushing higher along a rising trendline and is now testing a critical resistance zone around $340.67. A breakout above this level would signal a bullish reversal, with upside potential toward $402 (~18% move).
Entry trigger: Breakout above $340.67 with confirmation.
Profit target: $402.23 (major resistance / measured target).
Stop-loss: Slightly below $340.67 (the breakout line).
The structure shows momentum shifting to buyers. A confirmed breakout above $340.67 could trigger continuation strength toward $402.
Trading Plan: Wait for breakout confirmation. Target $402 while protecting downside with a stop just under $340.
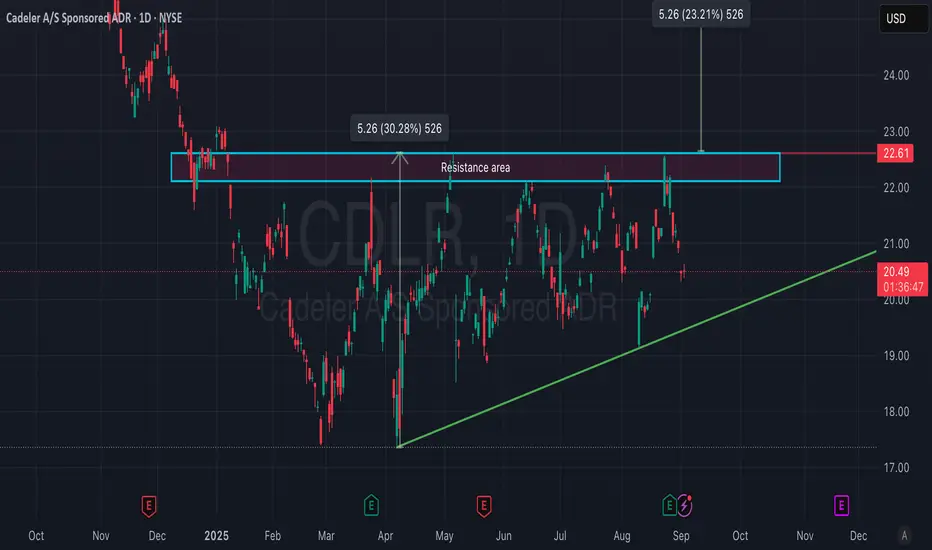
Cadeler A/S (CDLR) – Ascending Triangle Breakout WatchCadeler A/S ( NYSE:CDLR ) is testing the $22.60 resistance area within an ascending triangle pattern. A breakout above this zone could trigger a continuation move to the upside.
Entry trigger: Breakout and close above $22.60 resistance.
Profit target: Around $28.75 (previous major high), ~23% potential upside.
Stop-loss: Slightly below $22.00, just under resistance.
The structure of higher lows indicates buyers are building pressure against the resistance. A confirmed breakout with volume could provide a strong risk/reward setup.
Trading Plan: Look for a clean breakout above $22.60. Target $28.75 while protecting downside with a stop just under $22.
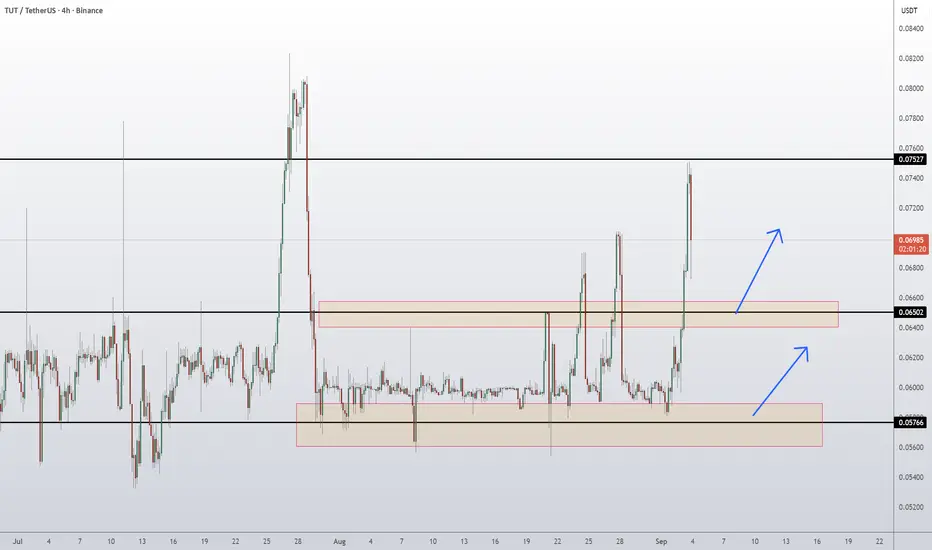
TUT Coin Tutorial Token Price News Today - Price PredictionTUT has recently surged from the 0.0585 support zone, breaking through mid-range resistance at 0.0650 and testing the upper resistance near 0.0755. Price has shown strong bullish momentum, but the sharp rejection wick at the top suggests sellers are defending the 0.0755 barrier. This aligns with the historical supply zone seen in late July.
As long as price remains capped below 0.0755, there is risk of a downside retracement back into the 0.0650 zone. If buyers reclaim and sustain above 0.0755, however, momentum could extend toward new highs.
📊 Key Levels
Support 1: 0.0650 (mid-level support)
Support 2: 0.0585 (major base support)
Resistance: 0.0755 (major cap zone)
Trading Scenarios
📉 Bearish Setup
Sell trigger: Rejection at 0.0755
Sell zone: 0.0735 – 0.0755
Target: 0.0650 support
Invalidation: Break and close above 0.0765
📈 Bullish Setup
Buy trigger: Break and hold above 0.0755
Buy zone: Retest of 0.0750–0.0760 as support
Target: 0.0820–0.0850 extension
Invalidation: Drop back below 0.0730
Summary
Momentum is bullish short-term, but 0.0755 is a key decision level.
A rejection favors a move back to 0.0650.
A breakout above 0.0755 opens path to higher highs.
👉 Follow me for More Real Time Opportunities.
Share your Thoughts if you have any?
Supply and Demand Game ...Both Parabolic Sar and Stochastic indicators show bear investors are interested in the market. Now market in down trend lets see who wins bears or Bulls

A pullback in gold is an opportunity!Gold perfectly met expectations today. Bulls fermented and fluctuated to prepare for a sprint. It broke through a new high again and touched the line near 3361 before fluctuating. The market will continue to pay attention to the line near 3565-3580. The bulls rushed high and fell today, fluctuating in the range of 3526-3540. We have also given strategies and ideas for range operations, and friends who follow me can see it.
Judging from the current gold trend, gold is trading sideways during the day to correct itself by exchanging time for space. Before there is a large-scale pressure signal, we will maintain a bullish trend. The upper target is around 3560 first, and it can reach 10-20 US dollars if it breaks above. The recent bullish target is around 3600 first. The 4H relies on the unilateral moving average to rise strongly. The operation is mainly to go long on pullbacks. The short-term support below is 3540-3530, with a focus on 3525-3520. We will not participate in any counter-trend short orders. I will provide you with the specific operation strategies at the bottom, please pay attention to them in time.
Gold operation strategy: Go long on gold when it retraces to around 3540-3530, increase long position when it retraces to around 3525-20, target 3560-3565, continue to hold if it breaks through.

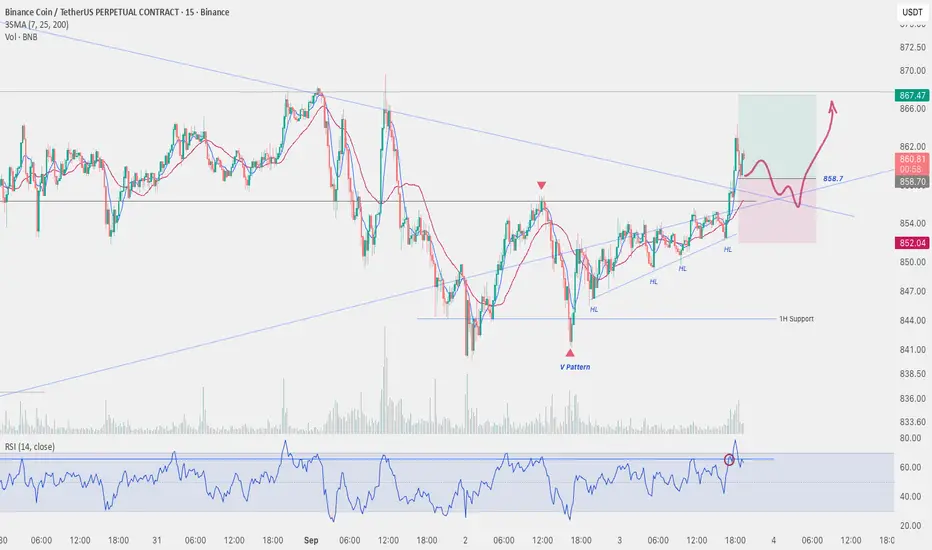
Sep 3, 2025 - BNBUSDT Long Position ReviewFor my last position today, I opened a long trade on BNB . After the price touched and reacted to the daily ascending trendline, I set my entry trigger above the first 1H resistance at 856 . Similar to other coins, the V-pattern that formed before the breakout gave me additional confidence in the bullish move.
Once the strong 1H candle closed above resistance, I placed a buy stop order above its wick at 858.7 for extra confirmation, which eventually triggered my entry.
I must admit, this trade was a bit emotional — it would have been better to wait for a confirmed medium wave cycle bullish structure before entering. On top of that, the BNB/BTC chart doesn’t look very bullish, which suggests I might have found a better setup on other coins. The main reason I rushed was the opportunity to use relatively high leverage on this setup.
📌 Stop-Loss Strategy
The main strength of this trade is the well-positioned stop-loss. Even if price decides to retest the broken descending trendline with a pullback, my stop would not be triggered prematurely.
⚠️ Overall, this is a risky position that is currently open. If I notice weakening bullish signals, I’ll likely exit early.
BNBUSDT Highwave-Cycle on 4H Timeframe:
BNB/BTC Chart: