CHFJPY: One More Buying Opportunity 🇨🇭🇯🇵
One more buying opportunity for today is on CHFJPY pair.
After a test of key daily support, the price formed an ascending
triangle pattern on an hourly.
We see a positive bullish reaction of the price after a breakout of its neckline.
The pair may reach 169.45 level soon.
❤️Please, support my work with like, thank you!❤️
Triangle

RGR 10/14/2023RGR
Daily chart analysis
RGR experienced an uptrend between March and August 2020. The uptrend was broken in August, leading to a sideways market / distribution stage that persisted for the next two years until August 2022. Following this, the price broke down from the sideways market, entering a downtrend with a sharp move down and finding a bottom at the end of September 2022.
A pullback occurred after the breakdown, lasting throughout Q4 2022. The price pulled back to the previous support area, attempting to turn it into resistance and continue the downtrend. Since the pullback, the price has been consolidating in the form of a descending triangle throughout 2023.
Currently, the price sits at the resistance area of the descending triangle. Concurrently, there's an 'overbought' signal on the stochastic indicator, and the price is under the 200ema.
RGR is presently in a bearish pattern (descending triangle), at a resistance level with an 'overbought' signal, and the previous trend was/is downward (price under the 200ema). These factors collectively suggest a high probability for a short trade.
Entering trade short
Entry: 54.34
Stoploss: 57.27, -5.39%
Target: 40.11, +26.11%, 4.84 RR ratio

TEL Symmetrical Triangle or Bull Flag ComparisonIs this a Symmetrical Triangle or Bull Flag?
Here is how we decide. The triangle is in white, the flag is in pink.
Symmetrical Triangle:
higher lows and lower highs, representing a period of consolidation and indecision.
The breakout direction typically depends on the preceding trend
Bull Flag:
A bull flag appears after a strong upward move (the “flagpole”) and consolidates downward in a parallel or slightly sloping trend.
It signifies a continuation pattern, with a breakout expected to align with the prior uptrend.
Analysis
The prior move has seen strong upward momentum (55%, 44%, 33%), which supports the idea of a bull flag if the triangle is sloping slightly downward.
However, if the triangle is symmetrical with equal pressure from buyers and sellers (not tilted), it’s likely a symmetrical triangle signaling indecision. I believe this is tilted upwards, signifying bullish. This is confirmed by the fact that net volume is $11 million above sell volume at time of writing.
If it’s breaking above the triangle now and aligns with my target of $0.009, the breakout could validate it as a bull flag continuation pattern.
2. Key Factors Supporting the Analysis:
Bounce off the 100-day Moving Average:
A bounce off a significant moving average like the 100-day MA is typically bullish, indicating that buyers stepped in at a key support level.
Breakout Above Triangle:
Early signs of breakout above the triangle suggest bullish momentum building up. If confirmed with volume, this supports the bull flag hypothesis.
Upcoming Catalyst (Public Hearing):
The public hearing for Telbank approval on December 5 could drive speculative buying, adding bullish momentum. There may be a small sell the news effect, but if the hearing is positive this won't last for long.
Short-Term Target ($0.009):
If this really is a bull flag, the measured move target can be estimated by the height of the flagpole (the previous upward move) added to the breakout point.
Risks to Watch:
False breakouts are common in symmetrical triangles. Watch volume closely to confirm the breakout.
If the price falls back below the 100-day MA, it could invalidate the bullish setup.
Summary:
Given the price action and catalyst, the pattern appears more like a bull flag continuation. Monitor the breakout level and volume for confirmation. If the pattern holds, the short-term target of $0.009 seems reasonable.

GBPUSD → Counter-trend correction before further declineFX:GBPUSD within the correction reaches a zone of interest and resistance from which the decline may resume as the dollar returns to a northbound rut ...
Traders continue to fight for the 1.267 area, an area that is a strong enough support. Buyers don't have much of a chance as the dollar looks quite strong on the back of Trump's policies and is putting quite a lot of pressure on the forex market.
Technically, the downtrend is the priority and we will be pulling back from it. Key zones: 0.5 Fibo and the boundary of the downtrend. False breakout may provoke further decline.
Resistance levels: 1.275, 1.284
Support levels: 1.267, 1.264
False breakout of resistance will indicate the bears' domning and may provoke further selling. It is also worth emphasizing 1.267-1.264. A breakdown and consolidation of the price below this zone will also confirm the bears' intention
Rate, share your opinion and questions, let's discuss what's going on with ★ FX:GBPUSD ;)
Regards R. Linda!

TON → One step away from a rally. Trying to change the trendBINANCE:TONUSDT is coming out of a prolonged consolidation, but only one action separates us from the distribution phase. The bitcoin rally is favorable for many altcoins....
In my opinion, TON is a rather undervalued project that has a fundamentally significant base (many altcoins cannot boast of this).
Technically, the consolidation lasted for almost 9 months and, consequently, this energy should be used somewhere. The exit of the price from the accumulation begins to show us in which direction the distribution is likely to go.
The focus is on 5.420 and 5.150. If the bulls hold their defenses above this zone, the coin could show a flight to the moon in the long run. But don't look at cryptocurrencies with rose-colored glasses, assess the situation relative to the risks!
Resistance levels: 5.420, 6.133
Support levels: 5.151, 4.51
The price is breaking the resistance of the bullish pattern (descending wedge or descending triangle), we have to wait for confirmation that the trend change will be true. The fight for 5.420 continues. Let's keep an eye on this zone ;)
Rate, share your opinion and questions, let's discuss what's going on with ★ BINANCE:TONUSDT ;)
Regards R. Linda!

GBPAUD strong bullish expectations
GBPAUD trend based analysis, we have seen in the last periods bullish trend, currently price on zone and we can see ASCENDING TRIANGLE pattern, +technicals are strong bullish.
SUP zone: 1.94200
RES zone: 1.96300, 1.96800

This is going to explodeAscending triangle, very strong. I just bought calls $320, 1/03. Buying the stock or CONL also good. Let's go!

Palo Alto - $PANW Retesting now Higher Later! 31% UpsideChart #19/ 40: NASDAQ:PANW 💻
-Ascending Triangle Breakout with Retest
-H5 Indicator is Green
-Williams Consolidation Box Thriving
-AVP Shelf to launch off into ATH's
🎯$440📏 $503⏳ Before SEPT2025
NFA

Bitcoin can correct to support line and then continue to growHello traders, I want share with you my opinion about Bitcoin. Observing the chart, we can see how the price started to grow inside the pennant near the support line and later reached the 93500 support level, which coincided with the support area. Soon, the price broke this level and continued to move up to the resistance level, which coincided with the seller zone and even entered to this area, after which it reached the resistance line of the pennant. Then BTC turned around and declined to support line and later exited from the pennant pattern, after which little fell and then rose to the 98500 level. BTC tried to break it, but failed and dropped to support level firstly and soon broke this level too and fell until to 90785 points. Then Bitcoin turned around and rose to the 93500 support level, broke it, and later rose to the resistance level. After this, the price turned around and made correction to support line of triangle, but a not long time ago it turned around and started to grow. So, in my opinion, the price can decline to the support line and then continue to grow to the resistance level. When the price reaches this level, it can break it, thereby exiting from the triangle also and then going next, making firstly retest or without it. For this case, I set two TP: first at the 98500 level, and second at 100500 points. Please share this idea with your friends and click Boost 🚀

Symmetrical Triangle on the XRP Monthly chart ready to breakout?This Triangle can also be seen well on the weekly…and also valid on the daily chart but you have to scroll over to see the whole triangle on the daily. I chose the monthly chart for this idea though because it’s the easiest one to see all the key valid touches on both the bottom and top trendlines of the triangle.That bottom trendline has been holding for 3 years now and is super strong support. We just had a flash crash on the daily dip down below it and threaten to trigger what looks like a h&s on the daily chart (not shown here) however that was quickly bought up and with very little volume to show is looking to be a classic fakeout breakdown/bear trap. Still a decent amount of hours left in todays daily candle but as long as that candle closes green it is a very good sign that this triangle will likely be breaking upwards. *not financial advice*

XRPUSD Weekly chart suggests a triangle breakout is nearingWe can see here how the bottom trendline of this brown symmetrical triangle has held support since early 2020 and will likely continue to do so. We can also see that we are on the verge of a weekly golden cross with the weekly 50ma (in orange) looking like it will cross above the weekly 200ma(in blue) shortly after the next bullish impulse in price action. Those MAs are currently serving as support for current price action and could easily maintain that support. If so then the place I arbitrarily put the dotted breakout measured move line is likely to be close to where the actual breakout occurs in which case the price target should be similar to what you see here. There is also a chance that we are given some sort of Black Friday or holiday discount, in which case price action dips below the weekly MAs momentarily….if so I personally think a retest of the bottom trendline of the brown triangle will be an optimal place for me to buy such a dip if I’m lucky enough for price action to retest it. If that were to happen the spot where the breakout eventually happens will have to be changed but it shouldn’t effect the price target too dramatically. Of course as always this is not financial advice and simply my strategy for my own holdings. Thanks for reading. Excited to see how this one pans out.

Monthly chart triangle XRP is reaching apex We can see this monthly triangle that xrp has been forming since 2020 is nearing an apex. We can also see that, barring some sort of black swan, XRP is fairly unlikely to stay above 40 cents based on the extremely solid support of the triangles bottom trendline and the fact that the monthly 100 ma is now overlapping that trendline for double reinforced support. The top trendline has the 3 touches needed to be a valid line so it is suggesting a measured move of over $2. Of course being a monthly chart pattern it would likely take may months to reach the full target. *not financial advice*

Legendary Golden Cross on XRP happening right at triangle apexThis chart screams bullishness. We are just a few weeks max from the apex of this symmetrical triangle on the xrpusd weekly chart and we are also about to have a weekly golden cross(where the orange line goes above the blue line) Doesn’t take a TA expert to see on this chart what tends to happen when this weekly Goldencross occurs on xrp. Obviously this isn’t financial advice but if I had to take a mildly educated guess of what the outcome with the highest probability of happening here is I’d simply say:UP!!!

Updated monthly chart of the XRPUSD Symmetrical TriangleWe just had a big correction in the crypto markets and like clockwork the bottom trendline of this symmetrical triangle held exact support on the bottom wick of the current monthly candle. Will be interesting to see if that holds ultimate support as often right before a pattern breaks up there is a big pullback in price action similar to an archer pulling back their bow before releasing the arrow and letting it fly forward. So it’s also quite common to see price dip below the bottom trendline of a pattern right before the breakout upwards. Meaning, there’s still an opportunity for a correction that dips below this triangle before the break upward which would be a nice opportunity to accumulate a little at a discount if it were to occur. Either way the current dump we have experienced gives me confidence that a breakout is right around the corner. On the linear chart the breakout target for the triangle is right around $2.36-$2.40. The logarithmic measured move has us eventually reaching a target of around $11.47 or so but that is likely to take a fairly longer amount of time to reach the target of. I posted another chart of this triangle logarithmic mode and will link that chart link down below. *not financial advice*

Posted a chart of the XRP triangle fractalWe can see xrpusd is doing something very very similar for the past few years its been forming this massive triangle pattern that it did before the last time it had its massive breakout from a triangle that eventually led to its all time high. On the weekly chart we can see we are now very very close to the apex of this triangle and I have also superimposed a small screenshot of the triangle it broke up from. Back then as it does seem to be repeating itself here. If you zoom in you can see just before it broke up from the previous triangle it painted a big red wick to the downside to fake a lot. Of traders out of their positions before finally skyrocketing up and out of the triangle. This increases the odds that the fractal of that triangle we are in now might also have a big capitulation wick that dips below the current triangle first before the breakout upwards. If we are lucky enough to get a repeat of this fakeout tactic I know I will personally be buying such a dip. Speaking only for myself of course *not financial advice*

XRPUSD Weekly triangle currently retesting as exact wick supportEven though we are still inside the triangles on the logarithmic chart, we have now been above this key linear chart symmetrical weekly triangle now for 2 consecutive weekly candle closes, and sure enough the big dump that coincided with the SEC’s appeal found wick support right on the top trendline of this triangle retesting it currently as support. It’s certainly plausible that price could continue to fall back inside the linear chart symmetrical triangle here, however closing the currentl weekly candle above ot’s top trendline here and maintaining it as precise wick support would be such a bullish sign were it. To happen that then I would start wondering if the entire appeal thing might actually not go through because maintaining this as support should validate the breakout and send price action on its way up to find that $3.73 cent measured move target. Of curse still very probably we could dip back inside this triangle one more time as well, either way I thought it’d be a good idea to repost this triangle and also include a screenshot of the current wick support zoomed in. *not financial advice8

The weekly linear symmetrical triangle truncatedI wanted to post thesame triangle I posted in the previous idea,but instead of starting the top trendline from the ath in 2018 starting it from the second highest wick.I think both are valid but wanted to give this one its own separate chart since in doing so it makes both the top trendline of the triangle and the bottom have a more similar length and also gives me a easy red ,ove line that is tilted forward which could be useful should the dotted measured ove line start to act as additional support or resistance along the way to the target. Once again as I said in the previous idea, no breakout has been confirmed of this in ear triangle pattern just yet, but the current weekly candle is holding wick support exactly on the top trendline currently which is an optimistic sign. Still completely possible it loses that support but for now it seems post worthy so I can keep a close eye on it. *not financial advice*

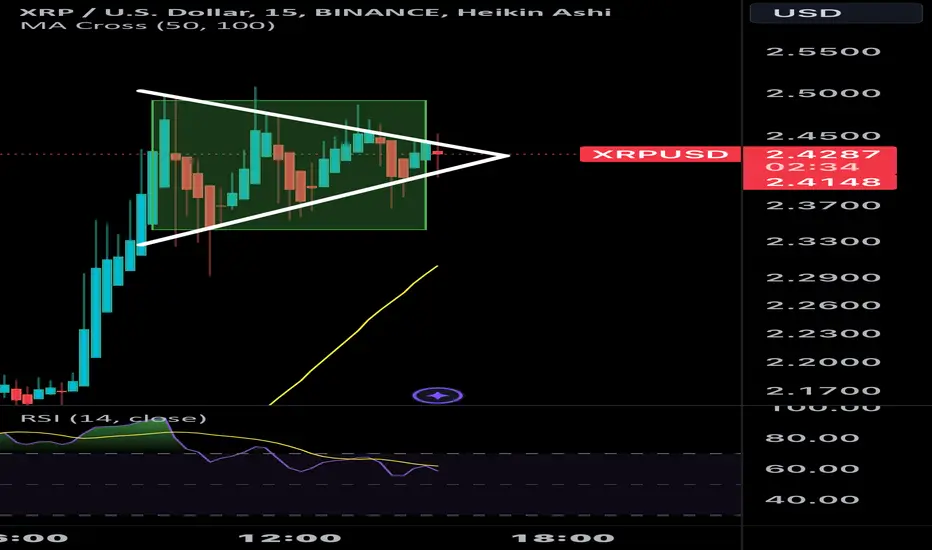
XRP Symmetrical Triangle ### XRP: Eyeing $2.49 Break
**Price Update:**
- **From $0.50 to $2.50**: Since October 31st, XRP has surged from $0.50 to challenge $2.50.
- **Recent Performance**: Up from $1.60 on November 23rd to now, a 56% increase in under 10 days.
**Upcoming Catalyst:**
- **Brad Garlinghouse on 60 Minutes**: Date TBD, could spotlight XRP.
**Technical Insight:**
- **Pattern**: Symmetrical triangle or pennant forming with HL and LH.
- **Breakout Potential**: Watch for a decisive close above $2.50 for bullish signals.
**Strategy:**
- **Long**: Break above $2.50? Enter with stop loss below.
- **Short**: If rejected at $2.50, consider shorting with stop loss above.
**Disclaimer:** Not investment advice. Do your own research.
XRP/USDT: The Path to $5 is Set!Hey everyone!
If you’re finding value in this analysis, don’t forget to hit that 👍 and follow for more updates!
Technical Analysis:
XRP is displaying strong bullish momentum, breaking out of a symmetrical triangle pattern on the weekly timeframe. This technical formation, coupled with increasing trading volume, suggests a potential for significant price appreciation.
Potential Targets:
Target 1: $1
Target 2: $2.4
Target 3: $3.7
Target 4: $4.8
Entry Range: $0.6 - $0.7
Stop-Loss: $0.38
Fundamental Analysis:
XRP, the native cryptocurrency of the XRP Ledger, is designed to facilitate fast, efficient, and cost-effective cross-border payments. With its growing adoption by financial institutions and its potential to revolutionize the global payments industry, XRP holds strong long-term prospects.
What are your thoughts on XRP's future? Do you see the potential for a significant price surge? Share your analysis and predictions in the comments below! Let's discuss!

TELCOIN 3 Ascending Triangles PatternTelcoin has been following a very distinct pattern with it's ascending triangles.
NOV TELCOIN TRIANGLES
NOV 12 - 9 Day Build, 48 Hour Pump, 55%
Nov 23 - 3 Day Build, 24 Hour Pump, 44%
Nov 28 - 2 Day Build, 12 hour Pump, 33%
It leads me to believe that
BASED ON THIS PATTERN
The next triangle "Breakout to peak" will be under 14 hours long and will be about 22% return.
Short term breakout target for Telcoin is $0.0092.

Liontrust Asset Management Plc | Chart & Forecast SummaryKey Indicators On Trade Set Up In General
1. Push Set Up
2. Range Set up
3. Break & Retest Set Up
Notes On Session
# Liontrust Asset Management Plc
- Double Formation
* Triangle Uptrend | ABCD | Subdivision 1
* 50% Retracement | Continuation At 7.130
- Triple Formation
* A+ Set Up | Short Bias At 8.580 | Subdivision 2
* Flag Structure | Forecast Template
* Retracement | Neckline At 4.420 Subdivision 3
Active Sessions On Relevant Range & Elemented Probabilities;
London(Upwards) - NYC(Downwards)
Conclusion | Trade Plan Execution & Risk Management On Demand;
Overall Consensus | Sell

Crypto Silver Ethereum importance The most important reason of this bullish wave is not Ethereum, maybe it's rised as normal as others but the main reason is BTC and gold
And the reason of Rising and the main Stuff was The presidency of an important country like us, can make a Big wave like this
Some flagship Coins like Xrp and Ada has their own news and fundamental.
So i think eth cant relate this Sharpy wave rise.
The dominance of Btc on market is dumping in my opinion and it will continue tol the Eth dominance rise to see a new alt season.
This valuable and volume of Eth is not really fair for This young Crypto Silver.i can bet one day you will forget about btc lol just kidding.
Btw we have 2 scenarios for monthly ranging triangle technically for:
If you don't expect any sudden news or war tensions or Powell Time Sharp moves, we can have rising scenario with slowly ranging in 1month timeframe
Instead if we have the Low and weak Eth we can expect Dumping and we can start to check the Eth after breaking triangle from Down part.
Btw i like to just wait to see what happens in 2 weeks for this young mom Coin(eth) haha
Good luck

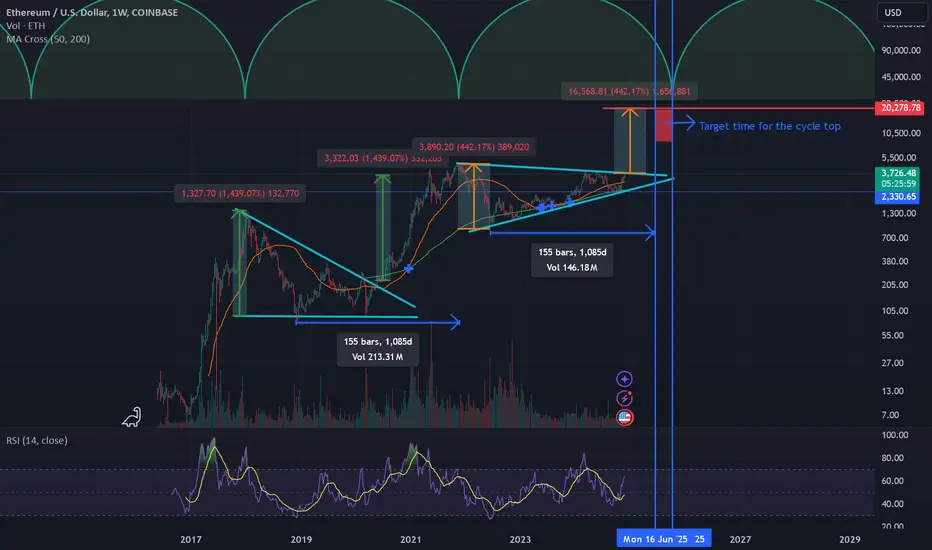
Ethereum potential move to 20,000Hi everyone,
Pattern: Ascending triangle is formed in weekly time frame for Ethereum (2022-2024). The triangle pattern was formed in the previous cycle (2018-2020).
Pattern breakout and target price: Once the price break out of the triangle pattern the target will be the triangle height, measured from break out point. This happened in the last cycle and the target price was reached. If happens in this cycle, we are looking at target price of 20K after the breakout.
Time analysis: If we are analyzing the time from cycle top to cycle top, we will be looking at end of Sep 2025 as the target time for the target price. If looking at cycle bottom to cycle bottom, the target will be mid June 2025. So, we can set our target time anywhere from June to Oct 2025 for this cycle top.
Let me know what you think! Cheers!