<69k = doom
My thought process included drawing two trend lines that I had originated from an originally inverted scale
>69k no doom but...
by the time this enclosing triangle gets smaller, we will have more clarity re. trump tariffs
or as his former trade rep said: something something "bulk of tariff actions still lie
ahead"
___
+
"Everyone needs to buckle up, because the President is just getting started and what lies ahead will likely be even more unpredictable than during his first term."
Triangle

GBP/AUD: Bulls Eye Breakout, But Momentum Signals CautionThursday’s bullish engulfing candle and rising risk aversion have GBP/AUD knocking on the door of a bullish breakout, with the pair testing resistance at 2.0627 in early Asian trade on Monday.
Stepping back, GBP/AUD remains within an ascending triangle pattern, bouncing off uptrend support on four separate occasions this month. While convention suggests traders should watch for a topside break, momentum indicators are less convincing—RSI (14) has been diverging from price in recent weeks, while MACD is easing lower despite staying in positive territory.
The conflicting price and momentum signals reinforce the need for a decisive break above 2.0627 before considering bullish setups. A confirmed break and close above the level could open the door for longs targeting 2.0859, the swing high from March 2020, with a stop beneath to protect against reversal.
A failure at 2.0627 could see the setup flipped, with shorts established beneath the level and a stop above for protection. The initial downside target would be uptrend support, currently around 2.0425.
Good luck!
DS

TRUMP Ready for PUMP or what ?Do you think this will happen, or do you see TRUMP below $9.5 in the future?
Give me some energy !!
✨We spend hours finding potential opportunities and writing useful ideas, we would be happy if you support us.
Best regards CobraVanguard.💚
_ _ _ _ __ _ _ _ _ _ _ _ _ _ _ _ _ _ _ _ _ _ _ _ _ _ _ _ _ _ _ _
✅Thank you, and for more ideas, hit ❤️Like❤️ and 🌟Follow🌟!
⚠️Things can change...
The markets are always changing and even with all these signals, the market changes tend to be strong and fast!!

GOLD → Tense fundamental environment and retest of 3025FX:XAUUSD is forming a correction within the descending channel. The situation is becoming complex and confusing. The focus is on the channel resistance and on the support at 3004.9. Further price movement depends on the fundamental data...
The problem is the uncertainty around the US tariff policy and the outcome of talks between Russia and the US on ceasefire in Ukraine.
The market is focused on US consumer confidence data and comments from Fed officials. The rise in the dollar, supported by Bostic's hawkish statements and strong PMIs, is pressuring gold, but the lack of clarity on tariffs and geopolitical tensions are limiting its further decline
Technically, the situation is simple in that it all depends on the resistance of the current channel. A break and consolidation above 3025 will trigger growth. A false break of the channel resistance will provoke a continuation of the decline both to 3004 and to 2980.
Resistance levels: 3024.6, 3038, 3056
Support levels: 3004.9, 2987, 2981
Based on the difficult fundamental environment, which is far from any positive decisions, the tensions in the Middle East, and the tariff war, I can conclude that gold will try to strengthen once again, as we have technical support: a strong bullish trend, a strong 3004 level, and a cascade of locally rising lows.
A failed breakdown will be false and in this case, a price consolidation under 3017 will trigger a fall to 3004.
Regards R. Linda!

TradeCityPro | TONUSDT From Pavel’s Release to Blockchain Events👋 Welcome to TradeCityPro Channel!
Let’s dive into the analysis of TON, one of the most efficient and widely used blockchain projects that is making significant waves in the space.
🌐 Overview Bitcoin
Before starting the analysis, I want to remind you that we have moved the Bitcoin analysis to a separate section based on your requests. This allows us to discuss Bitcoin’s status in more detail and analyze its charts and dominance separately.
This is the general analysis of Bitcoin dominance, which we promised you in the analysis to analyze separately and analyze it for you in longer time frames.
🚀 Pavel Durov’s Release!
Pavel Durov, Telegram’s founder, has returned to Dubai after months of restrictions in France. He was detained in August 2024 over content monitoring allegations but announced on March 17, 2025, that he has finally returned to his main residence and Telegram’s headquarters in Dubai.
Durov thanked his team and lawyers, emphasizing that Telegram had gone beyond its legal obligations. While investigations in France continue, this return could be a turning point for Telegram’s future.
At the same time, the TON blockchain is gaining attention with its NFT ecosystem, including projects like GetGems and TON Diamonds. From Telegram usernames as NFTs to event tickets, TON is building a fast, scalable, and practical ecosystem that’s making headlines.
🔍 Deep Research
In our previous analysis, we conducted an in-depth fundamental review of TON—covering team background, blockchain developments, and ecosystem growth. Since investing requires a full understanding of a project, make sure to check out the previous analysis if you haven’t already.
📊 Weekly Time Frame
TON is one of the strongest altcoins in the market right now. While most altcoins have reached or formed new lows, TON is still holding above major supports.
After forming its all-time high of $8.288, TON entered a distribution zone. Due to overall market corrections, it lost the $4.765 support, leading to a sharp drop that reached the $2.650 support an area we previously identified for entries.
This support level is crucial, as it represents nearly 50% of the chart’s structure. Additionally, the 0.786 Fibonacci level and previous long-term resistance reinforce its importance. As seen on the chart, after touching this level, TON bounced sharply.
There is no clear spot buying trigger at this time frame yet. However, if TON forms a higher low, the chart will turn fully bullish.
For exit strategies, I am currently utilizing my TON within its ecosystem (NFT trading, etc.), so I do not plan to sell unless the price drops below $1.914.
📉 Daily Time Frame
After getting rejected at $6.912, TON entered an ascending triangle pattern—which is typically a bearish continuation pattern. The chart continued forming lower highs and lower lows, indicating that selling pressure outweighed buying interest.
After breaking down from this triangle, TON experienced a sharp 50% drop from the breakout point. However, upon reaching the $2.512 support, the price suddenly pumped, partly influenced by Pavel Durov’s release and new TON blockchain developments.
Even without the fundamental catalysts, this support level was critical, and a bounce was likely. This move has now formed a V Pattern, which is bullish.
If TON breaks above $3.857, we could see further price increases, making this a potential buy opportunity. Confirmation signals include RSI entering overbought territory and increased volume.
⏳ 4H Time Frame
TON is on my watchlist for long positions due to its strong hype and ecosystem developments.
🟢 Long Position:
We are currently testing a major resistance at $4.076. If this level breaks, we can safely enter a long position. If a lower time frame trigger appears, it may be worth entering early.
🔴 Short Position:
I generally don’t recommend shorting TON, but if it breaks below $3.569, it could trigger a decent short trade. However, since TON is still ranging in the daily time frame and market volume is low at the end of the month, be cautious—unpredictable wicks are likely.
✍️ Final Thoughts
Stay level headed, trade with precision, and let’s capitalize on the market’s top opportunities!
This is our analysis, not financial advice always do your own research.
What do you think? Share your ideas below and pass this along to friends! ❤️

BITCOIN → Break of the bullish structure. Moving to 78-68KBINANCE:BTCUSD has been slowly recovering for the last two weeks, but failed to overcome the resistance. The bears held the trend. The price is breaking the local bullish structure and preparing for a strong fall.
Bitcoin's fundamental background is weak, expectations were not met by the crypto summits, nor by any major announcements or hints of a crypto reserve. The crypto community still didn't get what they expected from Trump. The strong drop was triggered by the SP500 index falling, driven by rising inflation, reduced consumer pressure and new trade tariffs. These factors have contributed to increased uncertainty in the markets, prompting investors to move to safer assets such as gold and government bonds
Technically, the price has been in consolidation (correction channel) for two weeks and after breaking the support of the figure, the price entered the realization phase within the global downtrend.
Resistance levels: 85300, 86350, 89400
Support levels: 83600, 81270, 79980, 78100
Emphasis on the support at 83600. The price fixing under this zone may provoke further fall to 80-78K. But I do not exclude the fact that a small correction to the zone of interest is possible (to capture liquidity) before a further fall to the previously identified key zones of interest.
Regards R. Linda!

HelenP. I Euro drops to $1.0650 points, breaking support levelHi folks today I'm prepared for you Euro analytics. After analyzing this chart, we can see that the price spent some time within a consolidation range. During this period, the price tested the lower support zone and made a strong reaction from this level, moving upwards. This move showed strong buying pressure as the price quickly reversed from the support zone, signaling that buyers were ready to push higher. The price then broke above the trend line, continuing to rise and establishing a bullish momentum. It reached the upper resistance zone before encountering resistance and starting to consolidate. This consolidation happened within a narrow range, confirming that the market was unsure about the next move but still held above the important support 1. Now, the price is trading near the trend line and is testing the support zone. A reaction from this support will be crucial for determining the next move. Given the current price action, I expect a potential continuation of the move towards my goal at 1.0650, where the price may encounter further support and the previous price action. If you like my analytics you may support me with your like/comment ❤️

LAYERUSDT → Far retest of key resistance at 1.400BINANCE:LAYERUSDT.P is forming a realization within the uptrend. The coin is stronger than the market, but the initial reaction to the strong resistance at 1.400 may be in the form of a false breakout and a pullback to 1.275 or 0.5 fibo
Since the opening of the session, LAYERUSDT has passed the daily ATR, but after reaching the resistance, the coin may not have the potential to continue rising. Liquidity above the 1.400 level may hold this area and prevent the coin from breaking through this zone the first time around.
Bitcoin is testing trend resistance at this time and could likely form a rebound or a continuation of the decline, which could affect altcoins accordingly!
Resistance levels: 1.400
Support levels: 1.2932, 1.2747, 0.5 fibo
BUT ! Everything depends on the price reaction at 1.400. A sharp and distributive approach with 90% probability will end in a false breakout and correction to the mentioned targets.
But, if LAYER starts to slow down and consolidate in front of the level, an attempt of breakout and struggle above 1.400 is possible and further movement will depend on it.
Regards R. Linda!

BITCOIN...Minor breakdownIts given a triangle breakdown..so sell call ..till stoploss OR tgt..Note that the price is broken down into a new zone ..and Risk reward ratios is very very good...The time and price tgt is calculated and shown on chart accordingly...Disclaimer..please

GOLD → Consolidation forms a trigger. Rally?FX:XAUUSD continues to rise amid weakening dollar demand due to Trump's imposition of new tariffs. GDP and Initial Jobless Claims ahead
Gold is further supported by renewed concerns about a slowdown in the US economy due to trade duties. However, growth beyond ATH remains questionable due to geopolitical nuances.
The market focus shifts to macroeconomic data: the final US GDP for the fourth quarter and jobless claims will be released today. Also the attention will be drawn to the speeches of the Fed representatives, who earlier made it clear that they are in no hurry to cut rates due to inflation risks caused by Trump's tariff policy
Resistance levels: 3038, 3046, 3056
Support levels: 3033, 3025
The strong resistance is 3038. Breakdown and price consolidation above this level will provoke continuation of growth (there is a chance of ATH retest). But, since there is news ahead, gold may test the zone of interest and liquidity 3030-3025 before further growth.
Regards R. Linda!

GBPJPY Long IdeaIn the daily graphs we can observe the price moving between the two daily trend lines which creates triangle.
As the increasing trendline is strong for now, we are most likely to seek the Long position in this pair.
At the best scenario we will look for the price close daily above the previous major high of 194.900, if yes after a little retest we can come up to at leass to the decreasing trendline to 197.000 levels. So after breaking above and reaching to that point we can see a pull back to the previous resistance level to be turned into new support and after buy confirmation we can look for another highs which were previous daily resistance zones 198.800 and 199.800.
On the other scenarios as shown on the chart we can either make the decreasing trendline a strong resistance zone and come back to the previous strong daily resistance zones of 189.200.
Let's see and observe what opportunities the market will give us.
Good Luck!

GOLD (XAUUSD): New ATH Soon?!
I see a bullish accumulation pattern - the ascending triangle formation
on Gold on a daily.
In a strong uptrend, such a pattern usually indicates a highly probable
bullish continuation.
The main focus now is on the underlined blue resistance based on a current ATH.
Its breakout and a daily candle close will open a potential for much more growth.
Next resistance will be 3100.
❤️Please, support my work with like, thank you!❤️
I am part of Trade Nation's Influencer program and receive a monthly fee for using their TradingView charts in my analysis.

GOLD → Price returns to the channel to form a bullish structureFX:XAUUSD is completing a correction, breaking channel resistance and consolidating above the downtrend line. Traders are waiting for economic data and tariff war actions
Trump confirmed plans to impose retaliatory tariffs on April 2, limiting exemptions. The new duties have raised fears for the U.S. economy, which has weakened the dollar and boosted demand for gold.Markets are also keeping an eye on talks between the U.S., Ukraine and Russia.Focus is also on US durable goods orders data - a strong reading could cool expectations of a Fed rate cut, limiting gold's gains
Resistance levels: 3033, 3045, 3056
Support levels: 3013, 3004
Gold may test the support zone before rising further. The focus is on the current consolidation 3033 - 3013. A key resistance is formed ahead, a breakdown of this zone may provoke a continuation of growth to 3045 - 3056.
Regards R. Linda!

IPUSDT → Exit from the triangle may trigger a distribution ofBINANCE:IPUSDT.P is forming positive preconditions for possible growth. Bitcoin slightly revitalized the market after positive news related to SEC and XRP (the crypto community did not miss this fact)
The IP coin was in consolidation for a long time - a symmetrical triangle. Rising lows, consolidation, breakout of triangle resistance give positive signs of readiness for distribution (realization of consolidation). Ahead is the key resistance at 5.6297 separating the market from the free zone
Resistance levels: 5.6297, 6.631
Support levels: 5.116, 4.783
Price has been sticking to triangle resistance for the past few days and is gaining potential for breakout and realization. Numerous intraday retests of the area indicate the market's interest to break beyond this zone. A breakout of 5.6297 and price consolidation above the triangle will be a good signal of readiness to go up.
Regards R. Linda!

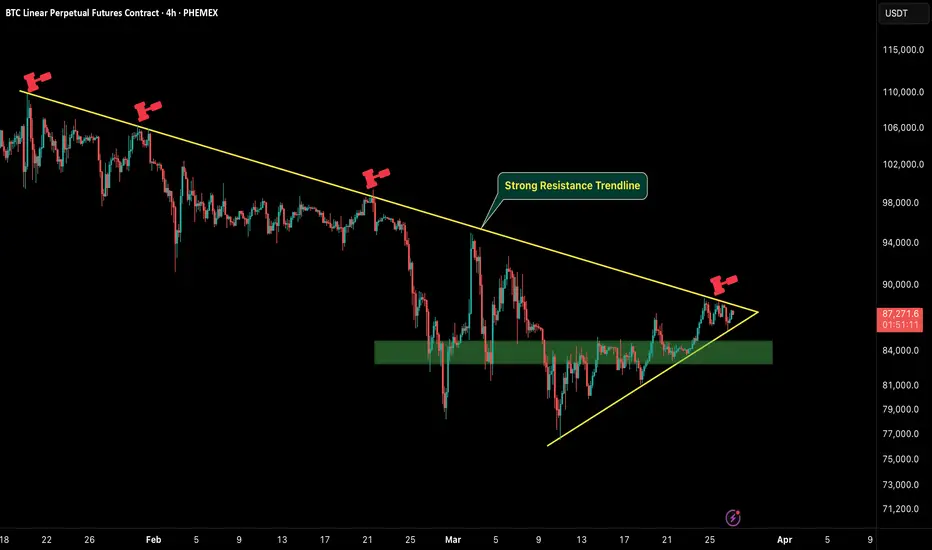
BTC QUICK UPDATE!!🚀 Hey Traders! 👋
If you’re finding value in this analysis, smash that 👍 and hit Follow for high-accuracy trade setups that actually deliver! 💹🔥
🔥 BTC/USDT – Symmetrical Triangle in Play! 🔥
BTC is currently forming a symmetrical triangle on the 4hr time frame, facing strong resistance at the upper trendline. For a bullish breakout, BTC needs to close above the $88.3k resistance level.
📉 Bearish Scenario:
If BTC rejects from this resistance and breaks down from the triangle, we could see a short-term decline in price.
💡 Bullish Outlook:
The more BTC tests the upper trendline, the weaker the resistance becomes, increasing the chances of a breakout. However, it’s best to wait for confirmation before turning fully bullish.
🔹 Key Levels to Watch:
✅ Resistance: $88.3k
✅ Support: $85k – $86k
💬 What’s Your Take?
Do you think BTC will break out or get rejected? Share your analysis, predictions, and strategies in the comments! Let’s ride this market together! 💰🔥🚀
BKY Berkeley Energia ASXWeekly chart of BKY
Currently breaking out of weekly triangle within a larger triangle pattern
Will likely get to $0.57c relatively quickly which is the larger triangle trend line
Given the hovering around current levels I'm almost thinking that is accumulation which may push this through multi year resistances and breakout for a strong move higher
Full disclosure this is a long term position I have had for a while now...

EURCAD - Descending TriangleHello Traders !
On Tuesday 11 March, The EURCAD reached a strong resistance level (1.61530 - 1.57962).
The price formed a descending triangle pattern.
Currently, The support level is broken !
So, I expect a bearish move📉
____________
TARGET: 1.52350🎯

Gold at H1 Ascending Triangle. May touch ATH SoonWell, an ascending triangle pattern is visible, suggesting potential bullish continuation. Let's see how it plays with price.
Breakout and retest are essential, though!
Kindly boost the idea.

XAUUSD – Bullish Breakout from Triangle | 3,090+ in SightGold (XAUUSD) has broken out of a symmetrical triangle consolidation on the 1H chart, signaling bullish continuation. With solid technical structure and momentum building, the path toward 3,093+ remains firmly in play.
📊 Technical Breakdown
1. Symmetrical Triangle Formation
Price coiled within a classic symmetrical triangle, forming higher lows and lower highs—typically a continuation pattern in trending markets.
A breakout has now occurred to the upside, confirming bullish bias.
2. Breakout Projection
The measured move from the triangle projects a 2.62% upside, targeting the 3,093 zone.
3. Clean Market Structure
Bullish impulse followed by healthy consolidation reflects market strength.
Expectation: Price will print higher highs and higher lows on its way to upper targets.
🎯 Bullish Targets
TP1: 3,047.652
TP2: 3,058.038
TP3: 3,093.957
These levels are based on recent structure highs and the measured move from the breakout.
📌 Trade Plan
Entry Idea: On triangle breakout retest or momentum continuation above 3,025
Stop Loss: Below triangle support (~3,000)
Risk-to-Reward: Favorable on breakout continuation setups
🔎 Confluences
✅ Symmetrical Triangle Breakout
✅ Strong Bullish Trend
✅ Measured Move & Clear Targets
✅ Consistent Market Structure
Gold bulls are stepping in with strength. As long as price holds above the breakout zone, expect further upside toward 3,090+.
Want a version with SL-to-BE logic or trailing TP adjustments? Just let me know!

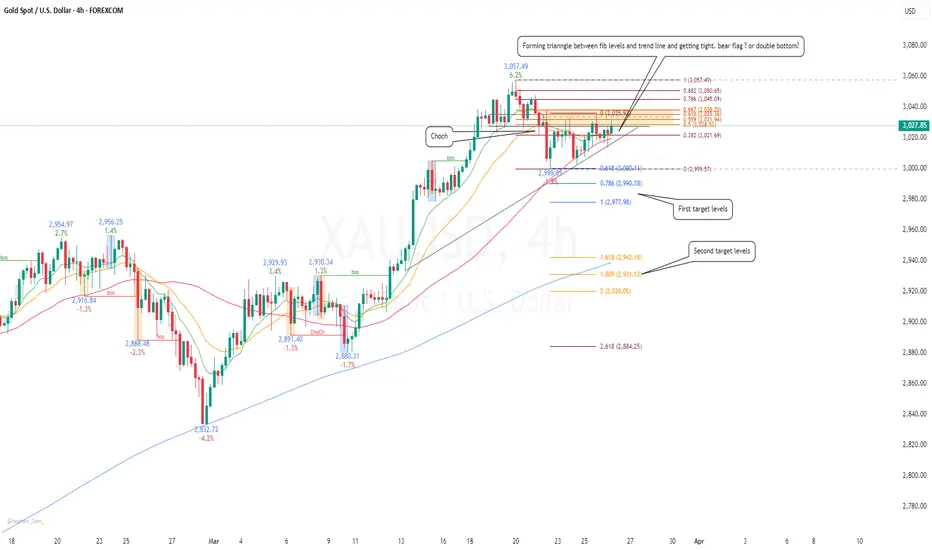
Gold AnalysisGold analysis 4H timeframe.
The analysis based on fibo levels, trend line, market structure, and price action.
if it breaks out up, it will go up to 3050, if it breaks out down, it will go to fibo extension level.
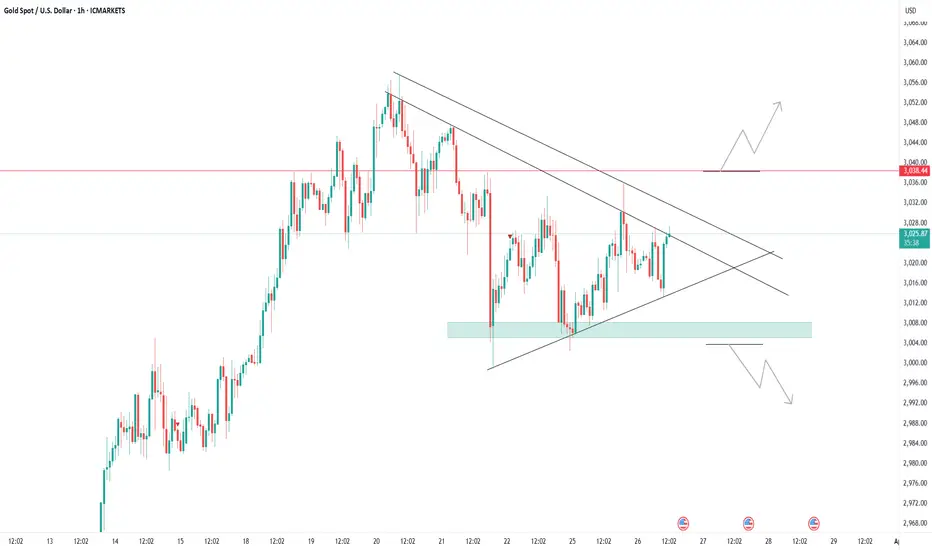
Gold is in Triangle, may give breakout in either sideGold is in the Triangle, which may give a breakout on either side.
The trend is still bullish.
Breakout of this triangle will decide the Gold Trend either Bullish or Bearish.
ZEC/USDT: Breakout in Play – 100%+ Upside Move Incoming?🚀 Hey Traders! ZCASH Breakout Alert – 100%+ Move Loading? 👀🔥
If you’re pumped for this setup, smash that 👍 and hit Follow for premium trade ideas that actually deliver! 💹🔥
🔥 ZEC/USDT – Massive Breakout in Play! 🚀
ZEC is breaking out from a symmetrical triangle on the 6H timeframe and has successfully retested it, confirming the breakout. 💥
With this solid retest, ZEC looks poised for a 100%+ upside move.
Long some here with low leverage and add more on dips to ride the wave higher. 🚀
💰 Trade Setup:
📍 Entry: CMP and add more up to $35
🎯 Targets: $41 / $52 / $63 / $72 📈
🛑 Stop-Loss: $32.80
⚡ Leverage: Use low lev (Max 5x)
🔎 Strategy:
✅ Enter with low leverage now
✅ Add more on dips and ride the breakout momentum 🚀
💬 What’s Your Take?
Are you bullish on ZEC’s breakout potential? Share your targets, analysis, and predictions in the comments! Let’s crush it and secure those gains together! 💰🔥🚀

PEB Pacific Edge - Looking to moveI'm already in this,
but structure is interesting as it looks like a strong move is coming shortly
Triangle breakout and retest complete...
Watch this space!

AUDUSD triangle pattern suggests a big move is comingAUDUSD has been consolidating in a triangle pattern, suggesting a breakout is near—likely within weeks. A bullish breakout could target 0.6393, with potential for a 229-pip move. A bearish break is also possible but less clear. The setup offers strong risk-reward, with examples showing a 5.6x ratio.
This content is not directed to residents of the EU or UK. Any opinions, news, research, analyses, prices or other information contained on this website is provided as general market commentary and does not constitute investment advice. ThinkMarkets will not accept liability for any loss or damage including, without limitation, to any loss of profit which may arise directly or indirectly from use of or reliance on such information
