UNI/USDT 1DAY UPDATE BY CRYPTOSANDERSWelcome to this quick
UNI/USDT analysis update
I have tried my best to bring the best possible outcome in this chart.
Reason of trade:-UNI/USDT is triangle pattern create and buy the dip green zone and long term hold
Entry:- CMP And buy the dip in the green zone
Target:- 350%
Stop loss:- $4.27
Remember:-This is not a piece of financial advice. All investment made by me is under my own risk and I am held responsible for my own profit and losses. So, do your own research before investing in this trade.
Happy trading.
Sorry for my English it is not my native language.
Do hit the like button if you like it and share your charts in the comments section.
Thank you...
Uniformity


Long Transports Idea15/Jan/2020 06:16 PM AUTHOR: Brandon Gum
--
XTN broke out on the 13th on the weekly timeframe.
Idea is to get long XPO here. Daily chart is a lil choppy which i why I stepped up the weekly timeframe.
Stop below 75
======================

Watch EEM for a risk on move globally3/May/2019 09:18 PM
--
If global markets are going to continue rallying, EEM will likely push to the past highs. With IWM breaking out I would think to look to EEM as well and see how it is holding up.
--
I wouldn't be surprised if EEM is just made up of Chinese internet companies though.

SPX RSI Rejection per uniformity methodArea to take some risk off.
Consider some 10yr US treasuries.

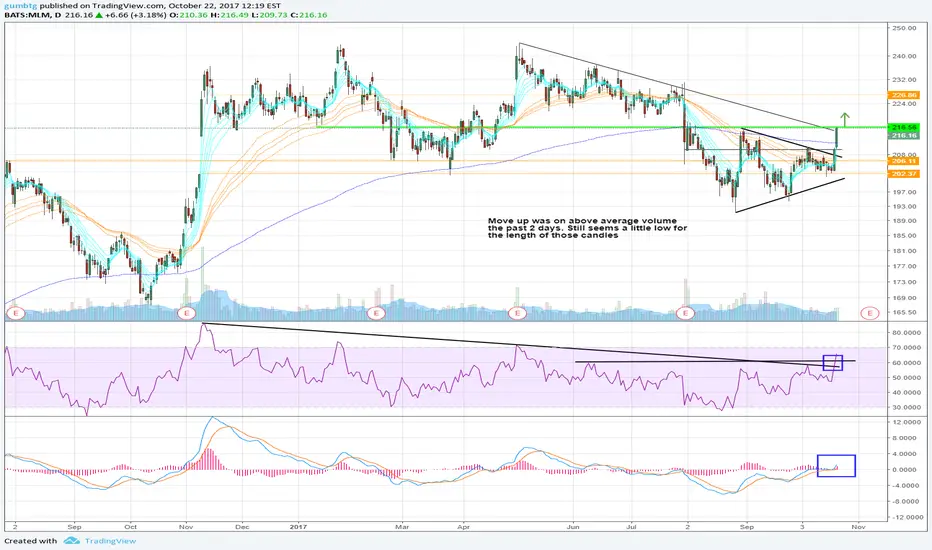
Trade Idea --- 8/10 Weekly and Daily breakout ---This is looking like a high probability trade setup. As long as there is no sudden rejection this week I think this one is in the clear to move higher. We may see a few days of consolidation, accompanied by candles with "scary" wicks, following the large price movement that we have seen thus far.
RSI breakout on the daily.
MACD zero line cross on the daily
On above avg volume(but see the note on the chart)
GMMA traders(Blue MAs) are compressed showing a move may occur soon(up or down; betting on up)
-------------
RSI breakout on the weekly
GMMA traders and investor(orange) groups are converging. As the MAs compress the likely hood of an explosive move is high.
S&P IQ has a 5 star rating on them with a PT of $240. Additionally they are currently trading 16% below fair value according to their analysis. They have seen good growth(% wise for a midcap) in recent quarters, which can later be a good driver when the market is ready.
RSI case study - Multi time frame analysisOther time frames listed below
--
2 hour needs to be bounce here
If it doesnt daily time frame RSI will break down
--
Before this we were focused on the 1Hr 50 level, and then the 40 level after the first test of the 50 during this massive up leg
--
General note: All higher timeframes are bullish. Stars are aligned but rejection could take place. THus why were are evaluating the strength readings on multiple timeframes.


XLE monthly Breakout - Energy SectorEnergy has been lagging the oil recovery significantly. Looking at the RSI of XLE on the monthly chart suggests that this could be the month that XLE finally makes a sustained move higher. The month has yet to CLOSE above our RSI level, but its a starting point.

RSI pivot level play - OIL SERVICES $OIHOil Services has been lagging the energy recovery.
This could be the start to another move higher. Recently OIH has had massive under-performance relative to oil.
Breakout out or get out. Maintain the RR. The under performance has be significant thus far.

Weekly flat top break with micro wedge - Considering Teir 1 hereChart interest me too much not to publish an idea on this. Not taking action right this second
RSI and MACD likely test their supports here. If we bounce it is definitely a buy. I will take a teir 1 position at the least there.
RSI is in the right zone for a move higher here it seems.

Going to be an absolute ripperRIP to the shorts.
In all seriousness thou financials look strong here. I think this is moving higher.
RSI uniformity breakouts are some of the best signals in the business. I think this one is good to go.

Standard Breakout playLooking for more volume to come in here to confirm.
Minimum target here only provides a 1 to 1 RR. May be better options out there

Next leg up - Semi moving higherBoth Mu and AMAT seem to be trying to move higher right now. MU has started its run slightly before AMAT.
AMAT trades at fair valuations. EV/EBITDA is at 12.85. PEG ratio is at 0.7. With great growth I feel as thou I am not paying too much at these prices.
We could have a retest of fake out here. I plan to take a position. I should of already taken a pier 1 position, but as usual I become trigger shy after a string of losing trades.

Long trade IdeaLooking for break above RSI uniformity line on high volume. The pull back to this level presents a decent RR oppurtunity

Bullish on EnergySearch #OOTT on twitter for more insight.
----
No comments I wish to write down. Read the chart.
----
Like
Comment
Follow for more

Energy Services Breakout - Actionable -After months of lagging XLE, and the overall market, OIH is stepping up to the plate.
Underlying holdings like HAL and SLB making moves.
Like
Comment
Follow for more


NVDA - No position - Watch closely**No position yet**
--
Entry Requirements(One of the following must occur):
1.) Price Action resistance break along with high volume.
2.) Teir 1 position on RSI uniformity line break #1 (the light green)
3.) Full Teir 2 position on RSI uniformity line break #2 (solid green line)
--


Swing Idea - Semiconductor PlaySee chart for details.
No macro based comments on this one.
Compare to SMH for relative strength measure.
Like
Comment
Follow for more

$AMD Trade Idea --- Weekly RSI breakout ---Top side resistance breakout on the weekly RSI. Look for a breakout of the green line for a sure entry point.
Volume should confirm moves.
Trade at your own risk. Have a trading plan with a predetermined stop loss

Trade IdeaBuying today reminds me of MLM a few weeks ago. Interested to see how this plays out. WIll likely retest breakout point if I had to guess
