NASDAQ THOUGHTS 15-AUG-2024Kindly see my NASDAQ thoughts for today. These videos are aimed at making you compare charts with mine if you are a price acton trader and use my thoughts to improve your skill. They are not meant as signals even if they seem like they are. I want you to learn and be great
Us100

DowJones - 4H Bearish SetupBLACKBULL:US30 has been exhibiting signs of bearish pressure, despite recent upward movements. The chart shows a significant decline below the ascending trendline. The recent upward movement appears to be a pullback, potentially setting up for further declines. Two key resistance zones have been identified on the chart, where the index may face renewed selling pressure.
Fundamentally, the broader economic environment is contributing to the bearish outlook. The possibility of a recession looms large as the Federal Reserve has postponed rate cuts in response to persistently high inflation. Rising unemployment claims are another concern, signaling potential economic weakness. These factors are creating an environment where risk assets like the Dow Jones are likely to struggle, and any rallies may be short-lived.
The current pullback in the TVC:DJI could provide a better entry point for those looking to short the index. The key resistance levels identified on the chart could serve as optimal zones for initiating new short positions, with the expectation that the index will continue its downward trajectory.
Given the macroeconomic uncertainties and technical setup, traders should remain cautious and consider the potential for further declines in the Dow Jones Industrial Average. This cautious stance is supported by both the chart analysis and the broader economic fundamentals.

US100 18.992.0 +2.52% MID-WEEK MULTI TF ANALYSISHELLO TRADERS
Hope everyone is doing great
📌 A look at NAS 100 & S&P500 from HTF - MULTI TIME-FRAME ANALYSIS
NAS100 DAILY TF
* We started the week on some BULLISH runs into a bearish BB.
* Entering the premium zone looking for rejection of this -BB.
* NAS100 currently taking LQ, looking for that internal range LQ to be taken(+OB).
* We are entering discount price looking for a bullish continuation long term on Nasdaq but intraday some shorts could be profitable.
* With PO3 looking for THURSDAY TO REVERSE for th week.
NAS 100 4H TF
* The week to opened Bullish into the 4h FVG + OB because our HTF BIAS (PO3) on D & W looking for possible reversals before we continue higher.
* looking for short positions OPPORTUNITIES.
* We will see what does the market dish.
* On the 4 hourly ERL > IRL.
S&P500 4H TF
* sentiment stays the same we still bullish, running into higher tf pd arrays.
US100 1H TF
* STRONG rally with the bulls, strong momentum to the upside.
* The is a 1H FVG, this is where i would look for short entries this week.
* Should this PD ARRAY hold will be short for the NASDAQ
* BASED on the price action served this week. But we might just reverse some where might as well be in these FVG prices
S&P 500 1H TF
* sentiment stays the same we still bullish, running into higher tf pd arrays
HOPE YOU ENJOYED THIS OUT LOOK, SHARE YOUR PLAN BELOW,🚀 & LETS TAKE SOME WINS THIS WEEK.
SEE YOU ON THE CHARTS.
IF THIS IDEA ASSISTS IN ANY WAY OR IF YOU ENJOYED THIS ONE
SMASH THAT 🚀 & LEAVE A COMMENT.
ALWAYS APPRECIATED
____________________________________________________________________________________________________________________
* Kindly follow your entry rules on entries & stops. |* Some of The idea's may be predictive yet are not financial advice or signals. | *Trading plans can change at anytime reactive to the market. | * Many stars must align with the plan before executing the trade, kindly follow your rules & RISK MANAGEMENT.
_____________________________________________________________________________________________________________________
| * ENTRY & SL -KINDLY FOLLOW YOUR RULES | * RISK-MANAGEMENT | *PERIOD - I TAKE MY TRADES ON A INTRA DAY SESSIONS BASIS THIS IS NOT FINACIAL ADVICE TO EXCECUTE ❤
LOVELY TRADING WEEK TO YOU!

Nasdaq Thoughts 12-Aug-2024Good morning all, Kindly find my Nasdaq market analysis for today below. As a price action trader, I encourage you to compare my charts with yours and use my insights to enhance your skills. These videos are designed for educational purposes only, not as trading signals. My goal is to help you grow and become a proficient trader.

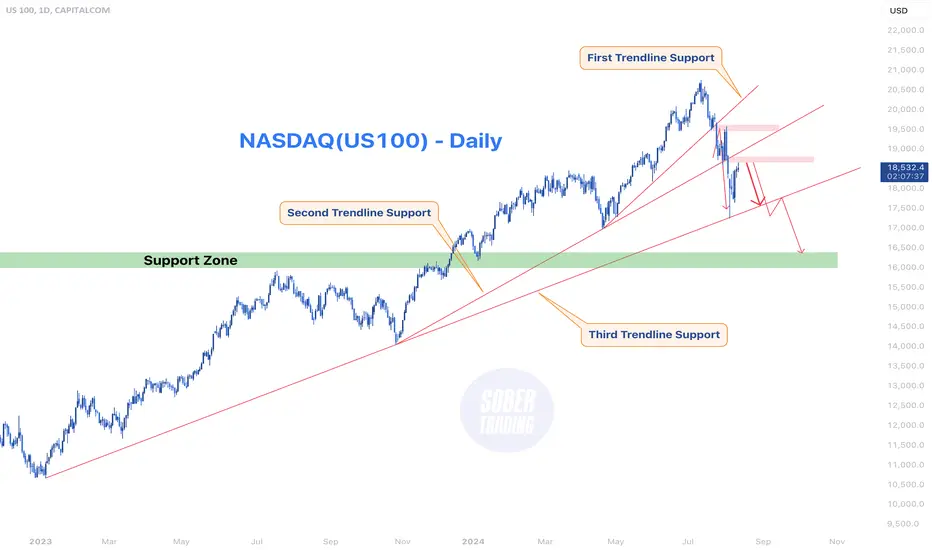
NASDAQ - US100 Facing Bearish PressureThe CAPITALCOM:US100 index is currently facing significant downward pressure, largely due to mounting concerns about the U.S. economy. The potential for a recession is growing as recent data points to an increase in unemployment claims, and the Federal Reserve has decided to delay interest rate cuts. This has created uncertainty in the markets, as higher unemployment could lead to reduced consumer spending, further exacerbating the economic slowdown. The anticipation of prolonged higher interest rates is also weighing on investor sentiment, making the stock market, particularly tech-heavy indexes like NASDAQ, more vulnerable to declines.
Technically, the BLACKBULL:NAS100 index has been following a clear pattern of reactions to its trendlines. The index recently fell and touched the third trendline support, which has historically been a critical level for determining market direction. After this touch, the index attempted a recovery, moving back towards the second trendline, which now acts as a breakeven point. However, the failure to break through this level and the subsequent rejection suggests that the bears are firmly in control. The pattern indicates that the index may face further declines, particularly if it breaches the third trendline support.
In conclusion, both fundamental and technical factors are pointing towards a bearish outlook for the NASDAQ index. The rising possibility of a recession, driven by increasing unemployment claims and the Fed’s cautious approach to rate cuts, has dampened investor sentiment. On the technical side, the index’s inability to reclaim key trendline supports indicates that more downside is likely. As a result, investors should be cautious and prepared for potential further declines in the NASDAQ index in the coming weeks.
US100 SellsUS100 seems to be printing a massive bearish pennant, I would like to see price drop from this area with targets as los as 17500. Last month we saw price retreat from ath, now it is looking to continue down.

Dow Jones Index (US30): Detailed Support and Resistance Analysis
Here is my latest structure analysis
and important key support and resistance levels to pay close attention to.
Vertical Structures
Vertical Resistance 1: Rising trend line
Horizontal Structures
Support 1: 38250 - 38550 area
Support 2: 38015 - 38105 area
Resistance 1: 39500 - 39700 area
Resistance 2: 39800 - 39960 area
Resistance 3: 40900 - 41415 area
Consider these structures for pullback/breakout trading.
❤️Please, support my work with like, thank you!❤️

NASDAQ New Bullish Leg targeting 20900.Early last week (August 05) we mentioned the importance of Nasdaq (US100) to close its 1W candle above the 1W MA50 (blue trend-line), after touching it for the first time is 17 months:
Eventually it succeeded at it and that caused a strong weekly reversal that even closed the 1W candle in green, which was the first after three straight red weeks. Technically, this could translate into the stop of the Channel Up correction, but this is only confirmed after a break above and successful re-test of the 1D MA50 (blue trend-line).
During the previous two Bullish Legs that followed a Channel Up Higher Low, the index made initially a +20.88% rise and then on a more long-term horizon, extended to +48.00%.
As a result, even though we are long-term bullish on the index, you can go after even shorter term targets, with the immediate one being 20900 (+20.88% from last week's Low).
-------------------------------------------------------------------------------
** Please LIKE 👍, FOLLOW ✅, SHARE 🙌 and COMMENT ✍ if you enjoy this idea! Also share your ideas and charts in the comments section below! This is best way to keep it relevant, support us, keep the content here free and allow the idea to reach as many people as possible. **
-------------------------------------------------------------------------------
💸💸💸💸💸💸
👇 👇 👇 👇 👇 👇

Nasdaq Thoughts 12-Aug-2024Happy New week everyone. Kindly find my trading zones for trading opportunities on Nasdaq today, I hope this gives you some position opening insights for today. Remember these are not signals and you use them at your own risk.

US100... SHORT After the price reaches the specified level,
Enter the SHORT deal with the Hammer candle or Ingulf candle signal
Consider your risk management before entering a trade.
This analysis is for informational purposes only and does not constitute investment advice.
All consequences of using this signal are at your own risk.

Dow Jones Index (#US30): Your Trading Plan Explained
Dow Jones is currently stuck on a key daily/intraday horizontal resistance.
The price is trading within a narrow range on that on a 4H time frame.
Your confirmation to sell the Index will be a bearish breakout of the support of the range.
A 4H candle close below 39325 will confirm the violation.
A bearish continuation will be expected to 38890 then.
Alternatively, a bullish breakout of the underlined blue resistance
will push the market higher.
❤️Please, support my work with like, thank you!❤️

US100 Outlook ICT ConceptsNASDAQ-100 (US100) Analysis
💰 Welcome to Your Channel!
Welcome to our channel where we delve into the intricacies of financial markets. Today, we focus on US100, dissecting its current price action to uncover strategic trading opportunities. Join us as we analyze key levels and market dynamics, aiming to refine our trading strategies and maximize potential gains.
💡 Previous Analysis Review:
In the previous analysis, we anticipated the price to begin expanding higher after a significant move to the downside, which has occurred as expected.
📍 Current Market Overview:
• Price Reaction: The NASDAQ-100 (US100) had a strong bullish reaction after sweeping the Sell-Side Liquidity (SSL) and tapping into the Daily Fair Value Gap (FVG).
• Expansion Higher: Currently, the price is expanding higher, moving into a premium zone as marked by the Fibonacci retracement levels.
🔍 Identifying Key Levels:
• PMH: Previous Month High
• PWH: Previous Week High
• PML: Previous Month Low
• SSL: Sell-Side Liquidity
• Buy-Side Liquidity (BSL): The levels that can be targeted if we go long.
• Daily FVG: The Daily Fair Value Gap, where the price had a significant reaction.
• 4H Bearish FVG: A 4-hour timeframe Fair Value Gap located above the current price.
• Fibonacci Retracement Levels: Key Fibonacci levels (0.50, 0.62, 0.705, 0.79) indicating potential resistance or retracement areas in the current premium zone.
📊 Key Considerations:
• Premium Zone: The price is currently in a premium zone, as identified by the Fibonacci retracement levels. This zone is generally where we anticipate some form of retracement or consolidation.
• Daily and 4H Bearish FVG: These gaps are significant resistance levels above the current price, which might act as targets if the price continues to move higher.
• Possible Retracement: Given that we are in a premium zone, a retracement lower is possible. However, further upside cannot be ruled out, especially if the price breaks through to the daily or 4H bearish FVG.
📈 Bullish Scenario:
• Sweep of Lower Time Frame SSL: For any new long positions, we need to see a sweep of lower time frame Sell-Side Liquidity (SSL). After this, longs can be considered, targeting the Buy-Side Liquidity (BSL) levels.
• Targets: The primary targets would be the Daily Bearish FVG and the 4H Bearish FVG above.
📉 Bearish Scenario:
• Retracement from Premium Zone: Given the current position in a premium zone, we could see a retracement lower. If this occurs, the key levels to watch would be the SSL areas or any previous supports near the Daily FVG.
📊 Chart Analysis Summary:
• Bullish Expectation: We have seen the long scenario play out successfully. For new longs, wait for a sweep of lower time frame SSL before targeting BSL, with potential targets being the Daily and 4H Bearish FVGs above.
• Bearish Expectation: Consider the possibility of a retracement from the premium zone. If the price shows signs of weakness, a move lower to previous supports or SSL levels could be expected.
Conclusion:
The NASDAQ-100 is currently at a critical junction in the premium zone, with the possibility of either further expansion to the upside or a retracement lower. The key to the next move lies in observing the price action around the Fibonacci retracement levels and the reaction to the bearish FVGs above. Any long positions should be taken cautiously after a lower time frame SSL sweep, targeting BSL levels, while keeping an eye on potential retracement scenarios.
🙏 Thank you for joining us!
Exploring US100 today highlighted the importance of effective risk management in trading success. Prioritize research, implement robust strategies, and seek guidance for confident market navigation. Stay tuned for more insights on our channel. Here's to profitable trading and continuous learning!
⚠️ Disclaimer
The information provided here is for educational purposes only and should not be taken as financial advice. Always conduct your own research and consult a licensed financial advisor before making any investment decisions.

Nasdaq Thoughts 09-Aug-2024Please find my NASDAQ market analysis for today below. As a price action trader, I encourage you to compare my charts with yours and use my insights to enhance your skills. These videos are designed for educational purposes only, not as trading signals. My goal is to help you grow and become a proficient trader.

Heading into 61.8% Fibonacci resistance?US100 is rising towards the resistance level which is a pullback resistance that aligns with the 61.8% Fibonacci retracement and could reverse from this level to our take profit.
Entry: 18,747.67
Why we like it:
There is a pullback resistance level which aligns with the 61.8% Fibonacci retracement.
Stop loss: 19,237.14
Why we like it:
There is a pullback resistance level which lines up with the 88% Fibonacci retracement.
Take profit: 17,758.38
Why we like it:
There is a pullback support level.
Please be advised that the information presented on TradingView is provided to Vantage (‘Vantage Global Limited’, ‘we’) by a third-party provider (‘Everest Fortune Group’). Please be reminded that you are solely responsible for the trading decisions on your account. There is a very high degree of risk involved in trading. Any information and/or content is intended entirely for research, educational and informational purposes only and does not constitute investment or consultation advice or investment strategy. The information is not tailored to the investment needs of any specific person and therefore does not involve a consideration of any of the investment objectives, financial situation or needs of any viewer that may receive it. Kindly also note that past performance is not a reliable indicator of future results. Actual results may differ materially from those anticipated in forward-looking or past performance statements. We assume no liability as to the accuracy or completeness of any of the information and/or content provided herein and the Company cannot be held responsible for any omission, mistake nor for any loss or damage including without limitation to any loss of profit which may arise from reliance on any information supplied by Everest Fortune Group.

NASDAQ / US100 TodayNASDAQ / US100 Today for me looks like ready to short.
It is good opportunity profit new Lower Low Today.
It's just my view but I took sell order

US30 - 4H DowJones is in a pullbackThe Dow Jones Industrial Average (DJIA) is currently facing significant bearish pressure, as indicated by recent market trends and technical analysis. The support trend line has broken, leading to a notable drop in the index. This break, coupled with a clear pullback, presents an opportune moment for traders to consider short positions with a logical stop loss.
From a fundamental perspective, the rising rate of unemployment and the postponement of interest rate cuts are increasing the chances of a recession. These economic indicators suggest that the market could experience further declines as investors react to the potential economic downturn.

Nasdaq Thoughts 07-Aug-2024Kindly see my NASDAQ thoughts for today. These videos are aimed at making you compare charts with mine if you are a price acton trader and use my thoughts to improve your skill. They are not meant as signals even if they seem like they are. I want you to learn and be great

Dow Jones Index (US30): One More Bearish Setup
I also see a bearish trend following setup on Dow Jones.
After yesterday's selloff, the market started a correctional movement.
On an hourly time frame, the market found a resistance around 39100 level
and formed a double top on that.
I think that the Index may drop at least to 38655 level.
❤️Please, support my work with like, thank you!❤️

Nasdaq Thoughts 06-Aug-2024Hello all, Kindly see my NASDAQ thoughts for today. These videos are aimed at making you compare charts with mine if you are a price acton trader and use my thoughts to improve your skill. They are not meant as signals even if they seem like they are. I want you to learn and be great

Bearish reversal?NAS100 is rising towards the resistance level which is a pullback resistance that is slightly above the 38.2% Fibonacci retracement and could reverse from this level to our take profit.
Entry: 18,292.33
Why we like it:
There is a pullback resistance level which is slightly above the 38.2% Fibonacci retracement.
Stop loss: 18,736.57
Why we like it:
There is a pullback resistance that aligns with the 61.88% Fibonacci retracement.
Take profit: 17,445.52
Why we like it:
There is a pullback support.
Please be advised that the information presented on TradingView is provided to Vantage (‘Vantage Global Limited’, ‘we’) by a third-party provider (‘Everest Fortune Group’). Please be reminded that you are solely responsible for the trading decisions on your account. There is a very high degree of risk involved in trading. Any information and/or content is intended entirely for research, educational and informational purposes only and does not constitute investment or consultation advice or investment strategy. The information is not tailored to the investment needs of any specific person and therefore does not involve a consideration of any of the investment objectives, financial situation or needs of any viewer that may receive it. Kindly also note that past performance is not a reliable indicator of future results. Actual results may differ materially from those anticipated in forward-looking or past performance statements. We assume no liability as to the accuracy or completeness of any of the information and/or content provided herein and the Company cannot be held responsible for any omission, mistake nor for any loss or damage including without limitation to any loss of profit which may arise from reliance on any information supplied by Everest Fortune Group.

NASDAQ erased 3 months of gains. Is this a Bear Market?In early E.U. session today the Nasdaq futures (US100) reached a level that was last seen on April 25, essentially erasing market gains of more than 3 months! By doing so, it hit the 1W MA50 (blue trend-line) for the first time since the week of March 13 2023 (almost 17 months).
That is the strongest long-term Support for the index and technically what potentially separates a long-term rally from a long-term correction phase. What matters here is the 1W candle closing. As long as the weekly candles close above the 1W MA50, the long-term bullish trend is maintained.
Last time the index closed a week below the 1W MA50 was on January 17 2022, it extended the bleeding to the 1W MA100 (green trend-line). What confirmed the new Bear Cycle was the failure to close a 1W candle again above the 1W MA50, even though it broke 4 times (January 31 - April 04 2022).
Since Nasdaq's long-term pattern remains a Channel Up anyway (since the October 10 2022 market bottom), if it holds and keeps closing above the 1W MA50, we expect a new +47% Bullish Leg (the previous two have been +48% and +49% respectively), which gives a long-term Target at 25400.
If however the index closes below the 1W MA50, we expect at least a 1W MA100 test, giving a rough Sell Target at 15500 (could be a little higher though). Further selling and a potential new Bear Cycle, will be confirmed only by a failure to recover and close above the 1W MA50 again.
-------------------------------------------------------------------------------
** Please LIKE 👍, FOLLOW ✅, SHARE 🙌 and COMMENT ✍ if you enjoy this idea! Also share your ideas and charts in the comments section below! This is best way to keep it relevant, support us, keep the content here free and allow the idea to reach as many people as possible. **
-------------------------------------------------------------------------------
💸💸💸💸💸💸
👇 👇 👇 👇 👇 👇

US100 Outlook ICT ConceptsUS100 Analysis
💰 Welcome to Your Channel!
Welcome to our channel where we delve into the intricacies of financial markets. Today, we focus on US100, dissecting its current price action to uncover strategic trading opportunities. Join us as we analyze key levels and market dynamics, aiming to refine our trading strategies and maximize potential gains.
💡Previous Analysis Review:
In our prior analysis, we forecasted a price retracement to the upside. This expectation was realized, as the price indeed experienced a movement higher.
📍Current Market Overview:
At present, the price has swept both the previous week’s low and the previous month’s low. These levels are crucial as they represent key sell-side liquidity areas.
🔍 Identifying Key Levels for Long Scenarios
In addition to the fair value gap, there are other critical levels to consider for potential long scenarios, including:
• Buy-Side Liquidity (BSL): A level where buying interest may consolidate.
• Previous Week High: A historical resistance level that could serve as support during a retracement.
• Volume Imbalance (VI): Areas on the chart where significant volume was traded, often leading to price adjustments.
• Daily Fair Value Gap (FVG): Larger time frame imbalances that can influence trading strategy.
📉 Key Considerations
There exists additional sell-side liquidity just below the current price on the chart. This could potentially draw the market’s attention, prompting a move toward these levels. However, it’s important to note that the probability of such a move is somewhat diminished after the substantial downward trend that we have witnessed.
📈 Bullish Scenario
Current conditions suggest potential long scenarios supported by a fair value gap on the four-hour chart, with upward expansion possible. However, due to the impending NFP news, we will not engage in trades today, but if price moves upward, we will target key levels including BSL, PWH, VI, and FVG. We recommend using lower time frames for more precise entry opportunities.
📉 Bearish Scenario
For any potential short scenarios, we require a retracement back to higher levels. This could involve targeting lower time frame levels of resistance or buy-side liquidity that can be taken out before executing a sell. After this maneuver, we would then focus on targeting the sell-side liquidity present on the chart.
📊 Chart Analysis Summary
We observed the anticipated retracement in price and noted significant sell-side liquidity levels being tested. Current conditions suggest potential long scenarios, supported by a fair value gap on the four-hour chart along with other key levels, though the likelihood of downward sell opportunities below the chart appears reduced after recent price movements.
🙏 Thank you for joining us!
Exploring US100 today highlighted the importance of effective risk management in trading success. Prioritize research, implement robust strategies, and seek guidance for confident market navigation. Stay tuned for more insights on our channel. Here's to profitable trading and continuous learning!
⚠️ Disclaimer
The information provided here is for educational purposes only and should not be taken as financial advice. Always conduct your own research and consult a licensed financial advisor before making any investment decisions.

NAS100 Technical Analysis and Trade Idea US100 👉🔍 Looking at this NAS100 chart, we can clearly see that the price has broken a 4-hour downtrend. There is a noticeable break in market structure to the upside, followed by a significant rally with the US100. It has now reached a resistance level, and I'm anticipating a retracement back down into the 50% to 61.8% Fibonacci levels, where I'll be looking for a NASDAQ potential buy opportunity if the price action described in the video unfolds.
It's important to note that these observations are speculative and not a definitive forecast. Confirming specific price movements is crucial before making any buying or selling decisions, as explained in the video. The video provides a comprehensive analysis of the current trend, market structure, and price dynamics. Remember, this educational content is designed to enhance understanding and does not guarantee outcomes. Trading inherently involves substantial risks, so employing robust risk management techniques is essential. 📈🔔
