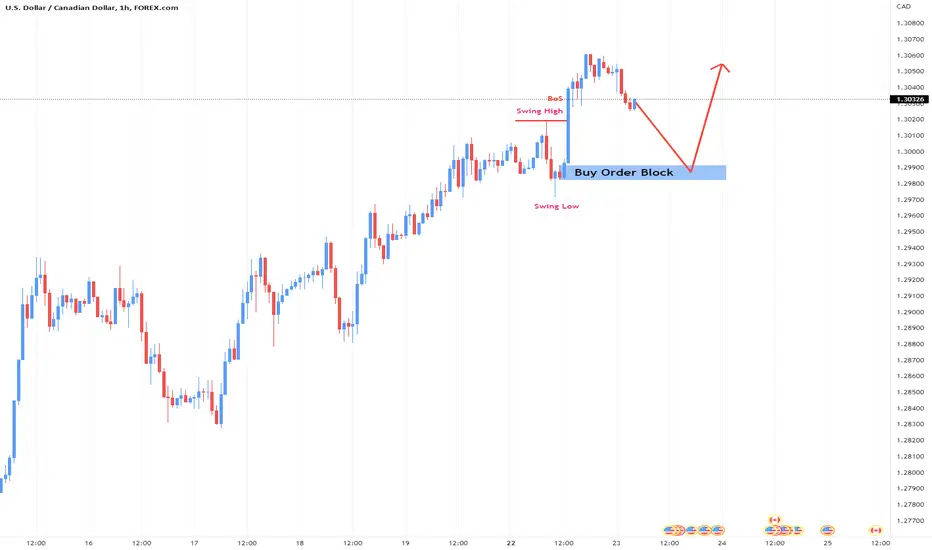
USDCAD Idea H1Here is my view for USDCAD on H1. The price could go up, you can put a pending order on the Order block or find an entry on LTF within OB Zone. Trade Safe!
Usdcadsignal

USDCAD - FUNDAMENTAS WITH TECHNICAL LEVELS#USDCAD
USDCAD is going up quite a bit right now. That's because OIL is down quite a bit and POWELL'S HAWKISH COMMENTS UPDATES came. They have been working to make USD STRONG in recent days. Due to this reason, STOCKS can move DOWN SIDE if the USD becomes STRONG like this.
Right now, there is a very good BUY towards the UPSIDE because US DATA and UPDATES are POSITIVE. We think it will go down to 1.2999 level before going UP again with MARKET RISK ON SENTIMENT.
Somehow, there will be a chance for USDCAD to go up to 1.3221 LEVEL again. We wait until the UPSIDE TREND CONTINUES. FOLLOW THE STRUCTURE GIVEN. usdcadusdcad

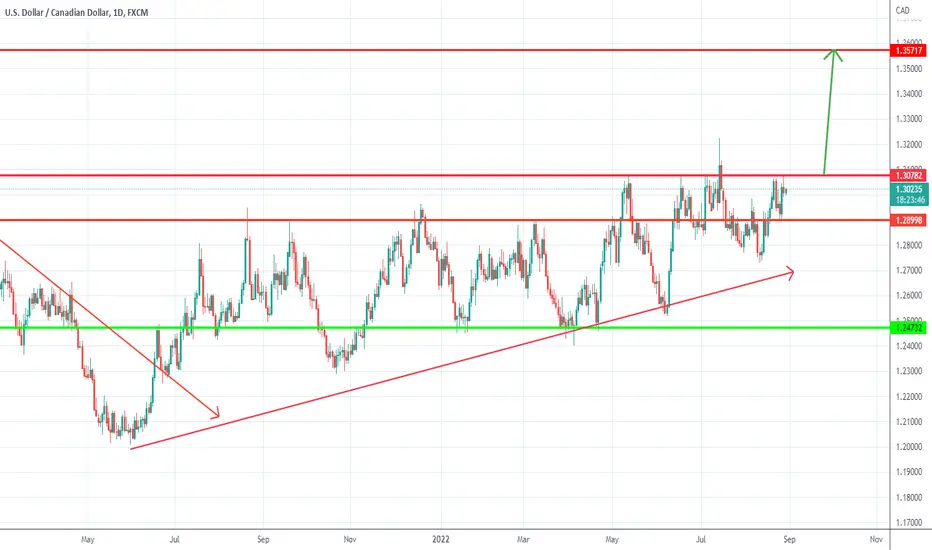
UsdCad to break above resistance (medium term)Since May, 1.3050-1.31 is acting as resistance for UsdCad with the pair reversing every time after touching this zone.
However, bulls regain control every time putting in higher lows on our chart giving the impression of pressing to the upside.
I expect a break above this zone in the medium term and a rise to the next important level at 1.35
USDCAD topdown analysis, UPDATEDHello traders, this is the full breakdown of this pair. We will take this trade if all the conditions are satisfied as discussed in the analysis. Smash the like button if you find value in this analysis and drop a comment if you have any questions or let me know which pair to cover in my next analysis.


USD/CAD LongUSD/CAD Buy. Dont risk more than 3% of ur account. Dont forget to riskfree ur order after TP1. * High risk

💰Best Buy & Sell Areas USDCAD in 15minute time frames 🔥🔰You can see the analysis of the US dollar in Canadian dollars in the 15-minute team🔍
🔰Supply and demand zones and trendlines are specified🧐
✴️Due to the price being in the supply range and also the price being in the range of the high uptrend line (black🖤) the price can fall to near the demand range and the lower uptrend line (black🖤).
If the price can reach the top of the supply area, it can climb to the resistance in the four-hour time frame (orange🧡).
In your opinion, the price will move according to which scenario, GREEN💚 or RED❤️ ❓❓
I hope the analysis was useful for you🤍🌹
📌Please introduce the channel to your friends 🙏🏻
____________📈TRADER STREET📉_______________

USDCAD Prediction H1Here is my view for USDCAD on H1. The price could go up, you can put a pending order on the Order block or find an entry on LTF within OB Zone. Trade Safe!
USDCAD top-down analysisHello traders, this is the full breakdown of this pair. We will take this trade if all the conditions are satisfied as discussed in the analysis. Smash the like button if you find value in this analysis and drop a comment if you have any questions or let me know which pair to cover in my next analysis.

USDCAD top-down analysisHello traders, this is the full breakdown of this pair. We will take this trade if all the conditions are satisfied as discussed in the analysis. Smash the like button if you find value in this analysis and drop a comment if you have any questions or let me know which pair to cover in my next analysis.

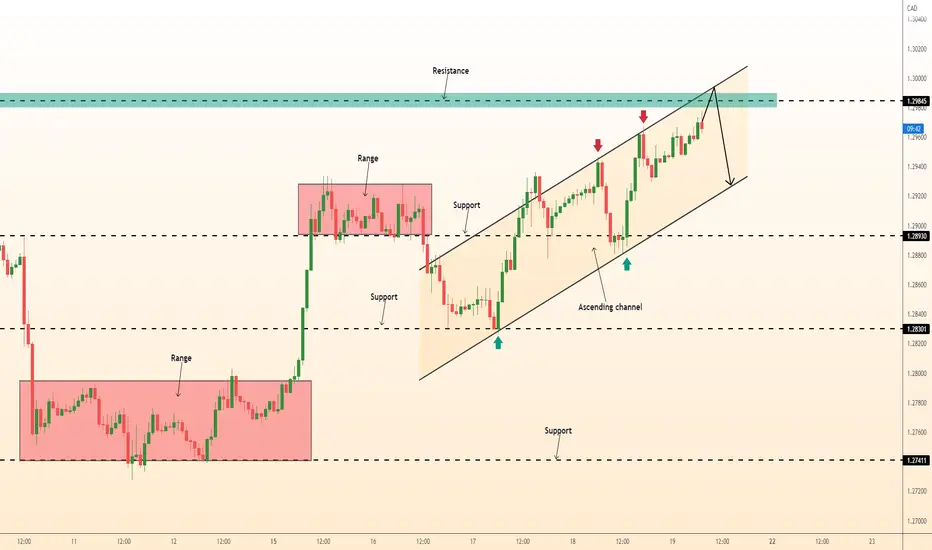
DeGRAM | USDCAD at strong resistence USDCAD is moving in an ascending channel.
Price action is testing a strong resistance level and it shows a divergence.
We might see a short-term pullback.
-------------------
Share your opinion in the comments and support the idea with like. Thanks for your support!
USDCAD BUYHi fellow traders, USDCAD seems to be completing the expanding flat correction in WXY formation. Look for a buy opportunity from here and target the resistance levels. Good luck and trade safe!

USDCAD BUY ANALYSISLooking at USDCAD on 3H timeframe
Currently looking for long/buy position
We currently waiting for signals of reversal whereby we will then execute the trade

USDCAD UP Trend.!#USDCAD Looking for Buy trade setup as I mentioned in the Chart.!
Keep Supporting LIKE, COMMENT And FOLLOW.!
Thank You.!

USDCAD possible buy zone!!USDCAD has formed a bullish engulfing on the weekly timeframe in the direction of the up trend. On the daily, there is an inverted head & shoulder visible. On the retest of the neckline of daily inverted head & shoulder, a long trade is possible!
Press the like button if you find value in this analysis :)

USDCAD top-down analysisHello traders, this is the full breakdown of this pair. We will take this trade if all the conditions are satisfied as discussed in the analysis. Smash the like button if you find value in this analysis and drop a comment if you have any questions or let me know which pair to cover in my next analysis.

USDCAD Short: Inside Bar within Parallel Descending Channel Trend: Bearish
Candle: Inside Bar
Support and Resistance: Support near the TP and Resistance at LH
Parallel Descending Channel

USDCAD SELL ANALYSISLooing at USDCAD on 30M timeframe
We looking for a possible SELL/SHORT position
We looking for a possible downward at this phase

USDCAD possible sell zone!!USDCAD( D ) has formed another bearish engulfing in the direction of a daily downtrend from daily 20EMA. There has been already a series of bearish of engulfer in the direction of the trend with a series of lower highs. A possible sell opportunity may arise upon the close of the daily candle with a lower low.

USDCADUSD_CAD Continues bearish ,
pullback at supply zone and a move down towards the target 1 or 2
SHORT

USDCAD possible short for 1.2720weekly chart making lower low and lower high. 1.2870-90 initial supply zone if fails to hold then supply zone for short 1.2925-50. stop loss 1.2960 target: 1.2720

DeGRAM | USDCAD descending channelUSDCAD is moving in a descending channel.
Price action is testing a resistance level.
We might see a short-term pullback.
-------------------
Share your opinion in the comments and support the idea with like. Thanks for your support!

USDCAD Down Trend.!#USDCAD Looking for Sell trade setup as I mentioned in the Chart.!
Keep Supporting LIKE, COMMENT And FOLLOW.!
Thank You.!

USDCAD Down Trend.!#USDCAD Looking for Sell trade setup as I mentioned in the Chart.!
Keep Supporting LIKE, COMMENT And FOLLOW.!
Thank You.!
