Market Analysis: USD/CHF Regains StrengthMarket Analysis: USD/CHF Regains Strength
USD/CHF is rising and might aim for a move toward the 0.8400 resistance.
Important Takeaways for USD/CHF Analysis Today
- USD/CHF is showing positive signs above the 0.8265 resistance zone.
- There is a connecting bullish trend line forming with support at 0.8300 on the hourly chart at FXOpen.
USD/CHF Technical Analysis
On the hourly chart of USD/CHF at FXOpen, the pair started a decent increase from the 0.8200 support. The US Dollar climbed above the 0.8245 resistance zone against the Swiss Franc.
The bulls were able to pump the pair above the 50-hour simple moving average and 0.8300. A high was formed at 0.8340 and the pair is now consolidating gains above the 23.6% Fib retracement level of the upward move from the 0.8185 swing low to the 0.8340 high.
There is also a connecting bullish trend line forming with support at 0.8300. On the upside, the pair is now facing resistance near 0.8340. The main resistance is now near 0.8350.
If there is a clear break above the 0.8350 resistance zone and the RSI remains above 50, the pair could start another increase. In the stated case, it could test 0.8400. If there is a downside correction, the pair might test the 0.8300 level.
The first major support on the USD/CHF chart is near the 0.8265 level and the 50% Fib retracement level of the upward move from the 0.8185 swing low to the 0.8340 high.
The next key support is near the 0.8245 level. A downside break below 0.8245 might spark bearish moves. Any more losses may possibly open the doors for a move toward the 0.8200 level in the near term.
This article represents the opinion of the Companies operating under the FXOpen brand only. It is not to be construed as an offer, solicitation, or recommendation with respect to products and services provided by the Companies operating under the FXOpen brand, nor is it to be considered financial advice.
Usdchf!

MarketBreakdown | EURUSD, USDCAD, NZDUSD, USDCHF
Here are the updates & outlook for multiple instruments in my watch list.
1️⃣ #EURUSD daily time frame 🇪🇺🇺🇸
EURUSD formed a huge head and shoulders pattern.
The price is currently testing its horizontal neckline.
Bearish breakout of that and a daily candle close below
will confirm a bearish reversal and push the prices lower.
2️⃣ #USDCAD daily time frame 🇺🇸🇨🇦
The price is breaking a solid falling trend line.
Its violation is an important bullish signal that
indicates a strength of the buyers.
We can expect even more growth.
3️⃣ #NZDUSD daily time frame 🇺🇸🇳🇿
The pair is consolidating within a horizontal range.
The price is going to reach its support soon.
I suggest looking for a pullback trade from that then.
4️⃣ #USDCHF daily time frame 🇺🇸🇨🇭
The price is stuck within a horizontal parallel channel.
I expect a bullish continuation within that and a test
of its upper boundary.
Then, look for a confirmation to see and try to catch a retracement from that.
Do you agree with my market breakdown?
❤️Please, support my work with like, thank you!❤️
I am part of Trade Nation's Influencer program and receive a monthly fee for using their TradingView charts in my analysis.

Potential bullish rise?The Swissie (USD/CHF) has reacted off the pivot and could rise to the 1st resistance which is a pullback resistance that aligns with the 127.2% Fibonacci extension.
Pivot: 0.8276
1st Support: 0.8218
1st Resistance: 0.8373
Risk Warning:
Trading Forex and CFDs carries a high level of risk to your capital and you should only trade with money you can afford to lose. Trading Forex and CFDs may not be suitable for all investors, so please ensure that you fully understand the risks involved and seek independent advice if necessary.
Disclaimer:
The above opinions given constitute general market commentary, and do not constitute the opinion or advice of IC Markets or any form of personal or investment advice.
Any opinions, news, research, analyses, prices, other information, or links to third-party sites contained on this website are provided on an "as-is" basis, are intended only to be informative, is not an advice nor a recommendation, nor research, or a record of our trading prices, or an offer of, or solicitation for a transaction in any financial instrument and thus should not be treated as such. The information provided does not involve any specific investment objectives, financial situation and needs of any specific person who may receive it. Please be aware, that past performance is not a reliable indicator of future performance and/or results. Past Performance or Forward-looking scenarios based upon the reasonable beliefs of the third-party provider are not a guarantee of future performance. Actual results may differ materially from those anticipated in forward-looking or past performance statements. IC Markets makes no representation or warranty and assumes no liability as to the accuracy or completeness of the information provided, nor any loss arising from any investment based on a recommendation, forecast or any information supplied by any third-party.

USD/CHF H4 | Approaching a multi-swing-high resistanceUSD/CHF is rising towards a multi-swing-high resistance and could potentially reverse off this level to drop lower.
Sell entry is at 0.8315 which is a multi-swing-high resistance.
Stop loss is at 0.8380 which is a level that sits above the 38.2% Fibonacci retracement and a pullback resistance.
Take profit is at 0.8194 which is a multi-swing-low support that aligns with the 50.0% Fibonacci retracement.
High Risk Investment Warning
Trading Forex/CFDs on margin carries a high level of risk and may not be suitable for all investors. Leverage can work against you.
Stratos Markets Limited (tradu.com):
CFDs are complex instruments and come with a high risk of losing money rapidly due to leverage. 63% of retail investor accounts lose money when trading CFDs with this provider. You should consider whether you understand how CFDs work and whether you can afford to take the high risk of losing your money.
Stratos Europe Ltd (tradu.com):
CFDs are complex instruments and come with a high risk of losing money rapidly due to leverage. 63% of retail investor accounts lose money when trading CFDs with this provider. You should consider whether you understand how CFDs work and whether you can afford to take the high risk of losing your money.
Stratos Global LLC (tradu.com):
Losses can exceed deposits.
Please be advised that the information presented on TradingView is provided to Tradu (‘Company’, ‘we’) by a third-party provider (‘TFA Global Pte Ltd’). Please be reminded that you are solely responsible for the trading decisions on your account. There is a very high degree of risk involved in trading. Any information and/or content is intended entirely for research, educational and informational purposes only and does not constitute investment or consultation advice or investment strategy. The information is not tailored to the investment needs of any specific person and therefore does not involve a consideration of any of the investment objectives, financial situation or needs of any viewer that may receive it. Kindly also note that past performance is not a reliable indicator of future results. Actual results may differ materially from those anticipated in forward-looking or past performance statements. We assume no liability as to the accuracy or completeness of any of the information and/or content provided herein and the Company cannot be held responsible for any omission, mistake nor for any loss or damage including without limitation to any loss of profit which may arise from reliance on any information supplied by TFA Global Pte Ltd.
The speaker(s) is neither an employee, agent nor representative of Tradu and is therefore acting independently. The opinions given are their own, constitute general market commentary, and do not constitute the opinion or advice of Tradu or any form of personal or investment advice. Tradu neither endorses nor guarantees offerings of third-party speakers, nor is Tradu responsible for the content, veracity or opinions of third-party speakers, presenters or participants.

USDCHF H4 I Bullish Bounce Off Based on the H4 chart analysis, the price is falling toward our buy entry level at 0.8111, a pullback support that aligns with the 78.6% Fibonacci retracement.
Our take profit is set at 0.8236, a pullback resistance.
The stop loss is placed at 0.8037, a swing low support.
High Risk Investment Warning
Trading Forex/CFDs on margin carries a high level of risk and may not be suitable for all investors. Leverage can work against you.
Stratos Markets Limited (tradu.com):
CFDs are complex instruments and come with a high risk of losing money rapidly due to leverage. 63% of retail investor accounts lose money when trading CFDs with this provider. You should consider whether you understand how CFDs work and whether you can afford to take the high risk of losing your money.
Stratos Europe Ltd (tradu.com):
CFDs are complex instruments and come with a high risk of losing money rapidly due to leverage. 63% of retail investor accounts lose money when trading CFDs with this provider. You should consider whether you understand how CFDs work and whether you can afford to take the high risk of losing your money.
Stratos Global LLC (tradu.com):
Losses can exceed deposits.
Please be advised that the information presented on TradingView is provided to Tradu (‘Company’, ‘we’) by a third-party provider (‘TFA Global Pte Ltd’). Please be reminded that you are solely responsible for the trading decisions on your account. There is a very high degree of risk involved in trading. Any information and/or content is intended entirely for research, educational and informational purposes only and does not constitute investment or consultation advice or investment strategy. The information is not tailored to the investment needs of any specific person and therefore does not involve a consideration of any of the investment objectives, financial situation or needs of any viewer that may receive it. Kindly also note that past performance is not a reliable indicator of future results. Actual results may differ materially from those anticipated in forward-looking or past performance statements. We assume no liability as to the accuracy or completeness of any of the information and/or content provided herein and the Company cannot be held responsible for any omission, mistake nor for any loss or damage including without limitation to any loss of profit which may arise from reliance on any information supplied by TFA Global Pte Ltd.
The speaker(s) is neither an employee, agent nor representative of Tradu and is therefore acting independently. The opinions given are their own, constitute general market commentary, and do not constitute the opinion or advice of Tradu or any form of personal or investment advice. Tradu neither endorses nor guarantees offerings of third-party speakers, nor is Tradu responsible for the content, veracity or opinions of third-party speakers, presenters or participants.

USD/CHF Sideways Phase Could Break on Trade Sentiment Shift USD/CHF Weekly Setup – Sideways Phase Could Break on Trade Sentiment Shift
USD/CHF is currently consolidating in a tight range near 0.8300, but under the surface, big moves are brewing.
Last week, the pair pulled back as US bond yields dipped lower and the USD weakened. However, this isn’t just about technicals — the bigger story is coming from trade negotiations, central bank signals, and global inflation pressures.
🌍 What’s Driving the Market?
1️⃣ US-China Trade Talks Return to Spotlight
Early signs of progress in global trade relations helped stabilize market sentiment. President Trump confirmed a preliminary trade agreement with the UK and hinted at cautious talks with China this weekend in Switzerland. While no breakthroughs are expected, any surprise deal or tariff easing could lift the USD.
2️⃣ SNB Dovish Tilt Pressures CHF
SNB Chairman Schlegel has opened the door for more rate cuts if the Swiss economy continues to show weakness. April CPI came in flat, and core inflation dropped, adding to the dovish case.
3️⃣ Fed Uncertainty
While the Fed held rates steady, markets are still debating the next move. The bond market suggests rate cuts are now less likely in the short-term, which could offer near-term support to the USD.
📊 Technical Picture – H4 Outlook
Price is forming a sideways accumulation just under the 0.8310 level. A deeper FVG (Fair Value Gap) still exists overhead from the recent drop. If USD strength returns, a clean break toward this imbalance zone is likely.
We're also seeing lower shadows and absorption wicks near support zones, signaling buyers are active at the bottom of this range.
📌 Key Levels
BUY ZONE:
→ 0.8265 – 0.8245
SL: 0.8200
TP targets:
→ 0.8325
→ 0.8365
→ 0.8425
→ 0.8585
🧠 Strategy Notes
This setup is range-to-breakout biased.
If the market responds positively to US-China trade headlines or US bond yields recover, USD/CHF could launch higher into the imbalance zone.
Watch for a confirmed H4 breakout candle above 0.8320 for added confidence.
Keep in mind the SNB meeting on June 19th — markets may start pricing in policy shifts earlier than expected.
📣 Final Thoughts
USD/CHF is at a turning point — and what happens next will depend less on indicators and more on trade diplomacy and central bank tones. As always, let the market show its hand.
✅ Wait for price to come to your zone.
⛔ Don’t chase moves in this volatility.
🔔 Stay alert to any headlines from the US, China, or SNB this week.

USDCHF LONG FORECAST Q2 W19 D9 Y25USDCHF LONG FORECAST Q2 W19 D9 Y25
Professional Risk Managers👋
Welcome back to another FRGNT chart update📈
Diving into some Forex setups using predominantly higher time frame order blocks alongside confirmation breaks of structure.
Let’s see what price action is telling us today!
💡Here are some trade confluences📝
✅Weekly order block rejection
✅Daily order block rejection
✅15’ order block
✅Intraday bullish breaks of structure
🔑 Remember, to participate in trading comes always with a degree of risk, therefore as professional risk managers it remains vital that we stick to our risk management plan as well as our trading strategies.
📈The rest, we leave to the balance of probabilities.
💡Fail to plan. Plan to fail.
🏆It has always been that simple.
❤️Good luck with your trading journey, I shall see you at the very top.
🎯Trade consistent, FRGNT X

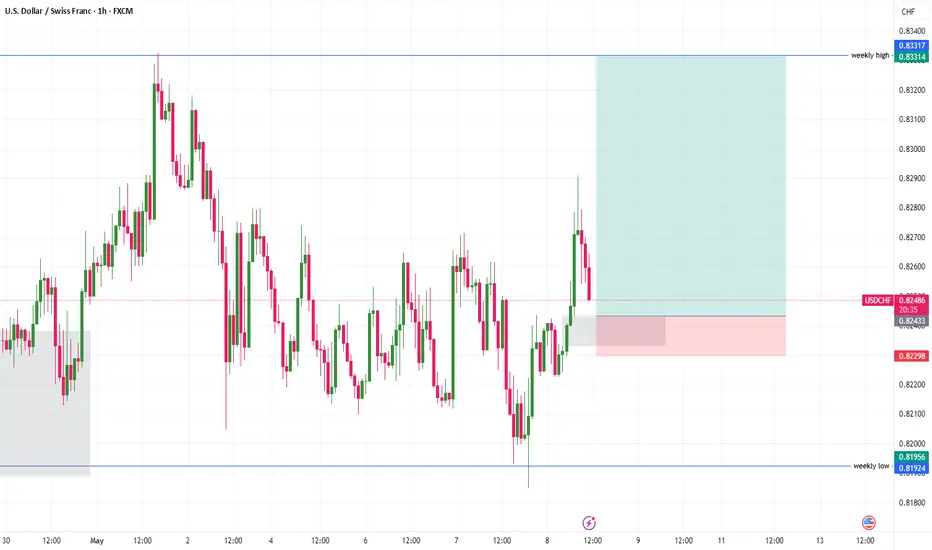
USDCHF Trade Idea, AMD PATTERN: last trade of the week for meClean setup unfolding on USDCHF! After grabbing liquidity near the weekly low (0.81924), price showed strength and reversed with conviction (AMD Pattern). Entered long from the refined demand zone and now eyeing the weekly high at 0.83317 as target.
📌 Trade Breakdown:
🔹 Entry Zone: Bullish reaction from demand
🔹 Confluence: Liquidity sweep + internal structure shift
🔹 Target: Weekly high zone at 0.83317
🔹 Risk/Reward: Solid R:R with protected downside below recent low
Let’s see if bulls can maintain momentum and drive us to TP! 📈🔥
#USDCHF #SmartMoneyConcepts #ForexTrading #LiquiditySweep #TradingView #TradeSetu
Bullish bounce?The Swissie (USD/CHF is reacting off the pivot and could potentially rise to the 1st resistance that aligns with the 38.2% Fibonacci retracement.
Pivot: 0.8213
1st Support: 0.8116
1st Resistance: 0.8357
Risk Warning:
Trading Forex and CFDs carries a high level of risk to your capital and you should only trade with money you can afford to lose. Trading Forex and CFDs may not be suitable for all investors, so please ensure that you fully understand the risks involved and seek independent advice if necessary.
Disclaimer:
The above opinions given constitute general market commentary, and do not constitute the opinion or advice of IC Markets or any form of personal or investment advice.
Any opinions, news, research, analyses, prices, other information, or links to third-party sites contained on this website are provided on an "as-is" basis, are intended only to be informative, is not an advice nor a recommendation, nor research, or a record of our trading prices, or an offer of, or solicitation for a transaction in any financial instrument and thus should not be treated as such. The information provided does not involve any specific investment objectives, financial situation and needs of any specific person who may receive it. Please be aware, that past performance is not a reliable indicator of future performance and/or results. Past Performance or Forward-looking scenarios based upon the reasonable beliefs of the third-party provider are not a guarantee of future performance. Actual results may differ materially from those anticipated in forward-looking or past performance statements. IC Markets makes no representation or warranty and assumes no liability as to the accuracy or completeness of the information provided, nor any loss arising from any investment based on a recommendation, forecast or any information supplied by any third-party.

USDCHF - Bias, Narrative, ModelHere is some analysis on USDCHF for an intraday type of trade. Let's see if I end up taking a trade or not. All analysis done in the video.
- R2F Trading

Weekly Forecasts UPDATES! ALL Markets Analyzed! Stocks & FOREXIn this Weekly Forecast UPDATE, we will analyze the S&P 500, NASDAQ, DOW JONES, Gold and Metals futures, and the FOREX Majors for Thursday, May 8th.
The targets set in last weekend's forecasts are still in play! Trade accordingly.
Enjoy!
May profits be upon you.
Leave any questions or comments in the comment section.
I appreciate any feedback from my viewers!
Like and/or subscribe if you want more accurate analysis.
Thank you so much!
Disclaimer:
I do not provide personal investment advice and I am not a qualified licensed investment advisor.
All information found here, including any ideas, opinions, views, predictions, forecasts, commentaries, suggestions, expressed or implied herein, are for informational, entertainment or educational purposes only and should not be construed as personal investment advice. While the information provided is believed to be accurate, it may include errors or inaccuracies.
I will not and cannot be held liable for any actions you take as a result of anything you read here.
Conduct your own due diligence, or consult a licensed financial advisor or broker before making any and all investment decisions. Any investments, trades, speculations, or decisions made on the basis of any information found on this channel, expressed or implied herein, are committed at your own risk, financial or otherwise.

USDCHF LONG FORECAST Q2 W19 D8 Y25USDCHF LONG FORECAST Q2 W19 D8 Y25
Professional Risk Managers👋
Welcome back to another FRGNT chart update📈
Diving into some Forex setups using predominantly higher time frame order blocks alongside confirmation breaks of structure.
Let’s see what price action is telling us today!
💡Here are some trade confluences📝
✅Weekly order block rejection
✅Daily order block rejection
✅15’ order block
✅Intraday bullish breaks of structure
🔑 Remember, to participate in trading comes always with a degree of risk, therefore as professional risk managers it remains vital that we stick to our risk management plan as well as our trading strategies.
📈The rest, we leave to the balance of probabilities.
💡Fail to plan. Plan to fail.
🏆It has always been that simple.
❤️Good luck with your trading journey, I shall see you at the very top.
🎯Trade consistent, FRGNT X

USD/CHF "SWISSY" Forex Bank Bullish Heist (Swing Trade Plan)🌟Hi! Hola! Ola! Bonjour! Hallo! Marhaba!🌟
Dear Money Makers & Robbers, 🤑 💰💸✈️
Based on 🔥Thief Trading style technical and fundamental analysis🔥, here is our master plan to heist the USD/CHF "SWISSY" Forex Market. Please adhere to the strategy I've outlined in the chart, which emphasizes long entry. Our aim is to escape near the high-risk ATR Line Level. Risky level, overbought market, consolidation, trend reversal, trap at the level where traders and bearish robbers are stronger. 🏆💸"Take profit and treat yourself, traders. You deserve it!💪🏆🎉
Entry 📈 : "The heist is on! Wait for the MA breakout (0.83300) then make your move - Bullish profits await!"
however I advise to Place Buy stop orders above the Moving average (or) Place buy limit orders within a 15 or 30 minute timeframe most recent or swing, low or high level for Pullback entries.
📌I strongly advise you to set an "alert (Alarm)" on your chart so you can see when the breakout entry occurs.
Stop Loss 🛑: "🔊 Yo, listen up! 🗣️ If you're lookin' to get in on a buy stop order, don't even think about settin' that stop loss till after the breakout 🚀. You feel me? Now, if you're smart, you'll place that stop loss where I told you to 📍, but if you're a rebel, you can put it wherever you like 🤪 - just don't say I didn't warn you ⚠️. You're playin' with fire 🔥, and it's your risk, not mine 👊."
📍 Thief SL placed at the recent/swing low level Using the 2H timeframe (0.82000) Day/Swing trade basis.
📍 SL is based on your risk of the trade, lot size and how many multiple orders you have to take.
🏴☠️Target 🎯: 0.85300 (or) Escape Before the Target.
🧲Scalpers, take note 👀 : only scalp on the Long side. If you have a lot of money, you can go straight away; if not, you can join swing traders and carry out the robbery plan. Use trailing SL to safeguard your money 💰.
💰💵💸USD/CHF "SWISSY" Forex Bank Heist (Swing Trade Plan) is currently experiencing a neutral trend there is high chance for bullishness,., driven by several key factors. .☝☝☝
📰🗞️Get & Read the Fundamental, Macro, COT Report, Inventory and Storage Analysis, Seasonal Factors, Sentimental Outlook, Intermarket Analysis, Future trend targets.. go ahead to check 👉👉👉🔗🔗🌎🌏🗺
⚠️Trading Alert : News Releases and Position Management 📰 🗞️ 🚫🚏
As a reminder, news releases can have a significant impact on market prices and volatility. To minimize potential losses and protect your running positions,
we recommend the following:
Avoid taking new trades during news releases
Use trailing stop-loss orders to protect your running positions and lock in profits
💖Supporting our robbery plan 💥Hit the Boost Button💥 will enable us to effortlessly make and steal money 💰💵. Boost the strength of our robbery team. Every day in this market make money with ease by using the Thief Trading Style.🏆💪🤝❤️🎉🚀
I'll see you soon with another heist plan, so stay tuned 🤑🐱👤🤗🤩

USDCHF Confirmed bottom Buy SignalLast time we looked at the USDCHF pair was three months ago (February 05 2025, see chart below) and it gave us the best sell signal possible, easily hitting our 0.8400 Target:
This time the long-term price action has transitioned into a Megaphone pattern, whose bottom was reached on the April 21 Low. At the same time the 1D RSI hit the 18.90 Support, which has been the Ultimate Buy Signal for the August 05 2024 and December 28 2023 Lows.
Since the price has been rebounding since, we view this as a confirmed buy signal and the start of the Megaphone's new Bullish Leg. The previous two rose by +10% and +10.67% respectively so a mere repeat of the +10% rally, will hit at least 0.88000.
-------------------------------------------------------------------------------
** Please LIKE 👍, FOLLOW ✅, SHARE 🙌 and COMMENT ✍ if you enjoy this idea! Also share your ideas and charts in the comments section below! This is best way to keep it relevant, support us, keep the content here free and allow the idea to reach as many people as possible. **
-------------------------------------------------------------------------------
Disclosure: I am part of Trade Nation's Influencer program and receive a monthly fee for using their TradingView charts in my analysis.
💸💸💸💸💸💸
👇 👇 👇 👇 👇 👇

USDCHF: Will Start Falling! Here is Why:
The price of USDCHF will most likely collapse soon enough, due to the supply beginning to exceed demand which we can see by looking at the chart of the pair.
Disclosure: I am part of Trade Nation's Influencer program and receive a monthly fee for using their TradingView charts in my analysis.
❤️ Please, support our work with like & comment! ❤️

USDCHF INTRADAY sideways consolidation Recent price action in USDCHF suggests an oversold bounce, with resistance capping gains at the 0.8300 level.
The continuation of selling pressure could extend the downside move, with key support levels at 0.8130, followed by 0.8090 and 0.8050.
Alternatively, a confirmed breakout above 0.8300, accompanied by a daily close higher, would invalidate the bearish outlook. In this scenario, USDCHF could target 0.8365, with further resistance at 0.8400 and 0.8470.
Conclusion:
The price remains below pivotal level, with 0.8300 acting as a key resistance. Failure to break above this level could reinforce downside risks, while a breakout could shift momentum back in favour of bulls. Traders should watch for confirmation signals before positioning for the next move.
This communication is for informational purposes only and should not be viewed as any form of recommendation as to a particular course of action or as investment advice. It is not intended as an offer or solicitation for the purchase or sale of any financial instrument or as an official confirmation of any transaction. Opinions, estimates and assumptions expressed herein are made as of the date of this communication and are subject to change without notice. This communication has been prepared based upon information, including market prices, data and other information, believed to be reliable; however, Trade Nation does not warrant its completeness or accuracy. All market prices and market data contained in or attached to this communication are indicative and subject to change without notice.

Bullish bounce?The Swissie (USD/CHF) is reacting off the pivot which is an overlap support and could bounce to the 1st resistance which lines up with the 38.2% Fibonacci retracement.
Pivot: 0.8199
1st Support: 0.8116
1st Resistance: 0.8371
Risk Warning:
Trading Forex and CFDs carries a high level of risk to your capital and you should only trade with money you can afford to lose. Trading Forex and CFDs may not be suitable for all investors, so please ensure that you fully understand the risks involved and seek independent advice if necessary.
Disclaimer:
The above opinions given constitute general market commentary, and do not constitute the opinion or advice of IC Markets or any form of personal or investment advice.
Any opinions, news, research, analyses, prices, other information, or links to third-party sites contained on this website are provided on an "as-is" basis, are intended only to be informative, is not an advice nor a recommendation, nor research, or a record of our trading prices, or an offer of, or solicitation for a transaction in any financial instrument and thus should not be treated as such. The information provided does not involve any specific investment objectives, financial situation and needs of any specific person who may receive it. Please be aware, that past performance is not a reliable indicator of future performance and/or results. Past Performance or Forward-looking scenarios based upon the reasonable beliefs of the third-party provider are not a guarantee of future performance. Actual results may differ materially from those anticipated in forward-looking or past performance statements. IC Markets makes no representation or warranty and assumes no liability as to the accuracy or completeness of the information provided, nor any loss arising from any investment based on a recommendation, forecast or any information supplied by any third-party.

USDCHF - another opportunityTeam, this week, we done many trades with USDCHF and very successfully,
Tomorrow RATE announce and NO change.
that mean the USD will like moving strong against most currencies,
We found opportunity to RE-ENTER the USDCHF again
Target base on the chart.
TARGET 1 - reduce 30% volume
TARGET 2 - reduce another 50%
Target 3 - close the remaining
Please follow it accordingly. Do NOT forget to bring trail stop loss to BE once target 1 meet.

USD/CHF BEARS WILL DOMINATE THE MARKET|SHORT
Hello, Friends!
It makes sense for us to go short on USD/CHF right now from the resistance line above with the target of 0.820 because of the confluence of the two strong factors which are the general downtrend on the previous 1W candle and the overbought situation on the lower TF determined by it’s proximity to the upper BB band.
Disclosure: I am part of Trade Nation's Influencer program and receive a monthly fee for using their TradingView charts in my analysis.
✅LIKE AND COMMENT MY IDEAS✅

USDCHF LONG FORECAST Q2 W19 D6 Y25USDCHF LONG FORECAST Q2 W19 D6 Y25
Professional Risk Managers👋
Welcome back to another FRGNT chart update📈
Diving into some Forex setups using predominantly higher time frame order blocks alongside confirmation breaks of structure.
Let’s see what price action is telling us today!
💡Here are some trade confluences📝
✅Weekly order block rejection
✅Daily order block rejection
✅15’ order block
✅Intraday bullish breaks of structure
🔑 Remember, to participate in trading comes always with a degree of risk, therefore as professional risk managers it remains vital that we stick to our risk management plan as well as our trading strategies.
📈The rest, we leave to the balance of probabilities.
💡Fail to plan. Plan to fail.
🏆It has always been that simple.
❤️Good luck with your trading journey, I shall see you at the very top.
🎯Trade consistent, FRGNT X

USDCHF H4 I Bearish Fall from the 50% FIboBased on the H4 chart, the price is approaching our sell entry level at 0.8265, a pullback resistance that aligns with the 50% Fibo retracement.
Our take profit is set at 0.8195, an overlap support.
The stop loss is set at 0.8332, a swing high resistance.
High Risk Investment Warning
Trading Forex/CFDs on margin carries a high level of risk and may not be suitable for all investors. Leverage can work against you.
Stratos Markets Limited (tradu.com):
CFDs are complex instruments and come with a high risk of losing money rapidly due to leverage. 63% of retail investor accounts lose money when trading CFDs with this provider. You should consider whether you understand how CFDs work and whether you can afford to take the high risk of losing your money.
Stratos Europe Ltd (tradu.com):
CFDs are complex instruments and come with a high risk of losing money rapidly due to leverage. 63% of retail investor accounts lose money when trading CFDs with this provider. You should consider whether you understand how CFDs work and whether you can afford to take the high risk of losing your money.
Stratos Global LLC (tradu.com):
Losses can exceed deposits.
Please be advised that the information presented on TradingView is provided to Tradu (‘Company’, ‘we’) by a third-party provider (‘TFA Global Pte Ltd’). Please be reminded that you are solely responsible for the trading decisions on your account. There is a very high degree of risk involved in trading. Any information and/or content is intended entirely for research, educational and informational purposes only and does not constitute investment or consultation advice or investment strategy. The information is not tailored to the investment needs of any specific person and therefore does not involve a consideration of any of the investment objectives, financial situation or needs of any viewer that may receive it. Kindly also note that past performance is not a reliable indicator of future results. Actual results may differ materially from those anticipated in forward-looking or past performance statements. We assume no liability as to the accuracy or completeness of any of the information and/or content provided herein and the Company cannot be held responsible for any omission, mistake nor for any loss or damage including without limitation to any loss of profit which may arise from reliance on any information supplied by TFA Global Pte Ltd.
The speaker(s) is neither an employee, agent nor representative of Tradu and is therefore acting independently. The opinions given are their own, constitute general market commentary, and do not constitute the opinion or advice of Tradu or any form of personal or investment advice. Tradu neither endorses nor guarantees offerings of third-party speakers, nor is Tradu responsible for the content, veracity or opinions of third-party speakers, presenters or participants.

USD/CHF Reversal Setup (Read-Caption)🧠 Professional Technical Analysis – USD/CHF 💱
🗓️ Date: May 6, 2025
🕰️ Timeframe: Likely 4H or Daily
📊 Current Price: ~0.82218
🔍 Technical Indicators
🔵 EMA 20: 0.84190 (short-term trend)
🔴 EMA 50: 0.82524 (mid-term trend)
❗ Bearish crossover: EMA 20 is below EMA 50 → short-term bearish bias 🐻
📉 Support Zone Analysis 🛡️
🟥 Key Demand Zone (Support): 0.82084 – 0.81437
🔁 Price has bounced here before 🪃
🕯️ Candles with long lower wicks = buyers stepping in 🧍♂️💪
🟠 This is the “bounce zone” 📈
🧭 Trade Idea
✅ Long Entry: Around 0.82084–0.82200
🛑 Stop Loss: Below 0.81437 ❌
🎯 Take Profit: Around 0.83600 🟢
⚖️ Risk/Reward: Excellent (>2:1) if bounce holds 🚀
🔄 Price Action Outlook
📉 Downtrend approaching major support
🕯️ Looking for bullish candlestick confirmation (engulfing, hammer, etc.)
📈 Target area aligns with mean reversion to EMA 20
📌 Conclusion
👀 Watching for bullish reversal signs 🔄
🛒 Buy zone is clearly defined ✅
⛔ Setup is invalidated if price closes below 0.81437

USDCAD BULLISH OR BEARISH DETAILED ANALYSISUSDCAD is currently trading around 1.3820, exhibiting a bullish bias as it approaches the upper boundary of a consolidation range. The pair has been forming a symmetrical triangle pattern, indicating potential for a breakout. A decisive move above the 1.3850 resistance level could pave the way toward the 1.3920 target.
Fundamentally, the U.S. dollar has gained strength due to stronger-than-expected manufacturing data, with the ISM PMI rising to 48.7 in April, surpassing forecasts. This data has bolstered U.S. yields and supported the dollar. Conversely, the Canadian dollar has faced pressure from weaker domestic manufacturing activity, with the S\&P Global Canada Manufacturing PMI falling to 45.3, marking the sharpest contraction since May 2020 .
Additionally, recent U.S. tariff announcements on Canadian goods have introduced further uncertainty, potentially impacting Canada's export-driven economy. The Bank of Canada may consider easing monetary policy to counteract these challenges, which could further weaken the Canadian dollar.
In summary, USDCAD is poised for a potential breakout above 1.3850, driven by a combination of technical patterns and fundamental factors favoring the U.S. dollar. Traders should monitor key resistance levels and economic indicators to confirm the continuation of this upward trend.

USDCHF Trade IdeaUSDCHF trades flat despite upbeat US jobs data.It hits an intraday low of 0.82189 and is currently trading around 0.82590. Intraday bias appears to be bullish as long as the support 0.8180 holds.
The U.S. April 2025 Non-Farm Payrolls (NFP), released on May 2, 2025, reported decelerating employment expansion with a rise of 177,000 jobs, lower than a revised 185,000 in the prior month, while the unemployment rate held steady at 4.2%. Significant job gains were seen in health care, transport and warehousing, financial activities, and social assistance, but federal government jobs fell. Median hourly earnings increased 0.3% from last month and 3.8% over the year, and the average workweek continued at 34.3 hours.
Technical Analysis Points to Further Upside
The pair is trading below the 34-EMA and 55-EMA on the 4-hour chart indicates a minor down trend. The immediate resistance is at 0.8280 any break above targets 0.8300/0.8350/0.8380/0.8500.
Support Levels and Potential Declines
On the downside, near-term support is around 0.8180, any violation below will drag the pair to 0.8135/0.8090/0.8000.
Indicators
CCI (50) - Bearish
Directional movement Index - Neutral
Trading Strategy Recommendation
It is good to buy on dips around 0.8230 with a stop-loss at 0.8180 for a TP of 0.8500.
