Gold has reached the $3,400 level againThe Federal Reserve will announce the May FOMC interest rate decision and hold a press conference tomorrow.The market generally expects the interest rate to remain unchanged, but Powell's speech will be crucial. 👉👉👉The non - farm payrolls data in April was unexpectedly strong (with 177,000 new jobs added). Coupled with the Federal Reserve's concerns about inflation, Powell is likely to continue his hawkish stance and emphasize "inflation - fighting first". If he signals a delay in the timing of interest rate cuts, it may suppress the bullish sentiment in gold. Conversely, if he implies concerns about economic slowdown, gold may gain support.
Gold has recently broken through the key resistance of $3,330 and firmly stood above the $3,400 level. The daily chart shows a clear upward channel. Gold trading advice: Go long in the range of $3,380 - $3,390 on a pullback, with a stop - loss at $3,360 and a target of $3,430.
XAUUSD trading strategy
buy @ 3380-3390
sl 3270
tp 3420-3430
If you approve of my analysis, you can give it a thumbs-up as support. If you have different opinions, you can leave your thoughts in the comments.Thank you!👉👉👉
Wave Analysis

Bitcoin is likely to rise after its declineFrom the perspective of historical trends and technical indicators, when the short-term moving averages show a bullish arrangement, it is usually a relatively strong signal. However, the previously mentioned signs of a bearish divergence in the MACD indicator imply the risk of a pullback. If Bitcoin can break through the recent resistance level, such as $95,000, it may trigger a new round of upward trend. Conversely, if it fails to break through and the selling pressure continues to increase, there may be a certain degree of decline.👉👉👉
From the demand side, although the inflow of ETF funds is still lower than the level in 2024, the apparent demand has turned positive since the end of February, indicating a certain purchasing power. If this kind of demand continues to grow, it will provide support for the price of Bitcoin. On the supply side, the total amount of Bitcoin is fixed, and the increase in mining difficulty has slowed down the growth rate of new currency supply, which is conducive to price stability or increase to a certain extent.
BTCUSD Trading Strategy
buy @ 93500-9370
sl 925000
tp 94800-95000
If you approve of my analysis, you can give it a thumbs-up as support. If you have different opinions, you can leave your thoughts in the comments.Thank you!👉👉👉

$SPX Rejection at Resistance – Watch 5582 for the Next Major Mov📉 After tagging the 5685–5750 resistance zone, SP:SPX is flashing major downside risk.
🔍 Key Zones:
✅ Resistance tapped: 5705–5838
🟨 FVG (Fair Value Gap): 5642–5582
❗ Daily close below 5582 → Bearish WXY structure confirmed
🟥 Hard invalidation for bulls: 4835.04
💡 I’m open to a retest of the 200DMA (currently 5746), but below 5582 I wouldn’t expect a new high.
This setup offers clear structure, risk-defined short entries, and a measured breakdown scenario if support fails.

GOLD → An amazing recovery. Up to 3400?FX:XAUUSD continues to strengthen, testing resistance in the range, with buyers not giving up. The price breaks through the flat line and enters the buying zone; everything depends on the bulls...
Gold is rising for the second day in a row amid a weak dollar, increased demand for safe assets, and escalating conflicts in the Middle East and Eastern Europe.
Market nerves are being stoked by trade risks and instability in Asia, while investors await the Fed's decisions and Powell's speech.
GOLD is breaking out of its neutral range. Focus on 3369 and local resistance at 3381. The fundamental backdrop is favorable for gold. If buyers hold their ground above the indicated levels, the price may continue to rise.
Resistance levels: 3369, 3381, 3408
Support levels: 3352 (0.5f), 3330
I do not rule out the possibility of a retest of the local liquidity zone (long squeeze) at 3352 (0.5f) before continuing to rise. But at the moment, the focus is on 3369-3370, which are key levels (currently acting as support).
Best regards, R. Linda!

Gold: The Start Of The C Wave (Extreme Danger!)After the FED announces their business Gold (XAUUSD) is likely to crash-down and hard.
I will support my statement with data coming from this chart.
The crash doesn't necessarily need to happen instantly. My idea is that we are witnessing a classic ABC correction in Elliott Wave Theory terminology. Let's dive in.
» Trading volume peaked in early April and has been dropping considerably.
» The ATH session ended as a very strong bearish (reversal) signal.
» There is a strong bearish divergence with the RSI. The RSI peaked February 2025 while Gold (XAU) peaked recently. Here is the chart:
Currently, Gold is showing a bounce until the resumption of the corrective bearish move.
Gold is set to move lower based on my interpretation of this chart. Approach with caution, or, go SHORT. You can't go wrong by shorting the top/resistance. Sell at resistance, buy at support.
Namaste.

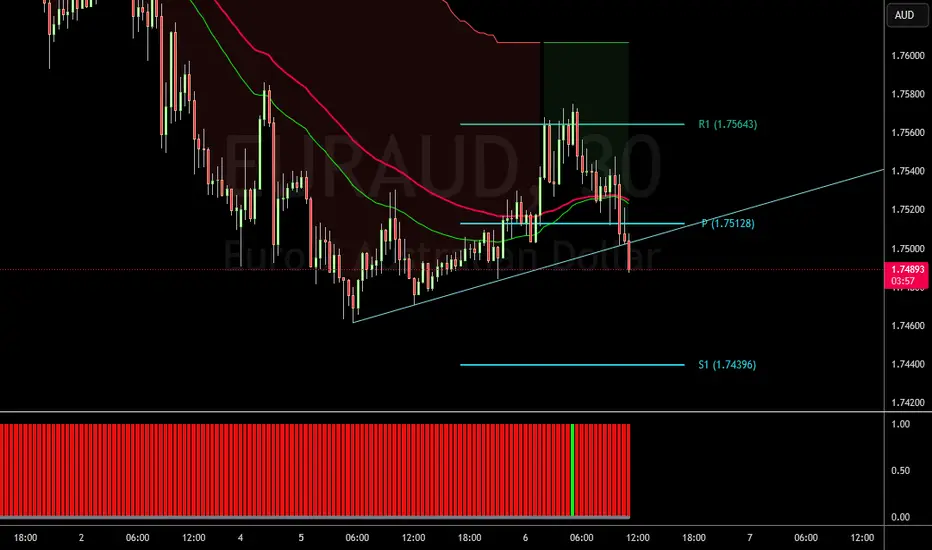
VIRTUALUSDT → Rebound from resistance. Trend break, U-turn?BINANCE:VIRTUALUSDT.P is pausing within an uptrend and forming a range within which signals of a possible reversal and decline are appearing.
Bitcoin is pausing its rally and moving into correction. This is a negative development for altcoins, which will not grow without the flagship.
VIRTUAL is consolidating, but pressure is building in the market (as can be seen from the cascade of resistance levels within the range). Another prerequisite for a breakdown of the market structure is a downward exit from the upward channel (a break of the trend support). Another retest of support at 1.581 could trigger a breakout and a fall. There is a fairly free zone below, and the nearest target is located in the 1.178 zone.
Resistance levels: 1.72, 1.829
Support levels: 1.581, 1.416, 1.178
Focus on the current range of 1.581 - 1.829. The chart shows that the price continues to storm and test support, which is an important signal against the backdrop of a broken uptrend. A break of support at 1.581 and consolidation below this level could trigger liquidation and a fall to the fvg zone or the liquidity zone at 1.178.
Best regards, R. Linda!

USDCAD → Storming the support level to break throughFX:USDCAD continues to storm support within the trading range amid a global downtrend
The currency pair is within the range, but the battle for support continues. The reaction to false breakouts is weakening and the price continues to attack the 1.378 level, which only increases the chances of a further decline
The dollar is rebounding from resistance and beginning to fall, which is having a corresponding effect on USDCAD. If the currency pair breaks 1.378 and consolidates below the level, this could trigger a continuation of the trend after consolidation...
Resistance levels: 1.381, 1.383
Support levels: 1.378, 1.374
Focus on the lower boundary of the trading range at 1.378. The role of the range is consolidation against the backdrop of a downtrend. Thus, a breakout of support will activate the distribution phase
Best regards, R. Linda!

Stromm | GOLD Bullish Continuation in PlayIt’s good to see Gold OANDA:XAUUSD getting the attention it deserves again. But honestly, the performance it’s putting in right now is just insane.
If you zoom into the 4-hour chart, you’ll spot a clear Demand Continuation Pattern:
Rally → Base → Rally.
In simple terms: strong move up, sideways consolidation, strong move up again.
The first rally pushed Gold up 9.77% within a few days, followed by a sideways base, and then another 9.6% rally straight into the $3,500 mark.
With commodities like Gold, you really feel how powerful psychological levels are — $3,000, $3,500, $4,000 — all massive magnet zones where large investors naturally look to take profits.
Now, after tagging $3,500, we’ve pulled back.
If this Demand Continuation structure holds, here's how I see it playing out:
Inside the current base, there’s a 4-hour order block, and it’s the one I’m watching most closely.
Ideally, we get a push up into the 4h Balance Price Range between $3,336–$3,347, followed by a rejection that sweeps the Previous Weekly Low, tagging that 4h order block for a proper retest.
From there, a move toward the 8h Balance Price Range would be good.
Now, two possibilities:
Best case for bears: After retesting that 4h zone, we fall further — possibly targeting $3,050.
Sneaky scenario: We fake a drop to trigger stop-losses, push back up toward $3,510, then properly roll over.
On the monthly chart, it gets even more interesting:
Given the massive rejection off $3,500, I wouldn’t rule out a much deeper retracement toward $2,500–$2,000 before Gold makes another serious attempt at $4,000.
That would perfectly fit into a larger Elliott Wave structure, completing a Wave 3 or setting up a Wave 5 push later.
(And yes — catching a Wave 3 top is brutal — especially when it is an all-time high)
Unless geopolitical events massively change the landscape, it feels like $3,500 is a strong local top — for now.
But if the world starts burning again?
Gold might have other plans.

PRIVI SPECIALITY CHEMICALS LIMITED (XNSE:PRIVISCL)PRIVI SPECIALITY CHEMICALS LIMITED (XNSE:PRIVISCL)
With Year on Year & QoQ increased Earnings with cup & handle pattern developing on charts - looking for a bullish trades

Break of channel , New wave downside, Algo short, wave downwards, break of trend.
There is 10% downside or more atleast, the market have gone up very much already and could be a healthy retracement.
XAUUSD (GOLD) | 4H | SWING TRADING Good morning, my friends,
Gold is currently at the 3355.0 level.
Even if gold makes a correction at this point, my target remains 3461.0.
This is a swing trading model, so there may be delays in reaching my target. However, I am confident that I will reach it eventually.
Once we hit that level, I will share an update for you all.
Dear friends, your likes are always my biggest motivation to keep sharing analyses. That’s why I kindly ask each of my followers to show their support—please don’t hold back on the likes.
I sincerely thank everyone who supports me with their likes. It truly means a lot

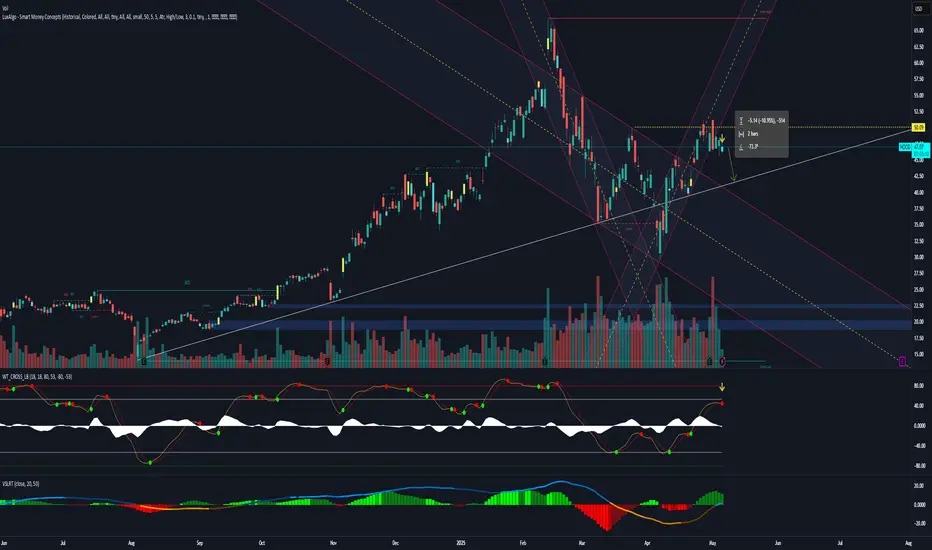
Marathon Petroleum Stock Quote | Chart & Forecast SummaryKey Indicators On Trade Set Up In General
1. Push Set Up
2. Range Set up
3. Break & Retest Set Up
Notes On Session
# Marathon Petroleum Stock Quote
- Double Formation
* Start Of (Anchored VWAP)) At 50.00 USD | Completed Survey
* Wave Feature On Uptrend Bias | Subdivision 1
- Triple Formation
* 188.00 & 84.00 USD Trade Window | Subdivision 2
- Retest Area At 120.00 USD
* (TP1) | Subdivision 3
* Daily Time Frame | Trend Settings Condition
- (Hypothesis On Entry Bias)) | Regular Settings
- Position On A 1.5RR
* Stop Loss At 115.00 USD
* Entry At 145.00 USD
* Take Profit At 187.00 USD
* (Uptrend Argument)) & No Pattern Confirmation
* Ongoing Entry & (Neutral Area))
Active Sessions On Relevant Range & Elemented Probabilities;
European-Session(Upwards) - East Coast-Session(Downwards) - Asian-Session(Ranging)
Conclusion | Trade Plan Execution & Risk Management On Demand;
Overall Consensus | Buy

Microsoft: Progress!Microsoft successfully completed the magenta wave (2) and made further progress during the subsequent wave (3). Imminently, this wave (3) has some more room to rise, and after a temporary pullback in the following wave (4), the price should eventually overcome the resistance at $456.16. On the other hand, our 31% likely alternative scenario envisions a new low for the green wave alt. and would include a detour below the support at $348.18. Primarily, we consider the regular wave as already completed (in our previous Target Zone).

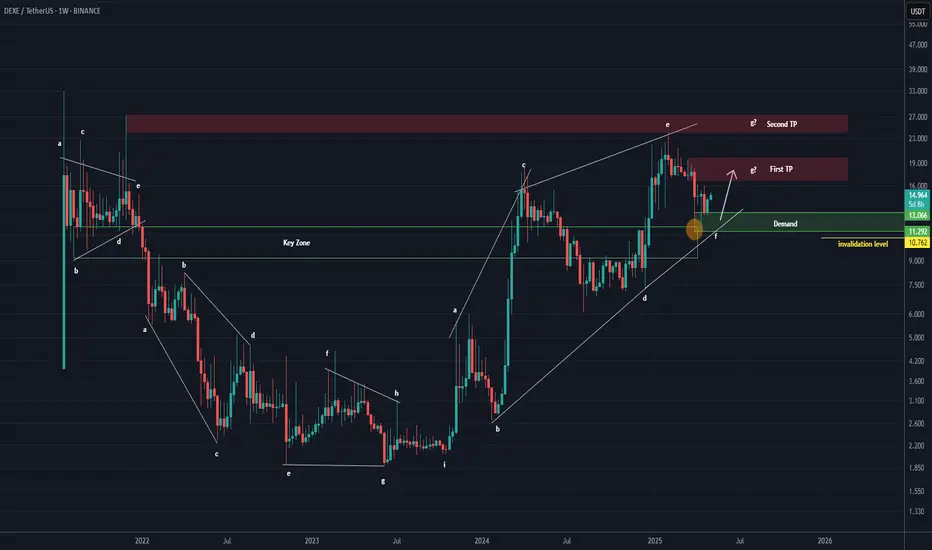
DEXE Analysis (1W)It appears to be in a bullish diametric pattern, and we are likely approaching the end of wave F.
If the price returns to the green zone, we will be looking for buy/long positions there.
We’ve marked two main targets on the chart, which represent the potential objectives for wave G.
A weekly candle closing below the invalidation level will invalidate this view.
For risk management, please don't forget stop loss and capital management
When we reach the first target, save some profit and then change the stop to entry
Comment if you have any questions
Thank You

Hanzo | Nas100 15 min Bearish Break – Next Move is Confirmed 🆚 Nas100 – Hanzo’s Strike Setup
🔥 Timeframe: 15-Minute (15M)
——————
💯 Main Focus: Bearish Break at 19870
We are watching this zone closely.
———
Analysis
👌 Market Signs (15M TF):
• Liquidity Grab + CHoCH at 20030
• Liquidity Grab + CHoCH at 19750
• Strong Rejections seen at:
➗ 19890 – Major support / Key level
➗ 20050 – Proven resistance
🩸 Key Zones to Watch:
• 19950 – 🔥 Bullish breakout level X 7 Swing Retest
• 19980 – Strong resistance (tested 5 times)
• 19900 – Equal lows
• 19980 – Equal highs

Looking for One More High So far, our minor B wave price action has not thrown us any curveballs, which is somewhat unusual considering B waves can become very complex. As I get into the micro price action, this pattern would fit better completed with at least one more high.
Nonetheless, I will offer a warning, we are in the target box...if you are long, please use stops, and make sure your position size is risk managed.
Best to all,
Chris

Solana SOL price analysisToday, a press release was published that CRYPTOCAP:SOL Strategies (aka MicroStrategy from the world of #Solana) bought another 122,524 CRYPTOCAP:SOL at $149
Earlier, the company said it would sell $500mn in convertible bonds, to buy #Solana, which capitalized now is at $74bn
Well, if you look at the OKX:SOLUSDT chart, we can say that it would be good to keep the price above $107-115, above the trendline, which has been going on since the beginning of 2023.
Once this condition is met, we can start dreaming again about the start of a super march of the #SOLUSD price to $790 in 2025.
_____________________
Did you like our analysis? Leave a comment, like, and follow to get more

NIFTY Wait for a breakout: When the price crosses above the trendline, it could be a bullish signal.
Monitor for a breakdown: If the price breaks below the trendline, it could be a bearish signal.
If you find this helpful and want more FREE forecasts in TradingView, Hit the 'BOOST' button
Drop some feedback in the comments below! (e.g., What did you find most useful?
How can we improve?)
Your support is appreciated!
Now, it's your turn!
Be sure to leave a comment; let us know how you see this opportunity and forecast.
Have a successful week
DISCLAIMER: I am NOT a SEBI registered advisor or a financial adviser. All the views are for educational purpose only

NESTLE INDIA If the price bounces from this support, the next resistance level could be around 2,450–2,500.
If the price breaks this support, it would be a bearish breakdown, and the price could fall to 2,250 or even lower.
If you find this helpful and want more FREE forecasts in TradingView, Hit the 'BOOST' button
Drop some feedback in the comments below! (e.g., What did you find most useful?
How can we improve?)
Your support is appreciated!
Now, it's your turn!
Be sure to leave a comment; let us know how you see this opportunity and forecast.
Have a successful week
DISCLAIMER: I am NOT a SEBI registered advisor or a financial adviser. All the views are for educational purpose only

MAZAGON DOCK SHIPBUILRetest of the Neckline: After the breakout, the price has come back down to retest the neckline. This is a normal and healthy move to confirm the previous resistance as a new support.
If the price bounces from this neckline support, there is a strong possibility of an upward move, with the next target potentially around 3,400–3,600.
However, if the price breaks below this neckline support, the pattern may fail, and the price could fall to around 2,600 or lower.
If you find this helpful and want more FREE forecasts in TradingView, Hit the 'BOOST' button
Drop some feedback in the comments below! (e.g., What did you find most useful?
How can we improve?)
Your support is appreciated!
Now, it's your turn!
Be sure to leave a comment; let us know how you see this opportunity and forecast.
Have a successful week
DISCLAIMER: I am NOT a SEBI registered advisor or a financial adviser. All the views are for educational purpose only

TAOLonging TAO as seen in the chart with TP and SL as it confirmed my entry and validated the OB and Broke structure the the upside.
Goodluck!

USDJPY Retest of Supply Zone Before Bearish ContinuationUSDJPY pair is reacting to key supply around 143.70–144.00 but shows signs of weakness after failing to hold above this level. With renewed risk-off sentiment and escalating global trade tensions—especially involving Japan and the U.S.—this pair may be setting up for a bearish continuation. Here's what both the chart and macro backdrop suggest.
📊 Technical Breakdown (4H Chart)
Key Supply Zone Retested:
The pair retraced into a previously broken structure zone (blue box), rejecting the 143.70–144.00 area multiple times.
Price is now forming lower highs, indicating bearish pressure building beneath resistance.
Bearish Continuation Pattern:
Price action resembles a bear flag, with a minor pullback likely before continuation lower.
A retest of 143.00–143.50 could serve as an ideal sell zone.
Major Support Levels:
142.04–142.02: Immediate support, already tested.
140.16: Key structure low from late April.
138.04: Final measured move target based on Fibonacci extension and prior demand zone.
Bearish Trade Setup:
Entry Zone: 143.00–143.50
Stop: Above 145.35
TP1: 142.00
TP2: 140.15
TP3: 138.00
🌐 Macro Fundamentals
Trump Tariffs Stir Instability:
President Trump is pressing Japan in trade talks with threats of new tariffs, already impacting investor confidence
A 25% tariff on Japanese auto exports has gone into effect, disrupting trade negotiations.
Urgency for a Deal, But No Progress Yet:
Trump says multiple deals are “coming,” but little substance has emerged. Analysts fear economic fallout and potential global recession if tensions continue
JPY Strengthening on Safe-Haven Flows:
With U.S. economic indicators weakening and global uncertainty rising, the yen may benefit from risk aversion.
✅ Summary
USDJPY remains vulnerable to downside continuation from the 143–144 resistance zone. If price breaks below 142.00 again with conviction, expect momentum to build toward 140.15 and potentially 138.00.
