eth drops into februarygm,
what if i told you that ethereum is about to plunge by as much as 50%,
just as everyone is expecting the start of alt season?
what if i told you that the entire structure over the past few months has been corrective, setting the stage for a major liquidity grab below 2k?
you probably wouldn’t believe me.
---
here’s my theory:
the structure from the may 2024 peak (which i’ve labeled as a truncated 5th) down to the upcoming low in february 2025 which i expect to be just beneath 2k, is actually an expanded flat.
---
watching closely for a flush-out into feb,
with a downside target just beneath 2k.
Wave Analysis

GOLD BEARS WILL DOMINATE THE MARKET|SHORT
GOLD SIGNAL
Trade Direction: short
Entry Level: 3,224.05
Target Level: 3,072.86
Stop Loss: 3,325.09
RISK PROFILE
Risk level: medium
Suggested risk: 1%
Timeframe: 6h
Disclosure: I am part of Trade Nation's Influencer program and receive a monthly fee for using their TradingView charts in my analysis.
✅LIKE AND COMMENT MY IDEAS✅

USD/JPY SENDS CLEAR BULLISH SIGNALS|LONG
USD/JPY SIGNAL
Trade Direction: long
Entry Level: 143.111
Target Level: 151.918
Stop Loss: 137.243
RISK PROFILE
Risk level: medium
Suggested risk: 1%
Timeframe: 1D
Disclosure: I am part of Trade Nation's Influencer program and receive a monthly fee for using their TradingView charts in my analysis.
✅LIKE AND COMMENT MY IDEAS✅


AUD/USD BEARS ARE GAINING STRENGTH|SHORT
Hello, Friends!
We are going short on the AUD/USD with the target of 0.621 level, because the pair is overbought and will soon hit the resistance line above. We deduced the overbought condition from the price being near to the upper BB band. However, we should use low risk here because the 1W TF is green and gives us a counter-signal.
Disclosure: I am part of Trade Nation's Influencer program and receive a monthly fee for using their TradingView charts in my analysis.
✅LIKE AND COMMENT MY IDEAS✅

NZD/USD SELLERS WILL DOMINATE THE MARKET|SHORT
Hello, Friends!
We are now examining the NZD/USD pair and we can see that the pair is going up locally while also being in a uptrend on the 1W TF. But there is also a powerful signal from the BB upper band being nearby, indicating that the pair is overbought so we can go short from the resistance line above and a target at 0.576 level.
Disclosure: I am part of Trade Nation's Influencer program and receive a monthly fee for using their TradingView charts in my analysis.
✅LIKE AND COMMENT MY IDEAS✅

SPY LONG SET UP(BUY THE DIP)Entry 1 $500.00
Entry 2 $460.00
Stop loss $440.00
Take profit 1- $550.00
(Close 25%)
Take profit 2- $600.00
(Close 50%)
Take profit 3-$650.00
(Close 75%)
Take profit 4-$700.00
(Close 100%)

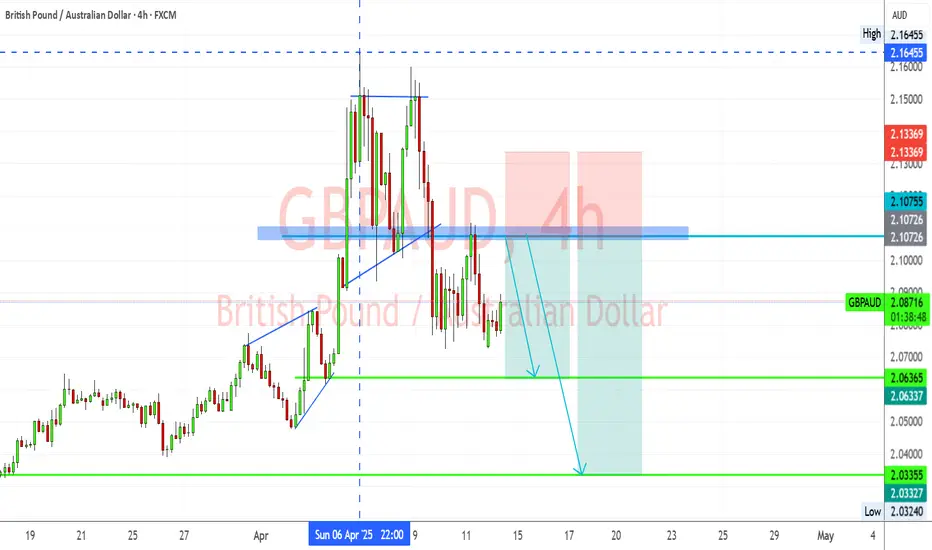
GBPAUD Bearish Rejection – Short Setup Below 2.1075GBPAUD has shown a clear rejection from the key supply zone around 2.1075, forming a lower high after a failed attempt to retest recent highs. This price action confirms weakness and opens the door for a potential bearish continuation.
Key Technical Zones:
Current Price: 2.0867
Resistance Zone (Supply): 2.1075 – 2.1336
Support Targets:
TP1: 2.0636 (structure support)
TP2: 2.0335 (demand zone)
Bearish Confluence Factors:
✅ Strong rejection from previous breakout zone
✅ Bearish engulfing setup forming under resistance
✅ Price structure showing lower highs and loss of bullish momentum
✅ Potential head and shoulders breakdown pattern forming
Trade Setup Idea:
📉 Bias: Bearish below 2.1075
📌 Entry Trigger: Breakdown below recent lows (~2.0820)
🎯 Target 1: 2.0636
🎯 Target 2: 2.0335
🛑 Invalidation Zone: Break and close above 2.1075
Conclusion:
GBPAUD looks poised for a downward continuation if the current rejection holds. A confirmed break below support could see price moving toward the 2.0636 and 2.0335 zones. Watch for clean bearish candle closes for added confirmation.
PSO PROBABLY IN WAVE '' C '' OR " 5 " OF CORRECTION - SHORTThis is in continuation to our ongoing tracking of PSO shared earlier in which we are anticipating price to reach 350 - 360 area to go long.
As our MARI trade (long) ended today making reasonable profit freeing our cash and since cash is trash, we have decided to take a small portion of short position in PSO.
If our wave count is correct then we will reach buy zone of 360-350 which will be our target for this short sell trade setup.
Risk/Reward ratio is not so promising on this one but we feel quite confident.
Trade setup:
Entry price: 377.50
Stop loss: 406
Target: 350 - 360
Let see how this plays, Good Luck!
Disclaimer: The information presented in this wave analysis is intended solely for educational and informational purposes. It does not constitute financial or trading advice, nor should it be interpreted as a recommendation to buy or sell any securities.

Market overview
WHAT HAPPENED?
Last week, our main scenario was implemented and a full–fledged rebound from the $77,000-$73,000 zone was achieved (volume anomalies, pushing volumes).
After passing through several large selling zones, we’ve reached a resistance level from which we can get a significant correction.
At the moment, the $85,600–$88,000 zone is being tested (absorption of the buyer's market aggression). The latest wave of buys, which began on April 10, is inertial. Trading volumes have decreased, and there is no clear dominance between one side and the other.
WHAT WILL HAPPEN: OR NOT?
There are strong anomalies along the delta, which can provoke a significant correction. Below the current price, we have a support zone of $82,700–$81,400, but with high activity from the seller, it can only slow down the fall slightly.
The main expectations are the beginning of a corrective movement, as indicated by the nature of growth, the current volume zone, as well as delta protection.
A less likely scenario is a surge in the buyer's market activity, which will take the quote above the $88,000 level. In this case, the priority will change dramatically to long.
Sell Zones:
$85,600–$88,000 (absorption of aggressive buyer activity)
$95,000–$96,700 (accumulated volumes)
$97,500–$98,400 (pushing volumes)
$107,000–$109,000 (volume anomalies)
Buy Zones:
$82,700–$81,400 (volume zone)
Level at $74,800
$69,000–$60,600 (accumulated volumes)
IMPORTANT DATES
The following macroeconomic events are expected:
• Wednesday, April 16, 2:00 (UTC) — publication of China's GDP for the first quarter and in comparison with the first quarter of 2024;
• Wednesday, April 16, 6:00 (UTC) — publication of the UK consumer price index for March and in comparison with March 2024;
• Wednesday, April 16, 09:00 (UTC) — publication of the consumer price index in the Eurozone for March and in comparison with March 2024;
• Wednesday, April 16, 12:30 (UTC) — publication of the basic index and volume of US retail sales for March;
• Wednesday, April 16, 13:45 (UTC) — announcement of Canada's interest rate decision;
• Wednesday, April 16, 17:15 (UTC) — speech by Fed Chairman Jerome Powell;
• Thursday, April 17, 12:30 (UTC) — publication of the number of initial applications for US unemployment benefits, as well as the Philadelphia manufacturing activity index from the Federal Reserve Bank for April;
• Thursday, April 17, 12:45(UTC) — European Central Bank press conference;
• Thursday, April 17, 13:15 (UTC) — announcement of the deposit rate in the Eurozone.
*This post is not a financial recommendation. Make decisions based on your own experience.
#analytics

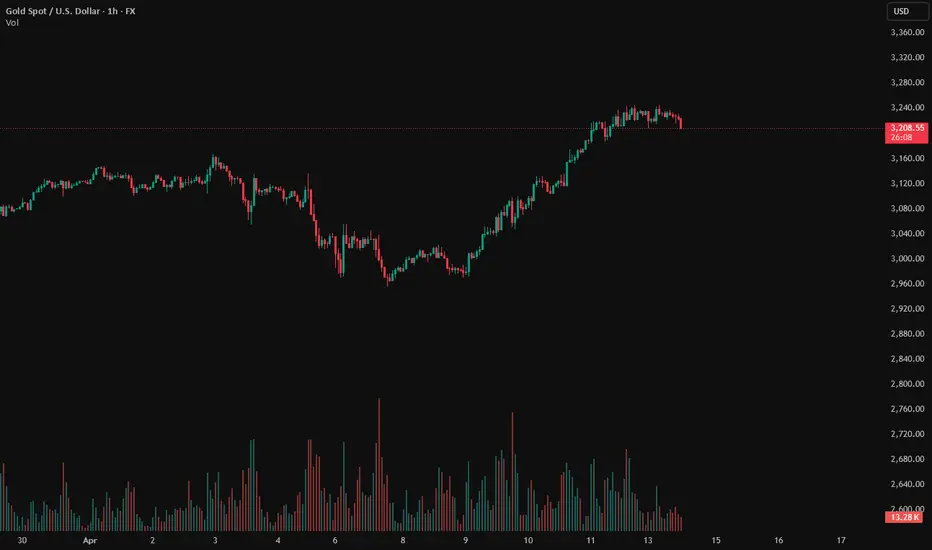
Gold price hits new high, 3216 as the dividing lineGold prices rose strongly by nearly $276 in three trading days, and broke through historical highs one after another. There is no highest, only higher.
There are many similar points in the rise, which can be summarized into five points. The first is the continued rise in the early trading and breaking through the new high. The second is the 0.382 position of the space adjustment and the same amplitude switching of the space. The third is the wandering back and forth sweep of the European session. The fourth is the flash of good points. The fifth is to learn to stop when you are ahead.
Combining these five points to look at the market situation, the gold price continues to rise. Last Friday, it closed directly at the high of 3237-3238 area.
Today The price opened lower in the morning and touched 3210, and hit a new high of 3245.6. But this time it was different. After the high, it fell back. The rise was 30 US dollars, and the high fell back 25 US dollars. Basically, the rise was as much as the fall. In the afternoon, the resistance of 3238 was confirmed for the second time, and it fell 22 US dollars again to find 3216, which was basically recovered.
The overall trend will be more adjusted. The cooperation between the high fall and the bottom recovery will provide momentum for the start of a new round of market.
Specifically, the key points to note are:
1. The correction range of the market space is at least 30 US dollars, and the start is at least 60 US dollars. Instead of focusing on the high and low issues, we should grasp the present.
2. The daily and weekly lines are rising strongly, and the indicators and patterns are overloaded. At present, only the direction is referenced; the four-hour pattern opening situation, the lifeline position is slightly far away, 3154 is close to the support point 3151 area that was stepped back late at night, and together they become the spatial dividing line. The resistance above is 3270-3275 and 3299.
3. The hourly chart pattern closed and flattened. Today's white market has been running back and forth around the upper and lower rails. The current pattern further closed the range of 3242-3216. Break through this space and then look at the space switch, and then cooperate with the small cycle double-line upper rail position 3194 area. If the price breaks the early low of 3210, it will switch space downward.
4. As shown in the figure, the price last week accelerated the rise and broke through 3190, and last Friday, it repeatedly broke through the new high around 3210, first the new high of 3238 (looking for 3210), then the new high of 3245 (looking for 3210), and then the new high of 3245.6
Now the price is down to 3216, which is also the starting point of the Asian session
Using 3216 as the switching point, the current sweeping space is about 30 US dollars, and the subsequent price breakthrough will switch the space of 30 US dollars
Focus on 3276-3278 upwards and 3186-3188 downwards
And it is very interesting that the 0.382 position of the latest wave of rise is also at 3187-3188
So, here we need to focus on the key points , with 3246-3216 as the range sweep, breaking through and switching to 30 US dollars, focusing on the support of the 3186-3188 area, and then looking at the upward switching space
In addition, it is necessary to remember that the online position is the 3131-3129 area, the top and bottom conversion position, and it is also a strong resistance level that turns into a strong support level after breaking through. After breaking through, it directly rises unilaterally
In summary, for gold at the beginning of the week, we treat it with a biased adjustment and sweeping idea. Referring to this idea, we have deployed high altitude twice in the 3236-3238 area. As of press time, the price fell to 3216, and all short orders were closed at 3217, waiting for the next plan. Now the price has risen again to 3230, and it continues to sweep, rushing high and falling, bottoming out and rising, which is in line with the above-mentioned biased sweeping and adjustment method.


META watch out if market is not completing a V-form
Mark does not look happy....
See that META is now below the MA, since it had the previous behavior of falling like a stone massive amount of percentage, it is more likely to do it again.
Look on this one carefully if you are long.
If the market will not complete the V-Formation, and shoot up, we may see the stock fall again, substantially.

XAUUSD - UniverseMetta - Signal#XAUUSD - UniverseMetta - Signal
H4 - Formation of double tops from the upper border of the diverging triangle. It is better to place the stop behind the maximum of the 1st wave.
Entry: 3209.786
TP: 3134.258 - 3100.990 - 3065.924 - 3025.462
Stop: 3251.931

the gold down as we expact before start to go upxauusd
enter=3195
TP1=3245
TP2=3363
TP3=3297
ST=3177

SOLV Looks Bearish (8H)SOLV appears to be completing an ABC or WXY pattern.
Recently, it lost a trendline, which is a significant bearish signal.
If it loses the white box, it could enter a heavy drop phase.
A daily candle closing above the invalidation level will invalidate this analysis.
For risk management, please don't forget stop loss and capital management
Comment if you have any questions
Thank You

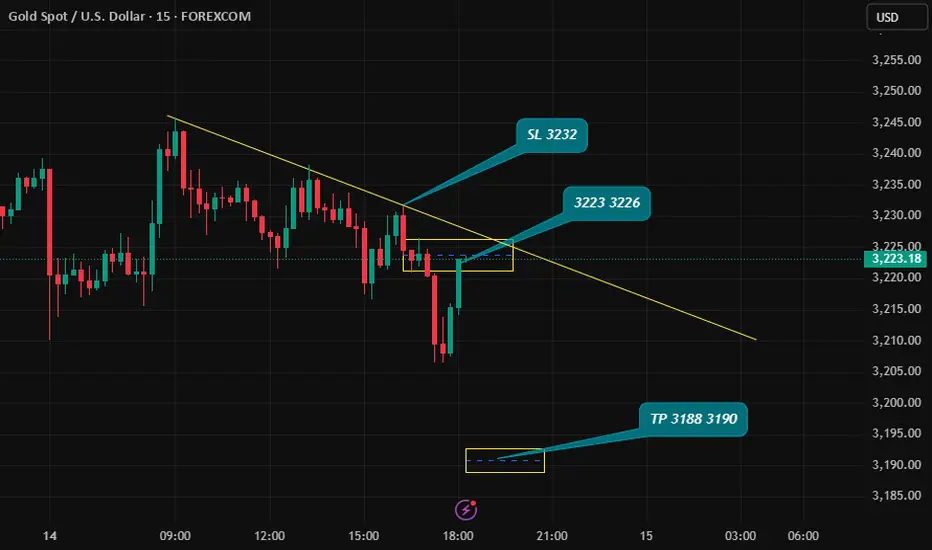
GOLD → Countertrend correction. What to do in this case?FX:XAUUSD , after a bull run, bumps into strong limit resistance at 3244 and enters a correction phase, which is generally a logical maneuver amid strong gains.
Gold corrects from Friday's record $3,245 and moves back to $3,200 amid improving market sentiment and progress in trade talks. The price pared gains after a strong weekly rally, reacting to U.S. concessions on tariffs on Chinese electronics and China's pledges to boost economic stimulus. Additional influences come from the dialog between the US and Iran, as well as the anticipation of China's GDP and trade data for March. Despite the pullback, downside may be limited due to ongoing uncertainty.
Technically, it is worth looking at the 3187 - 3167 conglomerate of support, which can stop (temporarily or even turn the price upward) a strong and sharp decline, as the fundamental backdrop within the tariff war is still tense.
Resistance levels: 3244, 3270
Support levels: 3187, 3174, 3167
The rally is temporarily halted, but there is no talk of a trend reversal, as the tariff war fire is still burning, Trump or Xi Jinping may add to the fire....
Within the framework of counter-trend correction, the emphasis is on the support of 3187, 3174, 3167 from which we can trade a false breakdown and catch the price rebound.
Regards R. Linda!

Bitcoin NEoWave Analysis Based on 6M Cash DataCash Data 6M
In the 6-month cash data for Bitcoin, it appears that a Running Neutral Triangle is forming and we are currently in wave-D of this triangle. Based on the previous mid-term Bitcoin analysis, as long as Bitcoin’s price remains above $70,000 there is potential for the price to rise to $150,000. Therefore, wave-D of the neutral triangle could expand and grow larger.
Until wave-D is complete, we cannot accurately predict the endpoint of wave-E( The label-E shown in the image is not precise and will likely change) However, after wave-D concludes, the price will experience at least a 50% correction to complete wave-E of the triangle, followed by a strong upward move in Bitcoin.
The analysis will be updated once wave-D is complete.
Good luck
NEoWave Chart

UPDATE - NDX/NQ!Good Morning,
NASDAQ setting itself in with come consolidation. We will need really strong volume to break up into bullish price action which is above the last resistance.
NDX - RESISTANC LEVEL - 19,492-19,8000 - HIGH VOLUME
NDX - SUPPORT LEVEL - 18,590- 18,309 LOW VOLUME
Enjoy!

NZDUSD - Bearish Control Soon!Hello TradingView Family / Fellow Traders. This is Richard, also known as theSignalyst.
📈NZDUSD has been hovering within a big range between $0.55 support and $0.59 resistance.
Currently, NZDUSD is retesting the upper bound of the wedge marked in blue.
Moreover, the $0.59 is a strong daily resistance zone.
🏹 Thus, the highlighted red circle is a strong area to look for sell setups as it is the intersection of the upper blue trendline and green resistance.
📚 As per my trading style:
As #NZDUSD is hovering around the red circle zone, I will be looking for bearish reversal setups (like a double top pattern, trendline break , and so on...)
📚 Always follow your trading plan regarding entry, risk management, and trade management.
Good luck!
All Strategies Are Good; If Managed Properly!
~Rich
Disclosure: I am part of Trade Nation's Influencer program and receive a monthly fee for using their TradingView charts in my analysis.

EURUSDI'm personally looking for long trade in EURUSD from these area's
My sl and Tp are mention
Follow the Risk Management

BTCUSDT - UniverseMetta - Analysis#BTCUSDT - UniverseMetta - Analysis
📆 W1 (Weekly Timeframe)
🔹 Will the 5th wave formation come to an end soon?
🔹 Best to wait for a confirmed bottom fractal — price action will become clearer by the end of this week.
🔹 If a fractal forms, then:
• Watch for a breakout and close above the channel
• Look for entry opportunities into the next bullish impulse
🎯 Potential upside targets: $91,500 – $112,200
📉 D1 (Daily Timeframe)
🔹 Price is testing the upper boundary of a narrowing channel
🔹 To confirm a short-term reversal, it's ideal to wait for a top fractal
🔹 From the last impulse, there’s a correction opportunity toward:
• $81,700 – $77,320 (40–80% retracement)
⚠️ Avoid increasing position size / exposure
🔁 Upon reaching the support zone — watch for bullish entries
⏳ H4 (4-Hour Timeframe)
🔹 Potential beginning of a 3rd wave down from the upper channel
🔹 A short setup could be valid if the 1st wave low is broken
🔹 Stop loss should be placed above the high of wave 1 or above the channel level
🎯 Short-term targets: 61% – 23% Fibonacci levels from the last bullish impulse
📈 Trade Setup (H4 idea):
Entry: 84,154.92 – *82,895.64
Take Profits (TP):
1. 81,702.63
2. 80,399.17
3. 79,029.42
4. 77,328.29
Stop Loss: 86,209.53
📌 Conclusion:
BTCUSDT is in a critical zone — potentially ending its 5th wave on the weekly chart.
The key is to wait for confirmation via fractals (bottom on W1, top on D1).
Meanwhile, H4 offers a chance to engage in a controlled short setup, with tight risk and clear invalidation.
